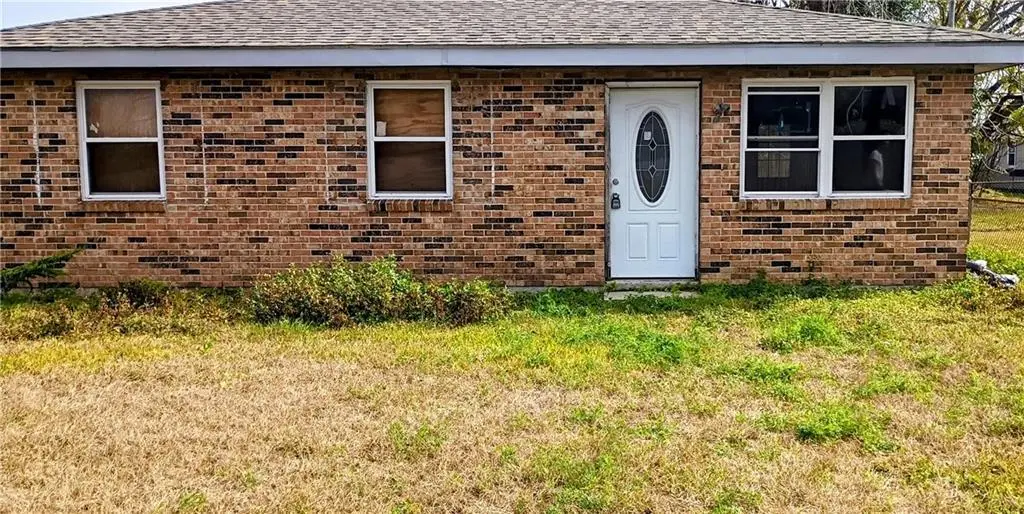
418 Center St · Waggaman, LA
Flood risk No data
- FEMA flood zone
- —
- Chance of flooding over 30 yrs
- —
- Est. flood insurance / yr
- —
Fire risk No data
- Est. fire insurance / yr
- —
Heat risk No data
- Hot days now (above threshold)
- —
- Hot days in 30 yrs
- —
Wind risk No data
- Chance of severe wind over 30 yrs
- —
Air-quality risk No data
- Unhealthy air days now
- —
- Unhealthy air days in 30 yrs
- —
Risk factors via First Street. Map © Google.
Why this score? — see what drove the B- grade
The composite is a weighted blend of 9 inputs, each scored 0–100. Each bar is that input's sub-score; the figure is the points it added to the 100-point composite (weight × sub-score).
- Cash flow +30.0/30.0
- 1% rule +10.0/10.0
- DSCR +10.0/10.0
- ARV discount +7.5/15.0
- Livability +3.1/5.0
- Schools +2.5/10.0
- Condition / age +2.5/5.0
- Rent growth +2.3/5.0
- Appreciation +0.0/10.0
$64,000
🖨 Deal sheet 📄 Offer letter ✓ Due diligence
Listing remarks MLS
Investor Special in Avondale! This totally gutted 3-bedroom, 1-bath property is a blank canvas ready for your vision. Interior has been taken down to the studs, making it easy to reconfigure, customize, and finish to your specifications. Opportunity for investors, flippers, or builders looking to add value in an established Avondale neighborhood. Bring your contractor and design ideas--all the hard demo work is already done. A renovation project, rental portfolio addition, or resale. Property sold as-is. Don't miss the chance to put your finishing touches on this value-add opportunity!
Key facts
- Good condition
- 4,356 sq ft lot
- Built 1974
Tags
Neighborhood map
What this means for you Summary
Snapshot
- This is a 3-bed/1.0-bath single-family listed at $64k.
Deal economics
- At list price, monthly cash flow is $954 ($11k/yr) — positive.
- The deal already cash-flows at list — no discount required.
- Meets the 1% rule at list price ($2k rent vs $64k).
- Recommended offer: $56k (12.0% below list) — sets the bar for market timing.
- Cap rate 24.2% vs local median 4.7% in Waggaman — top-decile yield for the area; either an underpriced asset or a hidden risk that comps aren't pricing in. Stress-test before assuming the spread holds.
Location & tenants
- Location reads 61/100 on livability (#226 in LA) — a middle-class / working-renter tenant base. Strengths: cost of living A+, housing A+; Watch: schools D, crime F, amenities F.
- Jefferson Parish (suburban): math 24% / reading 34% proficiency, ranked #44 of 98 in LA (top 45%) — low school quality limits family demand, transient renter base, plan for 1-2y turnover; 70% free/reduced lunch — lower-income household profile, screen leases tightly.
- Market conditions: Rents soft (-0.8%/yr); 186 active listings in the ZIP; 13 comparable units currently listed for rent nearby; rentals lingering (median 44d on market — plan ~5-8 weeks vacancy on turnover, expect pricing pressure); 54% of comp listings sitting > 30 days — soft ceiling on asking rent; 518 units permitted in Jefferson Parish in 2024 (43 in 5+ unit buildings).
- This rent runs 39% of the median local income ($54k/yr) — at the standard rent-burdened threshold; future hikes will face affordability resistance.
Forward outlook
- Local home prices are declining (-3.0%/yr); year-one equity from $442 of loan paydown is wiped out by about $2k of value loss. Plan a longer hold.
- At projected returns (-3.0% appreciation + 0.0% rent growth), your $18k cash investment doubles in ~2 years — after that, you're playing with house money.
Negotiation context
- It's been on market 132 days — a 12% lower offer ($56k) is reasonable based on typical stale-listing flexibility.
- 3 sale attempts since 4y ago; this cycle's ask has dropped $4k (6%) from the opening price — seller is motivated, your offer sets the floor, not the list.
- Current owner paid $50k; 28% above their basis — modest negotiation headroom, anchor on the comps not their cost.
Questions for the listing agent
- It's been on market 132 days. Have you received any prior offers? Is the seller open to a 12% concession, seller financing, or rate buy-down credit?
- Built in 1974 — when were the roof, HVAC, electrical panel, plumbing, and water heater last replaced?
- Why hasn't it sold? Are there any deal-killer items the seller is aware of (foundation, flood, title, zoning, code violations)?
- Is there a deadline driving the sale (1031 exchange, divorce, estate, relocation)? That informs how much negotiation room exists.
- Schools are D-rated, which usually means shorter tenancies and higher turnover. Who's the typical renter profile here, and what's been the actual vacancy rate?
- Crime grade is F in this area — have there been break-ins, vandalism, or insurance claims at this property in the last 3 years? What carrier currently insures it and at what premium?
- What's the average days-on-market for RENTAL listings here right now (not sales)? A rising rental-DOM trend means longer vacancies and softer asking-rent achievability than the comps imply.
- What's the recent tenant-quality profile in this submarket — average credit score on applications, eviction rate, late-payment / NSF rate, and stable-employment percentage? A property-management company in the area should have these aggregated.
- How much new for-sale + rental construction is in the pipeline within 1–3 miles? Heavy new supply typically softens prices + rents 12–24 months out; constrained supply supports both.
Investment metrics
- 1% rule
- 2.71% ✓
- Cap rate
- 24.19%
- Cash-on-cash
- 63.92%
- DSCR
- 3.84
- GRM
- 3.1
CMA / ARV
- ARV (median comp)
- $147,055
- List price
- $64,000
- Delta
- -56.48%
- Verdict
- UNDERPRICED
- Comps
- 20 within 1.0 mi
Show comp detail 12 sales within ~0.75 mi
| Address | Dist | Beds/Ba | Sqft | Sold | Price | $/sf | Match |
|---|---|---|---|---|---|---|---|
| 176 Prairie View Ct | 0.42mi | 3/1.5 | 1,017 (+2%) | 6mo | $115,000 | $113 | 70 |
| 173 S Tish Dr | 0.34mi | 3/2.0 | 1,058 (+6%) | 1mo | $130,000 | $123 | 70 |
| 333 Glendella Dr | 0.62mi | 3/1.0 | 1,001 (+0%) | 6mo | $63,000 | $63 | 66 |
| 248 Jamie Blvd | 0.55mi | 3/1.0 | 996 (-0%) | 10mo | $70,000 | $70 | 66 |
| 168 N Betty Ln | 0.42mi | 3/1.5 | 1,100 (+10%) | 3mo | $158,000 | $144 | 60 |
| 156 Felicia Dr | 0.38mi | 2/1.0 (-1) | 935 (-6%) | 10mo | $156,000 | $167 | 58 |
| 129 Prarieview Ct | 0.31mi | 3/1.5 | 1,100 (+10%) | 12mo | $130,000 | $118 | 57 |
| 181 Rosalie Dr | 0.47mi | 3/1.5 | 1,109 (+11%) | 2mo | $105,000 | $95 | 56 |
| 108 Carmen Dr | 0.53mi | 3/1.5 | 1,009 (+1%) | 20mo | $149,000 | $148 | 55 |
| 112 Mandy Dr | 0.59mi | 3/1.0 | 940 (-6%) | 20mo | $127,900 | $136 | 46 |
| 172 Cambay Dr | 0.37mi | 3/2.0 | 1,132 (+13%) | 15mo | $179,000 | $158 | 44 |
| 304 Deacon St | 0.65mi | 3/2.0 | 1,147 (+15%) | 12mo | $172,500 | $150 | 31 |
Match score weights: distance 35% · size 25% · config 20% · recency 20%. Top-matched comps best support the ARV.
Projected returns pro-forma
-3.0% appreciation · 0.0% rent growth · sell at horizon
- IRR
- 59.6%
- Equity multiple
- 3.53×
- Total profit
- $45,347
- Equity at exit
- $9,543
- IRR
- 63.3%
- Equity multiple
- 6.48×
- Total profit
- $98,160
- Equity at exit
- $5,534
Cash invested: $17,920 (down + closing). Projections, not guarantees.
Landlord ↔ Tenant lean methodology
- Overall (STATE)
- 90 Strongly Landlord-Friendly
- State Louisiana
- 90 Strongly Landlord-Friendly · R+12
- County
- — inherits STATE
- City
- — inherits STATE
ZIP-level market 70094
- Rents YoY
- -0.8%
- Active inventory
- 186
- Price-to-rent
- 3.1×
Monthly cashflow live
- Estimated rent
- $1,735 high interval (Pro) →
- Mortgage (P&I)
- −$336
- Tax from tax record
- −$54 /mo · $643/yr
- Insurance
- −$27
- HOA
- −$0
- Vacancy / Maint / Mgmt
- −$364
- Net cashflow
- $954
Break-even live
UW: 25.0% down · 7.5% · 30yr · 1.5% tax · 5.0% vac · 8.0% maint · 8.0% mgmt
Financing live
Cash to close
- Down payment
- $16,000
- Closing costs
- $1,920
- Reserves months
- —
- Total cash needed
- —
Loan-product check · same deal, 3 products live
Conventional
25% down · 7.5% · 30yr
- Down + closing
- —
- Monthly P&I
- —
- Monthly cashflow
- —
- DSCR
- —
- Eligible?
- —
Personal DTI + credit; lowest rate.
DSCR
20% down · 8.5% · 30yr
- Down + closing
- —
- Monthly P&I
- —
- Monthly cashflow
- —
- DSCR
- —
- Eligible?
- —
No personal income docs; deal must DSCR.
Hard money
10% down · 12.0% · 12mo
- Down + closing
- —
- Monthly P&I
- —
- Monthly cashflow
- —
- DSCR
- —
- Eligible?
- —
Short-term bridge; refi at stabilization.
Rent comps 13 comps
| Address | Beds | Baths | Sqft | Rent | $/sqft | DOM | Units | Dist |
|---|---|---|---|---|---|---|---|---|
| 304 Butler Dr Westwego, LA | 4.0 | 2.0 | 1200 | $2,300 | $1.92 | 43d | 1 | 0.26mi |
| 185 Carmen Dr Westwego, LA | 3.0 | 1.0 | 900 | $1,600 | $1.78 | 43d | 1 | 0.29mi |
| 441 Butler Dr Westwego, LA | 3.0 | 2.0 | 1200 | $1,450 | $1.21 | 23d | 1 | 0.32mi |
| 441 Butler Dr Westwego, LA | 3.0 | 1.5 | 1200 | $1,450 | $1.21 | 43d | 1 | 0.32mi |
| 384 Layman St Westwego, LA | 3.0 | 2.0 | 1258 | $1,560 | $1.24 | 43d | 1 | 0.49mi |
| 145 S Dexter Dr Westwego, LA | 3.0 | 1.5 | 1200 | $1,400 | $1.17 | 23d | 1 | 0.56mi |
| 351 Glendella Dr Westwego, LA | 3.0 | 1.5 | 1200 | $1,600 | $1.33 | 43d | 1 | 0.62mi |
| 351 Glendella Dr Westwego, LA | 3.0 | 1.5 | 1350 | $1,450 | $1.07 | 4d | 1 | 0.62mi |
| 113 Jeanne Dr Westwego, LA | 3.0 | 2.0 | 800 | $1,950 | $2.44 | 14d | 1 | 0.76mi |
| 101 Ursula Dr Westwego, LA | 3.0 | 1.5 | 1400 | $1,600 | $1.14 | 14d | 1 | 0.85mi |
| 89 Marie Dr Westwego, LA | 4.0 | 1.5 | 1100 | $1,600 | $1.45 | 43d | 1 | 1.07mi |
| 76 Elaine Dr Westwego, LA | 3.0 | 1.5 | 1100 | $1,500 | $1.36 | 43d | 1 | 1.23mi |
| 96 Park Ave New Orleans, LA | 3.0 | 1.0 | 1100 | $1,900 | $1.73 | 23d | 1 | 1.41mi |
Listing history 21 events
-
2026-06-18days on market $64,000 Active 132 DOM
-
2026-06-17days on market $64,000 Active 131 DOM
-
2026-06-16days on market $64,000 Active 130 DOM
-
2026-06-15days on market $64,000 Active 129 DOM
-
2026-06-13days on market $64,000 Active 127 DOM
-
2026-06-10days on market $64,000 Active 124 DOM
-
2026-06-09days on market $64,000 Active 123 DOM
-
2026-06-08days on market $64,000 Active 122 DOM
-
2026-06-07days on market $64,000 Active 121 DOM
-
2026-06-03days on market $64,000 Active 117 DOM
-
2026-06-02days on market $64,000 Active 116 DOM
-
2026-06-01days on market $64,000 Active 115 DOM
-
2026-05-31days on market $64,000 Active 114 DOM
-
2026-04-15price $64,000 592-char remark
Show marketing remark (603 chars)
Investor Special in Avondale! This totally gutted 3-bedroom, 1-bath property is a blank canvas ready for your vision. Interior has been taken down to the studs, making it easy to reconfigure, customize, and finish to your specifications. Opportunity for investors, flippers, or builders looking to add value in an established Avondale neighborhood. Bring your contractor and design ideas—all the hard demo work is already done. A renovation project, rental portfolio addition, or resale. Property sold as-is. Don’t miss the chance to put your finishing touches on this value-add opportunity!
-
2026-04-15price $64,000 603-char remark
Show marketing remark (603 chars)
Investor Special in Avondale! This totally gutted 3-bedroom, 1-bath property is a blank canvas ready for your vision. Interior has been taken down to the studs, making it easy to reconfigure, customize, and finish to your specifications. Opportunity for investors, flippers, or builders looking to add value in an established Avondale neighborhood. Bring your contractor and design ideas—all the hard demo work is already done. A renovation project, rental portfolio addition, or resale. Property sold as-is. Don’t miss the chance to put your finishing touches on this value-add opportunity!
-
2026-01-23$68,000 Active 592-char remark
Show marketing remark (603 chars)
Investor Special in Avondale! This totally gutted 3-bedroom, 1-bath property is a blank canvas ready for your vision. Interior has been taken down to the studs, making it easy to reconfigure, customize, and finish to your specifications. Opportunity for investors, flippers, or builders looking to add value in an established Avondale neighborhood. Bring your contractor and design ideas—all the hard demo work is already done. A renovation project, rental portfolio addition, or resale. Property sold as-is. Don’t miss the chance to put your finishing touches on this value-add opportunity!
-
2026-01-23$68,000 Active 603-char remark
Show marketing remark (603 chars)
Investor Special in Avondale! This totally gutted 3-bedroom, 1-bath property is a blank canvas ready for your vision. Interior has been taken down to the studs, making it easy to reconfigure, customize, and finish to your specifications. Opportunity for investors, flippers, or builders looking to add value in an established Avondale neighborhood. Bring your contractor and design ideas—all the hard demo work is already done. A renovation project, rental portfolio addition, or resale. Property sold as-is. Don’t miss the chance to put your finishing touches on this value-add opportunity!
-
2024-11-26soldstatus $50,000
-
2022-12-16soldstatus $50,000
-
2022-11-21$50,000
-
1997-08-01soldstatus
ⓘ Source: listings_history table (triggers on properties + properties_extension) + one-shot
backfill from property_details.listing_events for pre-trigger history.
Tax reassessment forecast LA · Resets to sale price
- Current annual tax
- $643 · $54/mo
- Projected year-2 tax
- $643 · $54/mo
- Expected delta
- $0/yr ($0/mo · 0.0%)
ⓘ Screening estimate from a state-policy table — verify with the county assessor before closing.
Nearby sold comps map
Loading sold comps map…
Walkable amenities ~0.75 mi
Loading nearby amenities…
Taxation est. · year 1
- Rental income
- $20,816
- − Mortgage interest
- −$3,585
- − Property taxes
- −$643
- − Insurance
- −$320
- − Repairs & maintenance
- −$1,665
- − Management
- −$1,665
- − Depreciation
- −$1,862
- Taxable income
- $11,075
- Est. tax owed @ 24.0%
- −$2,658
- After-tax cash flow
- $8,796/yr
For passive investors: Depreciation is non-cash, so a rental often shows a tax loss while cash-flowing — sheltering income. Rental losses are passive: they offset passive income freely, and up to $25,000/yr can offset ordinary (W-2) income if you actively participate and your MAGI is under $100k (phasing out to $0 by $150k); unused losses carry forward. On sale, claimed depreciation is recaptured at up to 25%, and gains may owe capital-gains tax (a 1031 exchange can defer both). Figures are a year-1 estimate at your 24.0% rate — not tax advice; consult a CPA.
Schools (NCES district)
- District
- Jefferson Parish
- NCES district ID
- 2200840
- Math proficiency
- 24% ▼ -36.00%
- Reading proficiency
- 34% ▼ -30.00%
- Median HH income
- $48,421
- Composite
- 25.19/100
- National rank
- #7511
- State rank
- #44 of 98 in LA
Livability — Waggaman
- Score
- 61/100
- State rank
- #226
- US rank
- #17364
Category grades
Schools grade is shown separately in the Schools card above.
Census & demographics
- Census place
- Waggaman, LA
- County
- Jefferson Parish · 426,999 people
- Metro
- New Orleans-Metairie, LA
- Population (ZIP)
- 32,130
- Household income
- $53,597
- Rent vs Own
- Severe rent burden
- 1457.0
Population outlook (Jefferson County) Hauer SSP2
- Today (2025)
- 451,696 people
- By 2030
- 455,451 · +0.8%
- By 2040
- 458,308 · +1.5%
- By 2050
- 461,031 · +2.1%
- By 2075
- 476,351 · +5.5%
- By 2100
- 499,377 · +10.6%
Race, ethnicity, and origin ACS 2023
- Neighborhood character
- Diverse neighborhood (Simpson 0.65)
- Race & ethnicity
- Black 46% White 36% Hispanic / Latino 13% Two or more races 6% Asian 2%
- Hispanic origin (detail)
- Mexican 2% Dominican 2%
- Common ancestry
- Lithuanian 9% Scottish 1%
- Foreign-born
- 8% · Canada, Vietnam
- Languages at home
- 86% English-only · Spanish 11% Vietnamese 2% French/Haitian/Cajun 1%
Political lean MEDSL · Jefferson
- 2024 margin
- R (+12.9) · D 42.5% · R 55.5% · Other 2.1%
- 2008→2024 swing
- +13.6pp toward D · 2008: -26.6pp · 2024: -12.9pp
- All cycles
- 2024: R+12.9 2020: R+11.1 2016: R+14.8 2012: R+18.4 2008: R+26.6
Not yet ingested
- Civics
- —
Market trends
- HPI YoY
- ▼ -111.56%
- Current HPI
- 102.9992
- Rent YoY
- ▼ -0.80%
- Metro
- New Orleans-Metairie, LA
- State GDP YoY
- ▲ 3.29%
- F500 in state
- 10
Industry mix (Fortune 500 HQ in LA)
| Industry | F500 HQs | Revenue |
|---|---|---|
| Telecommunications | 2 | $23B |
|
||
| Utilities | 1 | $12B |
|
||
| Wholesale / Distribution | 1 | $5B |
|
||
| Advertising | 1 | $2B |
|
||
Price history
+28.0% since first listed8 events — show timeline
- 2026-04-15 Price Changed $64,000 AcadianaMLS
- 2026-04-15 Price Changed $64,000 GSREIN
- 2026-01-23 Listed $68,000 GSREIN
- 2026-01-23 Listed $68,000 AcadianaMLS
- 2024-11-26 Sold (Public Records) $50,000 Public Records
- 2022-12-16 Sold (Public Records) $50,000 Public Records
- 2022-11-21 Listed $50,000 AcadianaMLS
- 1997-08-01 Sold (Public Records) — Public Records
Property tax history
-1.7%/yrLatest (2025): $643 · -25.4% YoY. Source: county tax records.
Cash-flow waterfall
monthlySold comps — $/sqft
last 12 mo · ≤1 miLoading sold comps…