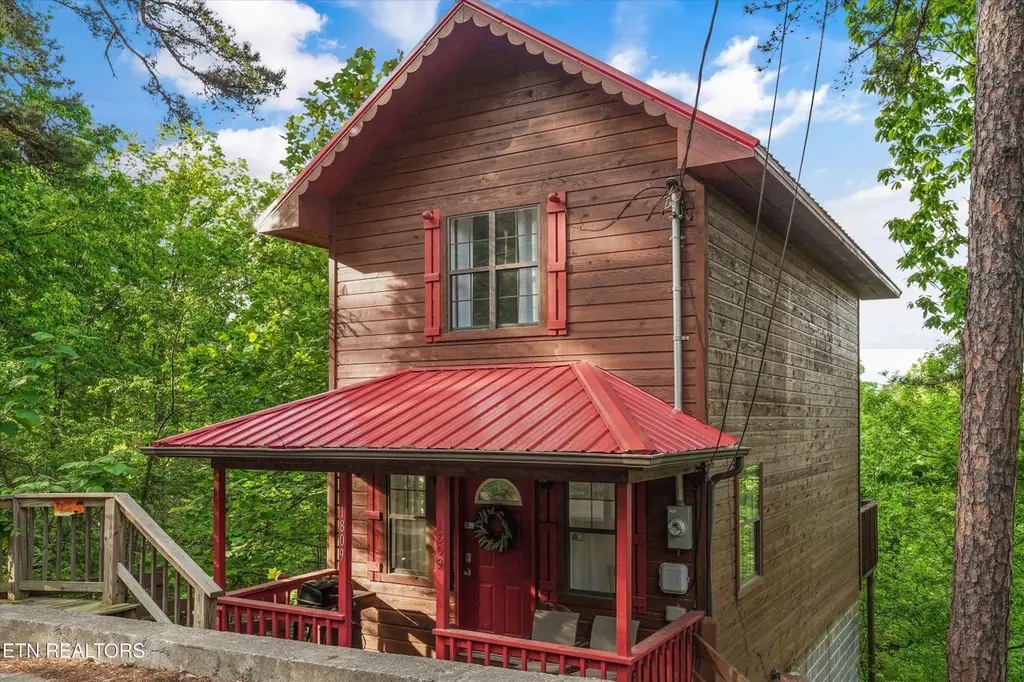
1809 Red Bone Way · Pigeon Forge, TN
Flood risk 1/10 · Minimal
- FEMA flood zone
- X (unshaded)
- Chance of flooding over 30 yrs
- 0.0%
- Est. flood insurance / yr
- $507 – $1,088
Fire risk 6/10 · Moderate
- Est. fire insurance / yr
- $949 – $1,763
Heat risk 5/10 · Moderate
- Hot days now (above 101°F)
- 7 days/yr
- Hot days in 30 yrs
- 21 days/yr
Wind risk 2/10 · Minimal
- Chance of severe wind over 30 yrs
- —
Air-quality risk 2/10 · Minimal
- Unhealthy air days now
- 1 days/yr
- Unhealthy air days in 30 yrs
- 2 days/yr
Risk factors via First Street. Map © Google.
Why this score? — see what drove the D- grade
The composite is a weighted blend of 9 inputs, each scored 0–100. Each bar is that input's sub-score; the figure is the points it added to the 100-point composite (weight × sub-score).
- ARV discount +15.0/15.0
- Appreciation +10.0/10.0
- Cash flow +3.9/30.0
- Livability +3.6/5.0
- Schools +2.5/10.0
- Condition / age +2.5/5.0
- Rent growth +1.9/5.0
- 1% rule +0.0/10.0
- DSCR +0.0/10.0
$350,000
🖨 Deal sheet 📄 Offer letter ✓ Due diligence
Listing remarks MLS
Tucked into the trees of the desirable Fox Run community, this striking cabin makes an unforgettable first impression with its red metal roof, matching shutters, and classic wood siding--all anchored by a welcoming covered front porch that sets the tone for true Smoky Mountain living. Step inside to a dramatic open-concept living space featuring soaring ceilings, a stacked stone fireplace, and an airy loft that floods the home with natural light. A warm pine staircase leads to a spacious upper-level bedroom complete with a private en-suite bath, offering both comfort and privacy for guests or owners alike. The updated kitchen blends modern style with cabin charm, showcasing two-tone navy and white cabinetry, granite countertops, stainless steel appliances, and a seamless flow into the dining area highlighted by a contemporary chandelier. Just minutes from Pigeon Forge and Gatlinburg, this property offers the rare balance of convenience and seclusion--feeling worlds away while remaining close to top attractions like Dollywood, being only 10 minutes away. Whether you're looking for a private mountain retreat or a high-performing short-term rental, this cabin checks all the boxes. The purchase of 1809 Red Bone Way includes the adjacent parcel identified as (Parcel ID: 095C D 023.00). Both Parcels will be conveyed together as part of the sale.
Key facts
- 0.53 acre lot
- Built 2000
- Listed 49 days
Property features AI
Exterior
- Parking: Main level parking
- Utilities: Septic tank
- Home design: Detached property; 900 building area (per tax records)
- Construction: Wood siding; Block construction; Frame construction
- Exterior features: Wooded lot; Mountain view
Interior
- Kitchen: Dishwasher; Microwave; Self-cleaning oven; Refrigerator; Eat-in kitchen layout
- Flooring: Laminate
- Bathrooms: 1 full bathroom; 1 half bathroom
- Heating & cooling: Central heating; Heat pump; Electric heating; Central cooling
- Interior features: Cathedral ceilings; Eat-in kitchen; 6 total rooms; Wood-burning fireplace
- Laundry & utility: Washer; Dryer
Neighborhood map
What this means for you Summary
Snapshot
- This is a 1-bed/2.0-bath single-family listed at $350k.
Deal economics
- At list price, monthly cash flow is $-1k ($-12k/yr) — negative.
- To cash-flow at today's rent, offer at most $173k (50.5% below list).
- To meet the 1% rule (rent ≥ 1% of price), the offer needs to be $136k (61.2% below list).
- Recommended offer: $136k (61.2% below list) — sets the bar for 1% rule.
- Cap rate 2.9% vs local median 1.1% in Pigeon Forge — top-decile yield for the area; either an underpriced asset or a hidden risk that comps aren't pricing in. Stress-test before assuming the spread holds.
Location & tenants
- Location reads 72/100 on livability (#36 in TN) — a middle-class / working-renter tenant base. Strengths: commute A+, cost of living A+, housing A+; Watch: employment C-, schools F, crime F.
- Sevier County (rural): math 31% / reading 28% proficiency, ranked #62 of 139 in TN (top 45%) — low school quality limits family demand, transient renter base, plan for 1-2y turnover.
- Market conditions: Rents soft (-2.6%/yr); 1127 active listings in the ZIP; 1,594 units permitted in Sevier County in 2024 (456 in 5+ unit buildings).
Forward outlook
- In year one you build about $37k of equity ($2k loan paydown + $35k appreciation (10.0% local appreciation)).
- Sevier County population projected at +22% by 2050 — long-run rental-demand tailwind backs the buy-and-hold thesis.
- By year 2, paydown + projected appreciation supports a ~$60k cash-out refi (75% LTV) — recoverable capital for the next deal without selling this one.
Negotiation context
- It's been on market 49 days — a 3% lower offer ($340k) is reasonable based on typical stale-listing flexibility.
- 15 sale attempts since 17y ago with the ask held roughly flat each time — persistent listings suggest the price (not the market) is what's stuck; bring a comps-based counter.
- Current owner paid $115k; list at $350k implies a 205% gain — meaningful room to come down on a strong offer.
Risks & watch-outs
- Climate carrying-cost: major wildfire risk; extreme-heat days projected 7→21/yr by 2055 (HVAC capex compounding) — expect insurance premiums to compound above CPI over the hold.
Questions for the listing agent
- What do current leases actually rent for vs. the listed asking? Can we see a recent rent roll and the last 12 months of T-12 income?
- It's been on market 49 days. Have you received any prior offers? Is the seller open to a 61% concession, seller financing, or rate buy-down credit?
- Is there a deadline driving the sale (1031 exchange, divorce, estate, relocation)? That informs how much negotiation room exists.
- Schools are F-rated, which usually means shorter tenancies and higher turnover. Who's the typical renter profile here, and what's been the actual vacancy rate?
- Crime grade is F in this area — have there been break-ins, vandalism, or insurance claims at this property in the last 3 years? What carrier currently insures it and at what premium?
- The area grade is low — what's the realistic commute time and amenity access for the typical tenant pool here? Any planned neighborhood developments (good or bad) we should know about?
- What's the average days-on-market for RENTAL listings here right now (not sales)? A rising rental-DOM trend means longer vacancies and softer asking-rent achievability than the comps imply.
- What's the recent tenant-quality profile in this submarket — average credit score on applications, eviction rate, late-payment / NSF rate, and stable-employment percentage? A property-management company in the area should have these aggregated.
- How much new for-sale + rental construction is in the pipeline within 1–3 miles? Heavy new supply typically softens prices + rents 12–24 months out; constrained supply supports both.
Investment metrics
- 1% rule
- 0.39% ✗
- Cap rate
- 2.86%
- Cash-on-cash
- -12.26%
- DSCR
- 0.45
- GRM
- 21.5
CMA / ARV
- ARV (median comp)
- $518,942
- List price
- $350,000
- Delta
- -32.56%
- Verdict
- UNDERPRICED
- Comps
- 20 within 1.0 mi
Show comp detail 1 sale within ~0.75 mi
| Address | Dist | Beds/Ba | Sqft | Sold | Price | $/sf | Match |
|---|---|---|---|---|---|---|---|
| 1840 Sandstone Way | 0.32mi | 1/1.0 | 880 (-2%) | 12mo | $535,000 | $608 | 67 |
Match score weights: distance 35% · size 25% · config 20% · recency 20%. Top-matched comps best support the ARV.
Projected returns pro-forma
10.0% appreciation · 0.0% rent growth · sell at horizon
- IRR
- 15.2%
- Equity multiple
- 2.25×
- Total profit
- $122,687
- Equity at exit
- $315,308
- IRR
- 14.6%
- Equity multiple
- 5.12×
- Total profit
- $403,930
- Equity at exit
- $679,973
Cash invested: $98,000 (down + closing). Projections, not guarantees.
Landlord ↔ Tenant lean methodology
- Overall (STATE)
- 87 Strongly Landlord-Friendly
- State Tennessee
- 87 Strongly Landlord-Friendly · R+13
- County
- — inherits STATE
- City
- — inherits STATE
ZIP-level market 37876
- Home prices YoY
- 2.4%
- Rents YoY
- -2.6%
- Active inventory
- 1127
- Price-to-rent
- 21.5×
Monthly cashflow live
- Estimated rent
- $1,358 medium interval (Pro) →
- Mortgage (P&I)
- −$1,835
- Tax from tax record
- −$92 /mo · $1,109/yr
- Insurance
- −$146
- HOA
- −$0
- Vacancy / Maint / Mgmt
- −$285
- Net cashflow
- $-1,001
Break-even live
UW: 25.0% down · 7.5% · 30yr · 1.5% tax · 5.0% vac · 8.0% maint · 8.0% mgmt
Financing live
Cash to close
- Down payment
- $87,500
- Closing costs
- $10,500
- Reserves months
- —
- Total cash needed
- —
Loan-product check · same deal, 3 products live
Conventional
25% down · 7.5% · 30yr
- Down + closing
- —
- Monthly P&I
- —
- Monthly cashflow
- —
- DSCR
- —
- Eligible?
- —
Personal DTI + credit; lowest rate.
DSCR
20% down · 8.5% · 30yr
- Down + closing
- —
- Monthly P&I
- —
- Monthly cashflow
- —
- DSCR
- —
- Eligible?
- —
No personal income docs; deal must DSCR.
Hard money
10% down · 12.0% · 12mo
- Down + closing
- —
- Monthly P&I
- —
- Monthly cashflow
- —
- DSCR
- —
- Eligible?
- —
Short-term bridge; refi at stabilization.
Listing history 50 events
-
2026-06-19days on market $350,000 Active 49 DOM
-
2026-06-18days on market $350,000 Active 48 DOM
-
2026-06-17days on market $350,000 Active 47 DOM
-
2026-06-16days on market $350,000 Active 46 DOM
-
2026-06-15days on market $350,000 Active 45 DOM
-
2026-06-14days on market $350,000 Active 43 DOM
-
2026-06-13days on market $350,000 Active 42 DOM
-
2026-06-10days on market $350,000 Active 40 DOM
-
2026-06-09days on market $350,000 Active 39 DOM
-
2026-06-08days on market $350,000 Active 38 DOM
-
2026-06-07days on market $350,000 Active 37 DOM
-
2026-06-02days on market $350,000 Active 32 DOM
-
2026-06-01days on market $350,000 Active 31 DOM
-
2026-05-31days on market $350,000 Active 30 DOM
-
2026-05-30days on market $350,000 Active 29 DOM
-
2026-05-01$350,000 Active 1375-char remark
-
2026-04-28historical $350,000 1375-char remark
-
2026-03-30price $375,000
-
2025-04-04status Active
-
2025-04-04status Active
-
2025-04-04status Active
-
2025-04-02status Pending
-
2025-04-02status Pending
-
2025-04-02historical Pending - Continue to Show - 1st Right of Refusal
-
2025-04-02historical
-
2025-03-31price $385,000
-
2025-03-31price $385,000
-
2025-03-31price $385,000
-
2025-03-10$405,000 Active
-
2025-03-04price $405,000
-
2025-03-04status Active
-
2025-02-28$405,000 Active
-
2025-02-28$405,000 Active
-
2025-02-28$405,000 Active
-
2025-02-27historical
-
2025-01-06price $429,000
-
2025-01-06price $429,000
-
2025-01-06price $429,000
-
2024-10-18price $449,000
-
2024-10-18price $449,000
-
2024-10-18price $449,000
-
2024-09-05status Active
-
2024-09-04historical
-
2024-07-03price $459,000
-
2024-07-03price $459,000
-
2024-07-03price $459,000
-
2024-04-08$475,000 Active
-
2024-04-08$475,000 Active
-
2024-04-08$475,000 Active
-
2015-12-29soldstatus $114,900
ⓘ Source: listings_history table (triggers on properties + properties_extension) + one-shot
backfill from property_details.listing_events for pre-trigger history.
Tax reassessment forecast TN · Resets to sale price
- Current annual tax
- $1,109 · $92/mo
- Projected year-2 tax
- $2,485 · $207/mo
- Expected delta
- +$1,376/yr (+$115/mo · 124.1%)
ⓘ Screening estimate from a state-policy table — verify with the county assessor before closing.
Climate risk First Street
- Flood 1/10 Low FEMA zone X (unshaded) · 0% chance over 30 yrs
- Wildfire 6/10 Major
- Heat 5/10 Major 7 d/yr ≥101°F today · 21 d/yr by 30 yrs out
- Wind 2/10 Low
- Air quality 2/10 Low 1 unhealthy d/yr today · 2 by 30 yrs out
Nearby sold comps map
Loading sold comps map…
Walkable amenities ~0.75 mi
Loading nearby amenities…
Taxation est. · year 1
- Rental income
- $16,292
- − Mortgage interest
- −$19,605
- − Property taxes
- −$1,109
- − Insurance
- −$1,750
- − Repairs & maintenance
- −$1,303
- − Management
- −$1,303
- − Depreciation
- −$10,182
- Taxable loss
- −$18,961
- Est. tax savings @ 24.0%
- +$4,551
- After-tax cash flow
- $-7,463/yr
For passive investors: Depreciation is non-cash, so a rental often shows a tax loss while cash-flowing — sheltering income. Rental losses are passive: they offset passive income freely, and up to $25,000/yr can offset ordinary (W-2) income if you actively participate and your MAGI is under $100k (phasing out to $0 by $150k); unused losses carry forward. On sale, claimed depreciation is recaptured at up to 25%, and gains may owe capital-gains tax (a 1031 exchange can defer both). Figures are a year-1 estimate at your 24.0% rate — not tax advice; consult a CPA.
Schools (NCES district)
- District
- Sevier County
- NCES district ID
- 4703780
- Math proficiency
- 31% ▼ -6.00%
- Reading proficiency
- 28% ▼ -4.00%
- Median HH income
- $42,730
- Composite
- 25.12/100
- National rank
- #7527
- State rank
- #62 of 139 in TN
Livability — Pigeon Forge
- Score
- 72/100
- State rank
- #36
- US rank
- #6327
Category grades
Schools grade is shown separately in the Schools card above.
Census & demographics
- County
- Sevier County · 80,402 people
- City population
- 21,767
- Metro
- Sevierville, TN
- Population (ZIP)
- 33,561
- Household income
- $58,277
- Rent vs Own
- Severe rent burden
- 611.0
Population outlook (Sevier County) Hauer SSP2
- Today (2025)
- 107,903 people
- By 2030
- 113,633 · +5.3%
- By 2040
- 123,969 · +14.9%
- By 2050
- 132,123 · +22.4%
- By 2075
- 148,524 · +37.6%
- By 2100
- 153,436 · +42.2%
Race, ethnicity, and origin ACS 2023
- Neighborhood character
- Predominantly White (89%)
- Race & ethnicity
- White 89% Hispanic / Latino 5% Two or more races 5% Black 1%
- Common ancestry
- Slovak 5% Serbian 4% Romanian 2%
- Foreign-born
- 3% · Canada
- Languages at home
- 95% English-only · Spanish 3% Russian/Polish/Slavic 1%
Political lean MEDSL · Sevier
- 2024 margin
- Solid R (+61.1) · D 18.9% · R 80.1% · Other 1.0%
- 2008→2024 swing
- -13.1pp toward R · 2008: -48.1pp · 2024: -61.1pp
- All cycles
- 2024: R+61.1 2020: R+57.6 2016: R+61.7 2012: R+54.8 2008: R+48.1
Not yet ingested
- Civics
- —
Market trends
- HPI YoY
- ▲ 11.06%
- Current HPI
- 477.19
- Rent YoY
- ▼ -2.57%
- Metro
- Sevierville, TN
- State GDP YoY
- ▲ 2.78%
- F500 in state
- 22
Industry mix (Fortune 500 HQ in TN)
| Industry | F500 HQs | Revenue |
|---|---|---|
| Healthcare | 3 | $91B |
|
||
| Retail | 3 | $72B |
|
||
| Transportation / Logistics | 1 | $88B |
|
||
| Paper / Packaging | 1 | $19B |
|
||
| Insurance | 1 | $13B |
|
||
| Energy | 1 | $12B |
|
||
Price history
+3400.0% since first listed39 events — show timeline
- 2026-05-09 Listed $350,000 GSMAR
- 2026-05-01 Listed $350,000 Knoxville MLS
- 2026-04-28 Coming Soon $350,000 Knoxville MLS
- 2026-03-30 Price Changed $375,000 GSMAR
- 2025-04-04 Relisted — LAAR
- 2025-04-04 Relisted — GSMAR
- 2025-04-04 Relisted — Knoxville MLS
- 2025-04-02 Pending — LAAR
- 2025-04-02 Pending — GSMAR
- 2025-04-02 Contingent — Knoxville MLS
- 2025-04-02 Listing Removed — Knoxville MLS
- 2025-03-31 Price Changed $385,000 LAAR
- 2025-03-31 Price Changed $385,000 GSMAR
- 2025-03-31 Price Changed $385,000 Knoxville MLS
- 2025-03-10 Listed $405,000 LAAR
- 2025-03-04 Price Changed $405,000 LAAR
- 2025-03-04 Relisted — LAAR
- 2025-02-28 Listed $405,000 LAAR
- 2025-02-28 Listed $405,000 Knoxville MLS
- 2025-02-28 Listed $405,000 GSMAR
- 2025-02-27 Listing Removed — Knoxville MLS
- 2025-01-06 Price Changed $429,000 LAAR
- 2025-01-06 Price Changed $429,000 GSMAR
- 2025-01-06 Price Changed $429,000 Knoxville MLS
- 2024-10-18 Price Changed $449,000 GSMAR
- 2024-10-18 Price Changed $449,000 LAAR
- 2024-10-18 Price Changed $449,000 Knoxville MLS
- 2024-09-05 Relisted — Knoxville MLS
- 2024-09-04 Listing Removed — Knoxville MLS
- 2024-07-03 Price Changed $459,000 LAAR
- 2024-07-03 Price Changed $459,000 GSMAR
- 2024-07-03 Price Changed $459,000 Knoxville MLS
- 2024-04-08 Listed $475,000 LAAR
- 2024-04-08 Listed $475,000 GSMAR
- 2024-04-08 Listed $475,000 Knoxville MLS
- 2015-12-29 Sold (Public Records) $114,900 Public Records
- 2009-09-29 Listed $179,900 GSMAR
- 2004-07-12 Sold (Public Records) $139,900 Public Records
- 1999-09-17 Sold (Public Records) $10,000 Public Records
Property tax history
+8.5%/yrLatest (2025): $1,109 · +0.0% YoY. Source: county tax records.
Cash-flow waterfall
monthlySold comps — $/sqft
last 12 mo · ≤1 miLoading sold comps…