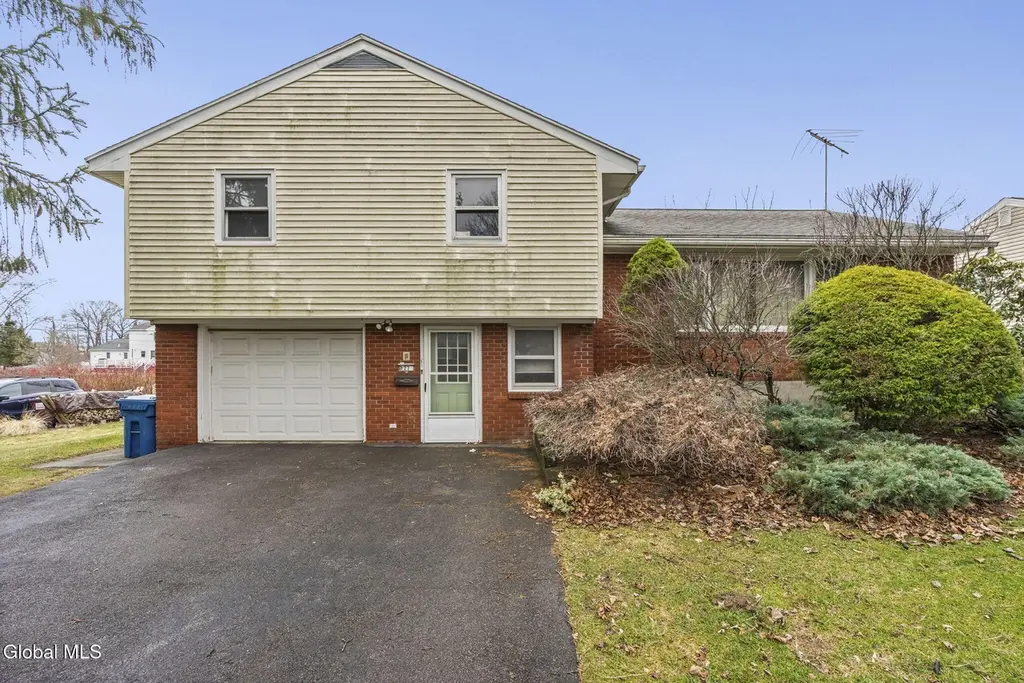
27 Eva St · Latham, NY
Flood risk 1/10 · Minimal
- FEMA flood zone
- X (unshaded)
- Chance of flooding over 30 yrs
- 0.0%
- Est. flood insurance / yr
- $473 – $860
Fire risk 1/10 · Minimal
- Est. fire insurance / yr
- $691 – $1,283
Heat risk 4/10 · Minor
- Hot days now (above 97°F)
- 7 days/yr
- Hot days in 30 yrs
- 16 days/yr
Wind risk 3/10 · Minor
- Chance of severe wind over 30 yrs
- 6.0%
Air-quality risk 1/10 · Minimal
- Unhealthy air days now
- 0 days/yr
- Unhealthy air days in 30 yrs
- 0 days/yr
Risk factors via First Street. Map © Google.
Why this score? — see what drove the C- grade
The composite is a weighted blend of 9 inputs, each scored 0–100. Each bar is that input's sub-score; the figure is the points it added to the 100-point composite (weight × sub-score).
- ARV discount +15.0/15.0
- Cash flow +13.4/30.0
- Schools +6.4/10.0
- DSCR +4.0/10.0
- 1% rule +3.8/10.0
- Rent growth +2.5/5.0
- Livability +2.5/5.0
- Condition / age +2.5/5.0
- Appreciation +0.0/10.0
$299,900
🖨 Deal sheet (PDF) 📄 Offer letter ✓ Due diligence
Listing remarks
Located in a highly desirable Latham neighborhood within the award-winning North Colonie School District, this 3-bedroom, 1.5-bath split-level home offers incredible potential for the right buyer. With a little updating and vision, this property can truly shine. Ideal layout with multiple living spaces and great bones to work with. Perfect opportunity to build equity in a prime location close to shopping, dining, and major highways. Location, location, location! 3D tour attached. Showings begin Friday 4/3.
Key facts
- Close to dining
- Prime location
- Close to shopping
Tags
Neighborhood map
What this means for you Summary
Snapshot
- This is a 3-bed/1.5-bath single-family listed at $300k.
Deal economics
- At list price, monthly cash flow is $4 ($51/yr) — positive.
- The deal already cash-flows at list — no discount required.
- To meet the 1% rule (rent ≥ 1% of price), the offer needs to be $264k (11.9% below list).
- Recommended offer: $264k (11.9% below list) — sets the bar for 1% rule.
- Cap rate 6.3% vs local median 2.4% in Latham — top-decile yield for the area; either an underpriced asset or a hidden risk that comps aren't pricing in. Stress-test before assuming the spread holds.
Location & tenants
- Location reads: area grade C — affects rentability + tenant quality, not the cash-flow math above.
- North Colonie CSD (suburban): math 70% / reading 76% proficiency, ranked #102 of 590 in NY (top 17%) — strong family-tenant draw, lease renewals of 3-5y typical; only 13% free/reduced lunch — higher-income household profile.
- Zoned schools: Shaker Middle School (math 54% / reading 72%, grade B+, #129 of 729 statewide, top 18%, 1,423 students, 26% FRL); Shaker High School (math 98% / reading 93%, grade A+, #76 of 1,100 statewide, top 7%, 2,018 students, 25% FRL).
- Market conditions: 103 active listings in the ZIP; 11 comparable units currently listed for rent nearby; rentals at typical pace (median 17d on market — plan ~3-4 weeks tenant-placement turnaround); solid renter incomes; 675 units permitted in Albany County in 2024 (451 in 5+ unit buildings).
- This rent runs 30% of the median local income ($105k/yr) — at the standard rent-burdened threshold; future hikes will face affordability resistance.
Forward outlook
- Local home prices are declining (-3.0%/yr); year-one equity from $2k of loan paydown is wiped out by about $9k of value loss. Plan a longer hold.
- Albany County population projected at +9% by 2050 — modest demand growth; plan on rents tracking national, not racing it.
Negotiation context
- Only 9 days on market — expect competitive offers; lowballing is unlikely to land.
Questions for the listing agent
- Built in 1960 — when were the roof, HVAC, electrical panel, plumbing, and water heater last replaced?
- Is there a deadline driving the sale (1031 exchange, divorce, estate, relocation)? That informs how much negotiation room exists.
- What's the average days-on-market for RENTAL listings here right now (not sales)? A rising rental-DOM trend means longer vacancies and softer asking-rent achievability than the comps imply.
- What's the recent tenant-quality profile in this submarket — average credit score on applications, eviction rate, late-payment / NSF rate, and stable-employment percentage? A property-management company in the area should have these aggregated.
- How much new for-sale + rental construction is in the pipeline within 1–3 miles? Heavy new supply typically softens prices + rents 12–24 months out; constrained supply supports both.
Investment metrics
- 1% rule
- 0.88% ✗
- Cap rate
- 6.31%
- Cash-on-cash
- 0.06%
- DSCR
- 1.00
- GRM
- 9.5
CMA / ARV
- ARV (on-the-fly)
- $371,952
- Comps found
- 12
Show comp detail 12 sales within ~0.75 mi
| Address | Dist | Beds/Ba | Sqft | Sold | Price | $/sf | Match |
|---|---|---|---|---|---|---|---|
| 549 Watervliet Shaker Rd | 0.30mi | 3/2.0 | 1,394 (-8%) | 7mo | $295,000 | $212 | 65 |
| 78 Old Loudon Rd | 0.25mi | 4/1.5 (+1) | 1,674 (+11%) | 7mo | $335,000 | $200 | 60 |
| 11 Gail Ln | 0.62mi | 3/2.0 | 1,460 (-3%) | 6mo | $380,000 | $260 | 58 |
| 34 Aspen Rd | 0.49mi | 3/2.0 | 1,592 (+5%) | 10mo | $505,000 | $317 | 58 |
| 14 Broadway | 0.67mi | 3/2.0 | 1,484 (-2%) | 8mo | $377,500 | $254 | 57 |
| 17 Schuyler Ave | 0.33mi | 2/1.0 (-1) | 1,326 (-12%) | 2mo | $315,000 | $238 | 56 |
| 216 Old Loudon Rd | 0.66mi | 4/2.0 (+1) | 1,560 (+3%) | 9mo | $315,000 | $202 | 49 |
| 521 Watervliet Shaker Rd | 0.30mi | 4/2.0 (+1) | 1,726 (+14%) | 7mo | $410,000 | $238 | 49 |
| 24 Purtell Ave | 0.56mi | 4/1.5 (+1) | 1,333 (-12%) | 7mo | $330,000 | $248 | 43 |
| 21 Vista Ave | 0.68mi | 3/2.0 | 1,300 (-14%) | 2mo | $335,000 | $258 | 41 |
| 52 Overlook Ave | 0.60mi | 4/1.0 (+1) | 1,320 (-13%) | 3mo | $315,000 | $239 | 41 |
| 47 Comely Ln | 0.66mi | 3/1.5 | 1,704 (+13%) | 10mo | $420,000 | $246 | 40 |
Match score weights: distance 35% · size 25% · config 20% · recency 20%. Top-matched comps best support the ARV.
Projected returns pro-forma
-3.0% appreciation · 3.0% rent growth · sell at horizon
- IRR
- -16.2%
- Equity multiple
- 0.43×
- Total profit
- $-48,279
- Equity at exit
- $44,716
- IRR
- -7.8%
- Equity multiple
- 0.51×
- Total profit
- $-41,503
- Equity at exit
- $25,930
Cash invested: $83,972 (down + closing). Projections, not guarantees.
Landlord ↔ Tenant lean methodology
- Overall (STATE)
- 15 Strongly Tenant-Friendly
- State New York
- 15 Strongly Tenant-Friendly · D+10
- County
- — inherits STATE
- City
- — inherits STATE
ZIP-level market 12110
- Home prices YoY
- -34.1%
- Active inventory
- 103
- Price-to-rent
- 9.5×
Monthly cashflow live
- Estimated rent
- $2,642 high interval (Pro) →
- Mortgage (P&I)
- −$1,573
- Tax from tax record
- −$385 /mo · $4,625/yr
- Insurance
- −$125
- HOA
- −$0
- Lot rent
- −$0
- Vacancy / Maint / Mgmt
- −$555
- Net cashflow
- $4
Break-even live
Sensitivity live
| Price | -10% $174 | -5% $89 | +0% $4 | +5% $-81 | +10% $-166 |
|---|---|---|---|---|---|
| Rent | -10% $-204 | -5% $-100 | +0% $4 | +5% $109 | +10% $213 |
| Rate | -1.0pp $155 | -0.5pp $81 | base $4 | +0.5pp $-73 | +1.0pp $-153 |
UW: 25.0% down · 7.5% · 30yr · 1.5% tax · 5.0% vac · 8.0% maint · 8.0% mgmt
Financing live
Cash to close
- Down payment
- $74,975
- Closing costs
- $8,997
- Reserves months
- —
- Total cash needed
- —
Loan-product check · same deal, 3 products live
Conventional
25% down · 7.5% · 30yr
- Down + closing
- —
- Monthly P&I
- —
- Monthly cashflow
- —
- DSCR
- —
- Eligible?
- —
Personal DTI + credit; lowest rate.
DSCR
20% down · 8.5% · 30yr
- Down + closing
- —
- Monthly P&I
- —
- Monthly cashflow
- —
- DSCR
- —
- Eligible?
- —
No personal income docs; deal must DSCR.
Hard money
10% down · 12.0% · 12mo
- Down + closing
- —
- Monthly P&I
- —
- Monthly cashflow
- —
- DSCR
- —
- Eligible?
- —
Short-term bridge; refi at stabilization.
Rent comps 11 comps
| Address | Beds | Baths | Sqft | Rent | $/sqft | DOM | Units | Dist |
|---|---|---|---|---|---|---|---|---|
| 5 Mockingbird Hl Latham, NY | 3.0 | 1.0 | 1152 | $2,300 | $2.00 | 16d | 1 | 0.59mi |
| 2 Dyer Dr Unit Na Latham, NY | 3.0 | 2.0 | 1708 | $3,000 | $1.76 | 26d | 1 | 0.70mi |
| 2 Dyer Dr Latham, NY | 3.0 | 2.0 | 1708 | $3,000 | $1.76 | 46d | 1 | 0.70mi |
| 4000 Florence Dr Newtonville, NY | 2.0 | 1.0–2.0 | 1010 | $2,576 | $2.55 | 16d | 8 | 0.72mi |
| 173 Doorstone Dr Latham, NY | 1.0–3.0 | 1.0–2.0 | 978 | $2,946 | $3.01 | 16d | 8 | 0.87mi |
| 276 Old Loudon Rd Latham, NY | 2.0 | 1.5 | 1150 | $2,100 | $1.83 | 16d | 1 | 0.89mi |
| 175 Troy-Schenectady Rd Apt 6 Watervliet, NY | 2.0 | 2.0 | 2040 | $2,250 | $1.10 | 21d | 1 | 1.33mi |
| 175 Troy-Schenectady Rd Watervliet, NY | 2.0 | 2.0 | 2040 | $2,250 | $1.10 | 16d | 1 | 1.33mi |
| 6-14 Cedarview Ln Watervliet, NY | 3.0 | 2.5 | 2000 | $3,300 | $1.65 | 16d | 1 | 1.34mi |
| 23 Lake Shore Dr Watervliet, NY | 1.0–3.0 | 1.0–2.0 | 911 | $2,280 | $2.50 | 16d | 17 | 1.37mi |
| 1 Derry Ln Colonie, NY | 2.0 | 1.5 | 1257 | $2,050 | $1.63 | 16d | 1 | 1.45mi |
Listing history 2 events
-
2026-04-10status Pending
-
2026-04-01$299,900 Active
ⓘ Source: listings_history table (triggers on properties + properties_extension) + one-shot
backfill from property_details.listing_events for pre-trigger history.
Tax reassessment forecast NY · Partial reset (capped growth)
- Current annual tax
- $4,625 · $385/mo
- Projected year-2 tax
- $4,847 · $404/mo
- Expected delta
- +$222/yr (+$18/mo · 4.8%)
ⓘ Screening estimate from a state-policy table — verify with the county assessor before closing.
Climate risk First Street
- Flood 1/10 Low FEMA zone X (unshaded) · 0% chance over 30 yrs
- Wildfire 1/10 Low
- Heat 4/10 Moderate 7 d/yr ≥97°F today · 16 d/yr by 30 yrs out
- Wind 3/10 Moderate 6% chance of damaging wind over 30 yrs
- Air quality 1/10 Low 0 unhealthy d/yr today · 0 by 30 yrs out
Nearby sold comps map
Loading sold comps map…
Walkable amenities ~0.75 mi
Loading nearby amenities…
Taxation est. · year 1
- Rental income
- $31,707
- − Mortgage interest
- −$16,799
- − Property taxes
- −$4,625
- − Insurance
- −$1,500
- − Repairs & maintenance
- −$2,537
- − Management
- −$2,537
- − Depreciation
- −$8,724
- Taxable loss
- −$5,015
- Est. tax savings @ 24.0%
- +$1,203
- After-tax cash flow
- $1,255/yr
For passive investors: Depreciation is non-cash, so a rental often shows a tax loss while cash-flowing — sheltering income. Rental losses are passive: they offset passive income freely, and up to $25,000/yr can offset ordinary (W-2) income if you actively participate and your MAGI is under $100k (phasing out to $0 by $150k); unused losses carry forward. On sale, claimed depreciation is recaptured at up to 25%, and gains may owe capital-gains tax (a 1031 exchange can defer both). Figures are a year-1 estimate at your 24.0% rate — not tax advice; consult a CPA.
Schools (NCES district)
- District
- North Colonie CSD
- NCES district ID
- 3621000
- Math proficiency
- 70% ▼ -5.00%
- Reading proficiency
- 76% ▲ 8.00%
- Median HH income
- $74,762
- Composite
- 64.2/100
- National rank
- #565
- State rank
- #102 of 590 in NY
Livability — Latham
No livability data for this city. (Only ~50 U.S. cities are tracked.)
Census & demographics
- Census place
- Latham, NY
- County
- Albany County · 196,626 people
- City population
- 20,081
- Metro
- Albany-Schenectady-Troy, NY
- Population (ZIP)
- 20,081
- Household income
- $105,024
- Rent vs Own
- Severe rent burden
- 517.0
Population outlook (Albany County) Hauer SSP2
- Today (2025)
- 320,794 people
- By 2030
- 327,401 · +2.1%
- By 2040
- 338,218 · +5.4%
- By 2050
- 348,467 · +8.6%
- By 2075
- 381,693 · +19.0%
- By 2100
- 393,809 · +22.8%
Race, ethnicity, and origin ACS 2023
- Neighborhood character
- Predominantly White (75%)
- Race & ethnicity
- White 75% Asian 11% Two or more races 6% Black 5% Hispanic / Latino 3%
- Common ancestry
- Romanian 5% Lithuanian 4% Iranian 2%
- Foreign-born
- 12% · Canada, China, Vietnam
- Languages at home
- 84% English-only · Other Indo-European 5% Chinese 2% Other Asian/Pacific 2%
Political lean MEDSL · Albany
- 2024 margin
- Strong D (+25.8) · D 62.9% · R 37.1%
- 2008→2024 swing
- -3.6pp toward R · 2008: 29.4pp · 2024: 25.8pp
- All cycles
- 2024: D+25.8 2020: D+31.4 2016: D+24.3 2012: D+31.0 2008: D+29.4
Not yet ingested
- Civics
- —
Market trends
- HPI YoY
- ▼ -160.69%
- Current HPI
- 310.884
- Rent YoY
- —
- Metro
- Albany-Schenectady-Troy, NY
- State GDP YoY
- ▲ 2.60%
- F500 in state
- 92
Industry mix (Fortune 500 HQ in NY)
| Industry | F500 HQs | Revenue |
|---|---|---|
| Financial Services | 10 | $950B |
|
||
| Consumer Goods | 9 | $162B |
|
||
| Insurance | 4 | $225B |
|
||
| Telecommunications | 2 | $144B |
|
||
| Pharmaceuticals | 2 | $112B |
|
||
| Media / Entertainment | 2 | $69B |
|
||
Price history
2 events — show timeline
- 2026-04-10 Pending — Global MLS
- 2026-04-01 Listed $299,900 Global MLS
Property tax history
+3.4%/yrLatest (2025): $4,625 · -2.8% YoY. Source: county tax records.
Cash-flow waterfall
monthlySold comps — $/sqft
last 12 mo · ≤1 miLoading sold comps…