 🏗️ New Construction
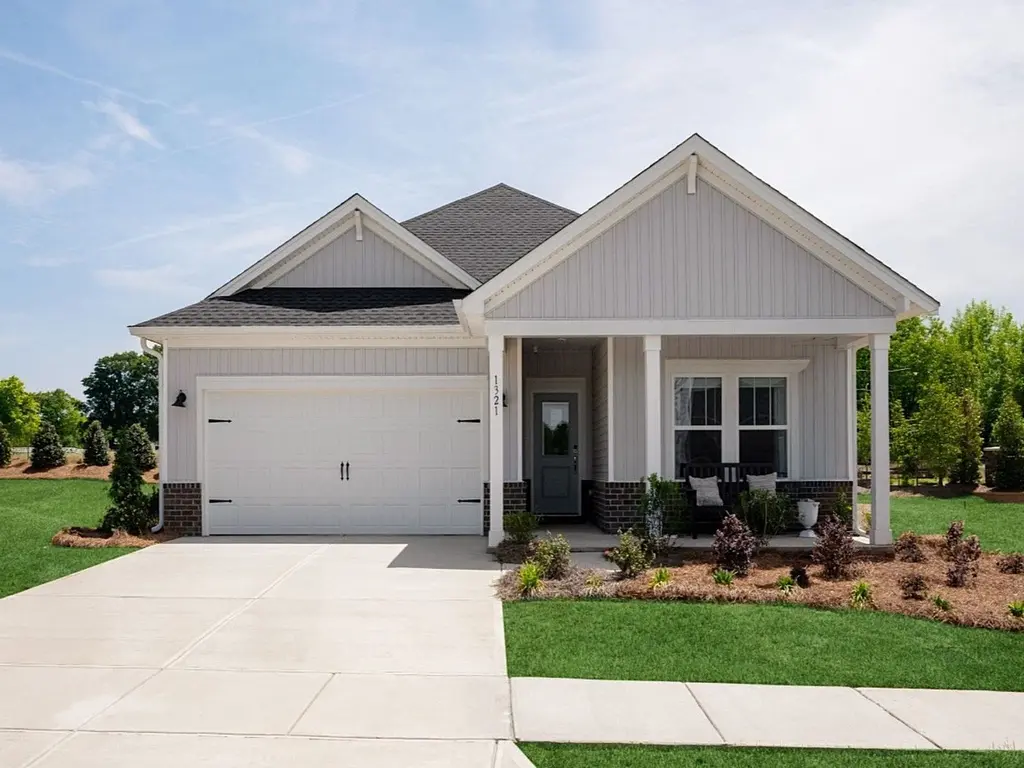
Chandler Plan · Summerdale, AL
Flood risk 1/10 · Minimal
- FEMA flood zone
- X (unshaded)
- Chance of flooding over 30 yrs
- 0.0%
- Est. flood insurance / yr
- $507 – $1,088
Fire risk 2/10 · Minimal
- Est. fire insurance / yr
- $916 – $1,700
Heat risk 10/10 · Severe
- Hot days now (above 105°F)
- 7 days/yr
- Hot days in 30 yrs
- 22 days/yr
Wind risk 9/10 · Severe
- Chance of severe wind over 30 yrs
- 99.0%
Air-quality risk 3/10 · Minor
- Unhealthy air days now
- 2 days/yr
- Unhealthy air days in 30 yrs
- 3 days/yr
Risk factors via First Street. Map © Google.
Why this score? — see what drove the D+ grade
The composite is a weighted blend of 9 inputs, each scored 0–100. Each bar is that input's sub-score; the figure is the points it added to the 100-point composite (weight × sub-score).
- Cash flow +13.6/30.0
- Appreciation +9.0/10.0
- ARV discount +7.5/15.0
- DSCR +4.1/10.0
- Schools +3.9/10.0
- 1% rule +3.8/10.0
- Livability +2.9/5.0
- Rent growth +2.5/5.0
- Condition / age +2.5/5.0
$299,990
🖨 Deal sheet (PDF) 📄 Offer letter ✓ Due diligence
Listing remarks
Enjoy happy hour on the Chandler's covered back patio. Inside, the sprawling kitchen island overlooks the great room. In the primary suite, dual sinks and a walk-in closet simplify busy mornings.
Key facts
- Walk-in closet
- Covered back patio
- 2 garage spots
Tags
Property features AI
Finance
- Other: Address: 19968 Jambalaya Dr, Summerdale AL 36580; Status: Active; New construction inventory type: Plan; Plan name: Chandler; Last modified: 2026-06-07
- Financial info: List price $309,990
Exterior
- Parking: 2 total parking spaces; 2-car garage
- Home design: Single-family plan home
- Exterior features: Living area approximately 1648
Interior
- Bedrooms: 3 bedrooms
- Bathrooms: 2 full bathrooms
- Interior features: Plan home (Chandler)
Neighborhood map
What this means for you Summary
Snapshot
- This is a 3-bed/2.0-bath single-family listed at $300k.
Deal economics
- At list price, monthly cash flow is $13 ($160/yr) — positive.
- To cash-flow at today's rent, offer at most $271k (9.8% below list).
- To meet the 1% rule (rent ≥ 1% of price), the offer needs to be $237k (21.1% below list).
- Recommended offer: $237k (21.1% below list) — sets the bar for 1% rule.
- Cap rate 6.4% vs local median 4.7% in Summerdale — top-decile yield for the area; either an underpriced asset or a hidden risk that comps aren't pricing in. Stress-test before assuming the spread holds.
Location & tenants
- Location reads 57/100 on livability (#384 in AL) — a working-class tenant base; expect higher turnover. Strengths: cost of living A+, housing A+; Watch: crime F, amenities F, commute F.
- Baldwin County (rural): math 33% / reading 57% proficiency, ranked #18 of 129 in AL (top 14%) — families likely to look elsewhere, expect single-tenant / working-renter base with shorter leases.
- Zoned schools: Foley Elementary School (math 22% / reading 44%, grade F, #323 of 627 statewide, top 52%, 992 students, 76% FRL); Foley Middle School (math 11% / reading 36%, grade F, #172 of 257 statewide, top 68%, 783 students, 82% FRL); Foley High School (math 24% / reading 25%, grade F, #118 of 305 statewide, top 45%, 1,578 students, 75% FRL) — zoned schools average 78% FRL vs 38% district-wide (40 pts higher); higher-poverty schools than district average — tighter screening recommended.
- Zoned-school proficiency averages 27% at this address vs 45% district-wide (-18 pts) — the specific schools serving this property underperform the Baldwin County average; the district grade overstates school quality for this exact location.
- Market conditions: 144 active listings in the ZIP; 3 comparable units currently listed for rent nearby; rentals at typical pace (median 23d on market — plan ~3-4 weeks tenant-placement turnaround); 3,883 units permitted in Baldwin County in 2024 (481 in 5+ unit buildings).
Forward outlook
- In year one you build about $23k of equity ($2k loan paydown + $21k appreciation (8.0% local appreciation)).
- Baldwin County population projected at +42% by 2050 — long-run rental-demand tailwind backs the buy-and-hold thesis.
- At projected returns (8.0% appreciation + 3.0% rent growth), your $75k cash investment doubles in ~3 years — after that, you're playing with house money.
- By year 2, paydown + projected appreciation supports a ~$37k cash-out refi (75% LTV) — recoverable capital for the next deal without selling this one.
Negotiation context
- Only 14 days on market — expect competitive offers; lowballing is unlikely to land.
Risks & watch-outs
- Climate carrying-cost: severe wind risk, 99% chance of damaging wind over 30y; extreme-heat days projected 7→22/yr by 2055 (HVAC capex compounding) — expect insurance premiums to compound above CPI over the hold.
Questions for the listing agent
- Is there a deadline driving the sale (1031 exchange, divorce, estate, relocation)? That informs how much negotiation room exists.
- Schools are D-rated, which usually means shorter tenancies and higher turnover. Who's the typical renter profile here, and what's been the actual vacancy rate?
- Crime grade is F in this area — have there been break-ins, vandalism, or insurance claims at this property in the last 3 years? What carrier currently insures it and at what premium?
- The area grade is low — what's the realistic commute time and amenity access for the typical tenant pool here? Any planned neighborhood developments (good or bad) we should know about?
- What's the average days-on-market for RENTAL listings here right now (not sales)? A rising rental-DOM trend means longer vacancies and softer asking-rent achievability than the comps imply.
- What's the recent tenant-quality profile in this submarket — average credit score on applications, eviction rate, late-payment / NSF rate, and stable-employment percentage? A property-management company in the area should have these aggregated.
- How much new for-sale + rental construction is in the pipeline within 1–3 miles? Heavy new supply typically softens prices + rents 12–24 months out; constrained supply supports both.
Investment metrics
- 1% rule
- 0.88% ✗
- Cap rate
- 6.35%
- Cash-on-cash
- 0.21%
- DSCR
- 1.01
- GRM
- 9.5
CMA / ARV
- ARV (on-the-fly)
- $268,624
- Comps found
- 12
Show comp detail 12 sales within ~0.75 mi
| Address | Dist | Beds/Ba | Sqft | Sold | Price | $/sf | Match |
|---|---|---|---|---|---|---|---|
| 16212 Eden St | 0.09mi | 3/2.0 | 1,569 (-5%) | 1mo | $263,490 | $168 | 87 |
| 20045 Eden St | 0.06mi | 3/2.0 | 1,569 (-5%) | 3mo | $257,189 | $164 | 87 |
| 16194 Eden St | 0.11mi | 3/2.0 | 1,569 (-5%) | 2mo | $259,490 | $165 | 86 |
| 20113 Clover Field Ln | 0.16mi | 3/2.0 | 1,569 (-5%) | 1mo | $259,490 | $165 | 84 |
| 16132 Eden St | 0.16mi | 3/2.0 | 1,569 (-5%) | 4mo | $254,273 | $162 | 81 |
| 16068 Clover Field Ln | 0.18mi | 3/2.0 | 1,569 (-5%) | 4mo | $255,990 | $163 | 80 |
| 16162 Eden St | 0.14mi | 4/2.0 (+1) | 1,732 (+5%) | 2mo | $265,990 | $154 | 78 |
| 20079 Clover Field Ln | 0.18mi | 4/2.0 (+1) | 1,732 (+5%) | 1mo | $266,490 | $154 | 77 |
| 20003 Clover Field Ln | 0.15mi | 4/2.0 (+1) | 1,732 (+5%) | 4mo | $252,285 | $146 | 76 |
| 16100 Eden St | 0.19mi | 4/2.0 (+1) | 1,732 (+5%) | 4mo | $245,990 | $142 | 74 |
| 16180 Eden St | 0.12mi | 3/2.0 | 1,413 (-14%) | 1mo | $250,990 | $178 | 70 |
| 16118 Eden St | 0.18mi | 4/2.0 (+1) | 1,413 (-14%) | 4mo | $230,990 | $163 | 60 |
Match score weights: distance 35% · size 25% · config 20% · recency 20%. Top-matched comps best support the ARV.
Projected returns pro-forma
7.97% appreciation · 3.0% rent growth · sell at horizon
- IRR
- 20.1%
- Equity multiple
- 2.48×
- Total profit
- $111,086
- Equity at exit
- $203,593
- IRR
- 18.7%
- Equity multiple
- 5.28×
- Total profit
- $321,722
- Equity at exit
- $403,664
Cash invested: $75,215 (down + closing). Projections, not guarantees.
Landlord ↔ Tenant lean methodology
- Overall (STATE)
- 90 Strongly Landlord-Friendly
- State Alabama
- 90 Strongly Landlord-Friendly · R+15
- County
- — inherits STATE
- City
- — inherits STATE
ZIP-level market 36580
- Home prices YoY
- 2.8%
- Active inventory
- 144
- Price-to-rent
- 10.6×
Monthly cashflow live
- Estimated rent
- $2,367 medium interval (Pro) →
- Mortgage (P&I)
- −$1,409
- Tax est. 1.5%
- −$336 /mo · $4,029/yr
- Insurance
- −$112
- HOA
- −$0
- Vacancy / Maint / Mgmt
- −$497
- Net cashflow
- $13
Break-even live
Sensitivity live
| Price | -10% $199 | -5% $106 | +0% $13 | +5% $-79 | +10% $-172 |
|---|---|---|---|---|---|
| Rent | -10% $-174 | -5% $-80 | +0% $13 | +5% $107 | +10% $200 |
| Rate | -1.0pp $149 | -0.5pp $82 | base $13 | +0.5pp $-56 | +1.0pp $-127 |
UW: 25.0% down · 7.5% · 30yr · 1.5% tax · 5.0% vac · 8.0% maint · 8.0% mgmt
Financing live
Cash to close
- Down payment
- $67,156
- Closing costs
- $8,059
- Reserves months
- —
- Total cash needed
- —
Loan-product check · same deal, 3 products live
Conventional
25% down · 7.5% · 30yr
- Down + closing
- —
- Monthly P&I
- —
- Monthly cashflow
- —
- DSCR
- —
- Eligible?
- —
Personal DTI + credit; lowest rate.
DSCR
20% down · 8.5% · 30yr
- Down + closing
- —
- Monthly P&I
- —
- Monthly cashflow
- —
- DSCR
- —
- Eligible?
- —
No personal income docs; deal must DSCR.
Hard money
10% down · 12.0% · 12mo
- Down + closing
- —
- Monthly P&I
- —
- Monthly cashflow
- —
- DSCR
- —
- Eligible?
- —
Short-term bridge; refi at stabilization.
Rent comps 3 comps
| Address | Beds | Baths | Sqft | Rent | $/sqft | DOM | Units | Dist |
|---|---|---|---|---|---|---|---|---|
| 14843 Dayton Cir Foley, AL | 4.0 | 2.0 | 1791 | $2,400 | $1.34 | 15d | 1 | 1.45mi |
| 14836 Dayton Cir Foley, AL | 4.0 | 2.0 | 1791 | $2,400 | $1.34 | 23d | 1 | 1.46mi |
| 14654 Dayton Cir Foley, AL | 4.0 | 2.0 | 1791 | $2,300 | $1.28 | 23d | 1 | 1.47mi |
Listing history 12 events
-
2026-06-21days on market $299,990 Active 14 DOM
-
2026-06-19days on market $299,990 Active 12 DOM
-
2026-06-18pricedays on market $299,990 Active 11 DOM
-
2026-06-17days on market $309,990 Active 10 DOM
-
2026-06-16days on market $309,990 Active 9 DOM
-
2026-06-15days on market $309,990 Active 8 DOM
-
2026-06-14days on market $309,990 Active 6 DOM
-
2026-06-13days on market $309,990 Active 5 DOM
-
2026-06-10days on market $309,990 Active 3 DOM
-
2026-06-09days on market $309,990 Active 2 DOM
-
2026-06-07remarks 195-char remark
-
2026-06-07$309,990 Active 1 DOM
ⓘ Source: listings_history table (triggers on properties + properties_extension) + one-shot
backfill from property_details.listing_events for pre-trigger history.
Climate risk First Street
- Flood 1/10 Low FEMA zone X (unshaded) · 0% chance over 30 yrs
- Wildfire 2/10 Low
- Heat 10/10 Extreme 7 d/yr ≥105°F today · 22 d/yr by 30 yrs out
- Wind 9/10 Extreme 99% chance of damaging wind over 30 yrs
- Air quality 3/10 Moderate 2 unhealthy d/yr today · 3 by 30 yrs out
Nearby sold comps map
Loading sold comps map…
Walkable amenities ~0.75 mi
Loading nearby amenities…
Taxation est. · year 1
- Rental income
- $28,401
- − Mortgage interest
- −$15,047
- − Property taxes
- −$4,029
- − Insurance
- −$1,343
- − Repairs & maintenance
- −$2,272
- − Management
- −$2,272
- − Depreciation
- −$7,815
- Taxable loss
- −$4,377
- Est. tax savings @ 24.0%
- +$1,050
- After-tax cash flow
- $1,211/yr
For passive investors: Depreciation is non-cash, so a rental often shows a tax loss while cash-flowing — sheltering income. Rental losses are passive: they offset passive income freely, and up to $25,000/yr can offset ordinary (W-2) income if you actively participate and your MAGI is under $100k (phasing out to $0 by $150k); unused losses carry forward. On sale, claimed depreciation is recaptured at up to 25%, and gains may owe capital-gains tax (a 1031 exchange can defer both). Figures are a year-1 estimate at your 24.0% rate — not tax advice; consult a CPA.
Schools (NCES district)
- District
- Baldwin County
- NCES district ID
- 0100270
- Math proficiency
- 33% ▼ -26.00%
- Reading proficiency
- 57% ▲ 1.00%
- Median HH income
- $50,677
- Composite
- 38.61/100
- National rank
- #4157
- State rank
- #18 of 129 in AL
Livability — Summerdale
- Score
- 57/100
- State rank
- #384
- US rank
- #21872
Category grades
Schools grade is shown separately in the Schools card above.
Census & demographics
- Census place
- Summerdale, AL
- City population
- 7,025
- Population (ZIP)
- 7,025
Population outlook (Baldwin County) Hauer SSP2
- Today (2025)
- 248,264 people
- By 2030
- 270,315 · +8.9%
- By 2040
- 312,967 · +26.1%
- By 2050
- 352,262 · +41.9%
- By 2075
- 438,841 · +76.8%
- By 2100
- 487,736 · +96.5%
Race, ethnicity, and origin ACS 2023
- Neighborhood character
- Predominantly White (71%)
- Race & ethnicity
- White 71% Two or more races 17% Hispanic / Latino 17% Black 5%
- Hispanic origin (detail)
- Mexican 16%
- Common ancestry
- Serbian 2% Lithuanian 2% Italian 2%
- Foreign-born
- 6% · Canada
- Languages at home
- 91% English-only · Spanish 9%
Political lean MEDSL · Baldwin
- 2024 margin
- Solid R (+58.2) · D 20.5% · R 78.7%
- 2008→2024 swing
- -6.7pp toward R · 2008: -51.5pp · 2024: -58.2pp
- All cycles
- 2024: R+58.2 2020: R+53.8 2016: R+57.8 2012: R+55.8 2008: R+51.5
Not yet ingested
- Civics
- —
Market trends
- HPI YoY
- ▲ 7.97%
- Current HPI
- 288.8697
- Rent YoY
- —
- Metro
- —
- State GDP YoY
- ▲ 2.94%
- F500 in state
- 4
Industry mix (Fortune 500 HQ in AL)
| Industry | F500 HQs | Revenue |
|---|---|---|
| Financial Services | 1 | $8B |
|
||
| Healthcare | 1 | $5B |
|
||
Cash-flow waterfall
monthlySold comps — $/sqft
last 12 mo · ≤1 miLoading sold comps…