 Duplex
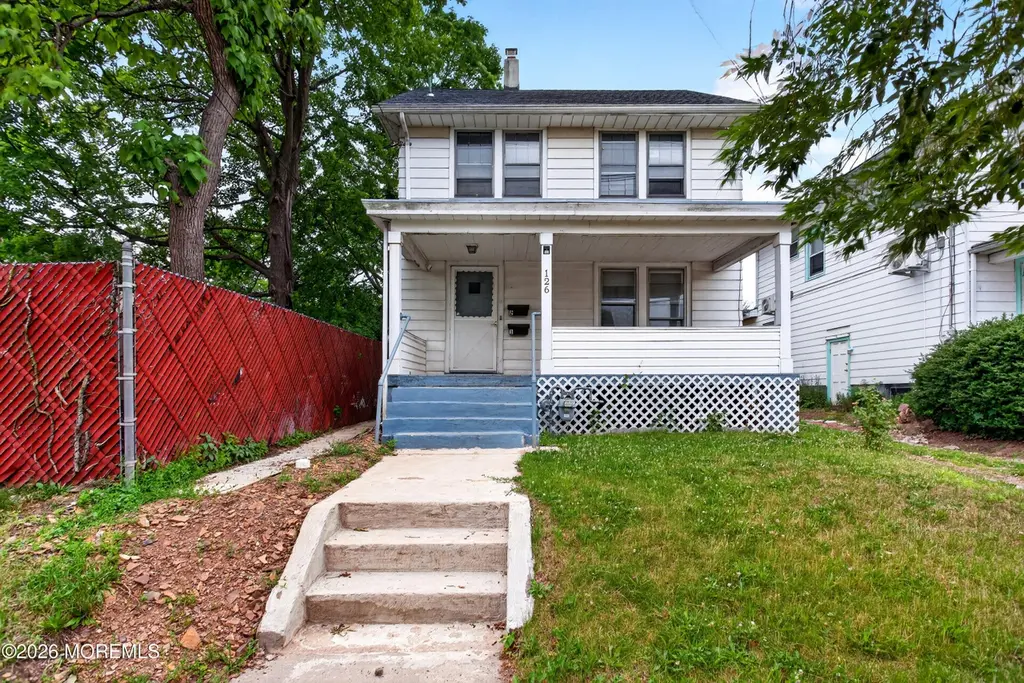
126 Jones Ave · New Brunswick, NJ
Flood risk 1/10 · Minimal
- FEMA flood zone
- X (unshaded)
- Chance of flooding over 30 yrs
- 0.0%
- Est. flood insurance / yr
- $507 – $1,088
Fire risk 1/10 · Minimal
- Est. fire insurance / yr
- $526 – $976
Heat risk 7/10 · Major
- Hot days now (above 101°F)
- 7 days/yr
- Hot days in 30 yrs
- 15 days/yr
Wind risk 6/10 · Moderate
- Chance of severe wind over 30 yrs
- 27.0%
Air-quality risk 3/10 · Minor
- Unhealthy air days now
- 3 days/yr
- Unhealthy air days in 30 yrs
- 5 days/yr
Risk factors via First Street. Map © Google.
Why this score? — see what drove the C grade
The composite is a weighted blend of 9 inputs, each scored 0–100. Each bar is that input's sub-score; the figure is the points it added to the 100-point composite (weight × sub-score).
- Cash flow +26.9/30.0
- DSCR +9.3/10.0
- 1% rule +7.2/10.0
- ARV discount +4.5/15.0
- Livability +3.8/5.0
- Rent growth +2.5/5.0
- Condition / age +2.5/5.0
- Schools +1.2/10.0
- Appreciation +0.0/10.0
$535,000
🖨 Deal sheet (PDF) 📄 Offer letter ✓ Due diligence
Multi-family units
County records classify this as Multi-Family (2-4 Unit). Listing-text estimate: 2 units. confirmed
Listing remarks
Excellent opportunity to own a 2 family in home at a convenient New Brunswick location. First floor unit has been completely renovated and is tenant occupied. Renovations include a new kitchen, flooring, new bathroom, and new windows. The 2nd floor unit is vacant and ready for owner occupancy, a new tenant, or add your personal updates and finishing touches. Additional recent improvements include a new sewer system and new basement windows. The property features a detached garage, oversized driveway, and inviting front porch perfect for relaxing outdoors. Basement offers additional flexibility Whether you're looking to occupy on unit while generating rental income from the other or add a
Key facts
- New kitchen
- New bathroom
- New basement windows
Tags
Property features AI
Exterior
- Parking: 1-car garage
- Utilities: Public sewer
- Exterior features: Property owned by individual(s)
Interior
- Heating & cooling: Radiant heating; Baseboard heating; Other cooling
- Interior features: Partially finished basement
Neighborhood map
What this means for you Summary
Snapshot
- This is a 2 × 3-bed/1.5-bath units multifamily listed at $535k. Condition is rated fair.
Deal economics
- At list price, monthly cash flow is $1k ($18k/yr) — positive. Per door: $738/mo.
- The deal already cash-flows at list — no discount required.
- Meets the 1% rule at list price ($7k rent vs $535k).
- Cap rate 9.6% vs local median 3.8% in New Brunswick — top-decile yield for the area; either an underpriced asset or a hidden risk that comps aren't pricing in. Stress-test before assuming the spread holds.
Location & tenants
- Location reads 75/100 on livability (#154 in NJ, #3,986 nationally) — a middle-class / working-renter tenant base. Strengths: amenities A+, commute A+, health & safety A+; Watch: employment C-, schools F, crime F.
- New Brunswick School District (urban): math 4% / reading 23% proficiency, ranked #463 of 472 in NJ (top 98%) — low school quality limits family demand, transient renter base, plan for 1-2y turnover; 78% free/reduced lunch — lower-income household profile, screen leases tightly.
- Market conditions: 17 active listings in the ZIP; 27 comparable units currently listed for rent nearby; rentals leasing fast (median 2d on market — plan ~1-2 weeks tenant-placement turnaround); 1,971 units permitted in Middlesex County in 2024 (1,193 in 5+ unit buildings).
Forward outlook
- Local home prices are declining (-3.0%/yr); year-one equity from $4k of loan paydown is wiped out by about $16k of value loss. Plan a longer hold.
- Middlesex County population projected at +15% by 2050 — long-run rental-demand tailwind backs the buy-and-hold thesis.
- At projected returns (-3.0% appreciation + 3.0% rent growth), your $150k cash investment doubles in ~10 years — after that, you're playing with house money.
Negotiation context
- Only 6 days on market — expect competitive offers; lowballing is unlikely to land.
Risks & watch-outs
- Watch-outs: built in 1920 — expect roof / HVAC / electrical / plumbing capex.
- Climate carrying-cost: major wind risk, 27% chance of damaging wind over 30y; extreme-heat days projected 7→15/yr by 2055 (HVAC capex compounding) — expect insurance premiums to compound above CPI over the hold.
Questions for the listing agent
- Can we see the unit-by-unit rent roll, current vacancy, and any below-market leases? What's the average tenancy length?
- What capital expenditures (roof, boiler, parking lot, exteriors) have been made in the last 5 years, and what's planned in the next 2?
- Have any recent inspections been done? Can we get a copy of the seller's disclosures and any deferred-maintenance estimates?
- Built in 1920 — when were the roof, HVAC, electrical panel, plumbing, and water heater last replaced?
- Is there a deadline driving the sale (1031 exchange, divorce, estate, relocation)? That informs how much negotiation room exists.
- Schools are F-rated, which usually means shorter tenancies and higher turnover. Who's the typical renter profile here, and what's been the actual vacancy rate?
- Crime grade is F in this area — have there been break-ins, vandalism, or insurance claims at this property in the last 3 years? What carrier currently insures it and at what premium?
- What's the average days-on-market for RENTAL listings here right now (not sales)? A rising rental-DOM trend means longer vacancies and softer asking-rent achievability than the comps imply.
- What's the recent tenant-quality profile in this submarket — average credit score on applications, eviction rate, late-payment / NSF rate, and stable-employment percentage? A property-management company in the area should have these aggregated.
- How much new apartment / multifamily construction is in the pipeline within 1–3 miles? Heavy new supply (>2% of stock underway) typically softens rents 12–24 months out; light construction supports rent growth.
Investment metrics
- 1% rule
- 1.22% ✓
- Cap rate
- 9.60%
- Cash-on-cash
- 11.82%
- DSCR
- 1.53
- GRM
- 6.8
CMA / ARV
- ARV (on-the-fly)
- $501,930
- Comps found
- 12
Show comp detail 12 sales within ~0.75 mi
| Address | Dist | Beds/Ba | Sqft | Sold | Price | $/sf | Match |
|---|---|---|---|---|---|---|---|
| 55 Suydam St | 0.20mi | 3/2.0 | 1,540 (+4%) | 7mo | $593,000 | $385 | 79 |
| 15 N Talmadge St N | 0.31mi | 4/2.0 | 1,452 (-2%) | 4mo | $495,000 | $341 | 79 |
| 154 Comstock St | 0.31mi | 4/2.0 | 1,548 (+4%) | 9mo | $490,000 | $317 | 71 |
| 111 Delavan St | 0.22mi | 5/3.0 | 1,632 (+10%) | 2mo | $635,000 | $389 | 71 |
| 146 Seaman St | 0.31mi | 4/2.0 | 1,384 (-7%) | 7mo | $525,000 | $379 | 68 |
| 193 Delavan St | 0.43mi | 4/2.0 | 1,444 (-3%) | 11mo | $460,000 | $319 | 66 |
| 186 Townsend St | 0.45mi | 4/2.0 | 1,620 (+9%) | 3mo | $486,000 | $300 | 61 |
| 188 Seaman St | 0.42mi | —/— | 1,627 (+10%) | 10mo | $550,000 | $338 | 56 |
| 78 Throop Ave | 0.25mi | —/— | 1,662 (+12%) | 17mo | $437,000 | $263 | 54 |
| 168 Redmond St | 0.45mi | 6/2.0 | 1,680 (+13%) | 6mo | $450,000 | $268 | 52 |
| 158 Lee Ave | 0.47mi | 4/3.0 | 1,300 (-12%) | 8mo | $495,000 | $381 | 51 |
| 208 Suydam St | 0.49mi | —/— | 1,320 (-11%) | 14mo | $385,000 | $292 | 47 |
Match score weights: distance 35% · size 25% · config 20% · recency 20%. Top-matched comps best support the ARV.
Projected returns pro-forma
-3.0% appreciation · 3.0% rent growth · sell at horizon
- IRR
- 1.3%
- Equity multiple
- 1.05×
- Total profit
- $7,391
- Equity at exit
- $79,770
- IRR
- 10.9%
- Equity multiple
- 1.85×
- Total profit
- $127,859
- Equity at exit
- $46,257
Cash invested: $149,800 (down + closing). Projections, not guarantees.
Landlord ↔ Tenant lean methodology
- Overall (STATE)
- 21 Tenant-Leaning
- State New Jersey
- 21 Tenant-Leaning · D+6
- County
- — inherits STATE
- City
- — inherits STATE
ZIP-level market 08846
- Active inventory
- 17
- Price-to-rent
- 13.6×
Monthly cashflow live
- Estimated rent
- $6,548 high interval (Pro) →
- Mortgage (P&I)
- −$2,806
- Tax est. 1.5%
- −$669 /mo · $8,025/yr
- Insurance
- −$223
- HOA
- −$0
- Vacancy / Maint / Mgmt
- −$1,375
- Net cashflow
- $1,476
Break-even live
Sensitivity live
| Price | -10% $1,845 | -5% $1,661 | +0% $1,476 | +5% $1,291 | +10% $1,106 |
|---|---|---|---|---|---|
| Rent | -10% $958 | -5% $1,217 | +0% $1,476 | +5% $1,734 | +10% $1,993 |
| Rate | -1.0pp $1,745 | -0.5pp $1,612 | base $1,476 | +0.5pp $1,337 | +1.0pp $1,196 |
2-unit breakdown (identical units grouped — click to expand)
| Units | Beds | Baths | Est. rent |
|---|---|---|---|
| 2× units | 3 | 1.5 | $6,548 |
| #1 | 3 | 1.5 | $3,274 |
| #2 | 3 | 1.5 | $3,274 |
| Total (2 units) | $6,548 | ||
UW: 25.0% down · 7.5% · 30yr · 1.5% tax · 5.0% vac · 8.0% maint · 8.0% mgmt
Financing live
Cash to close
- Down payment
- $133,750
- Closing costs
- $16,050
- Reserves months
- —
- Total cash needed
- —
Loan-product check · same deal, 3 products live
Conventional
25% down · 7.5% · 30yr
- Down + closing
- —
- Monthly P&I
- —
- Monthly cashflow
- —
- DSCR
- —
- Eligible?
- —
Personal DTI + credit; lowest rate.
DSCR
20% down · 8.5% · 30yr
- Down + closing
- —
- Monthly P&I
- —
- Monthly cashflow
- —
- DSCR
- —
- Eligible?
- —
No personal income docs; deal must DSCR.
Hard money
10% down · 12.0% · 12mo
- Down + closing
- —
- Monthly P&I
- —
- Monthly cashflow
- —
- DSCR
- —
- Eligible?
- —
Short-term bridge; refi at stabilization.
Rent comps 27 comps
| Address | Beds | Baths | Sqft | Rent | $/sqft | DOM | Units | Dist |
|---|---|---|---|---|---|---|---|---|
| 95 Paul Robeson Blvd Unit 3 New Brunswick, NJ | 3.0 | 1.0 | 1200 | $2,900 | $2.42 | 25d | 1 | 0.32mi |
| 28 Renaissance Ln New Brunswick, NJ | 2.0 | 1.5 | 1087 | $2,500 | $2.30 | 17d | 1 | 0.36mi |
| 39 Throop Ave Unit 3 New Brunswick, NJ | 2.0 | 1.0 | 1000 | $2,400 | $2.40 | 25d | 1 | 0.38mi |
| 186 Comstock St New Brunswick, NJ | 2.0 | 1.0 | 1000 | $2,200 | $2.20 | 25d | 1 | 0.42mi |
| 79 Renaissance Ln New Brunswick, NJ | 2.0 | 1.5 | 1067 | $2,800 | $2.62 | 17d | 1 | 0.48mi |
| 10 Paul Robeson Blvd New Brunswick, NJ | 1.0–3.0 | 1.0–1.5 | 883 | $2,578 | $2.92 | 2d | 8 | 0.48mi |
| 1315 Fernwood Ct New Brunswick, NJ | 2.0 | 2.0 | 1195 | $2,500 | $2.09 | 4d | 1 | 0.50mi |
| 33 Paul Robeson Blvd New Brunswick, NJ | 1.0–2.0 | 1.0 | 833 | $2,061 | $2.47 | 4d | 5 | 0.56mi |
| 285 George St New Brunswick, NJ | 1.0–2.0 | 1.0–2.0 | 842 | $3,174 | $3.77 | 2d | 7 | 0.70mi |
| 120 Neilson St New Brunswick, NJ | 2.0 | 1.0–2.0 | 759 | $3,390 | $4.47 | 2d | 25 | 0.78mi |
| 1 Richmond St New Brunswick, NJ | 1.0–2.0 | 1.0–2.0 | 982 | $4,037 | $4.11 | 2d | 23 | 0.81mi |
| 7 Livingston Ave New Brunswick, NJ | 2.0 | 1.0–2.0 | 664 | $3,830 | $5.77 | 2d | 18 | 0.82mi |
| 145 Neilson St New Brunswick, NJ | 2.0 | 2.0 | 1010 | $3,235 | $3.20 | 2d | 2 | 0.85mi |
| 100 Hiram Sq New Brunswick, NJ | 1.0–2.0 | 1.0–2.0 | 769 | $3,224 | $4.19 | 2d | 10 | 0.89mi |
| 60 Paterson St New Brunswick, NJ | 1.0–2.0 | 1.0–1.5 | 974 | $2,985 | $3.06 | 2d | 1 | 0.90mi |
| 218 Peyton Pl New Brunswick, NJ | 3.0 | 2.5 | 1650 | $3,900 | $2.36 | 2d | 1 | 0.91mi |
| 202 Lyla Ln New Brunswick, NJ | 2.0 | 3.0 | 1238 | $3,200 | $2.58 | 5d | 1 | 0.93mi |
| 385 George St Unit 2B New Brunswick, NJ | 2.0 | 1.0 | 1037 | $2,650 | $2.56 | 25d | 1 | 0.96mi |
| 313 Sadie Cir New Brunswick, NJ | 3.0 | 2.5 | 1654 | $3,950 | $2.39 | 2d | 1 | 0.97mi |
| 214 Jessie Pl Unit 64 New Brunswick, NJ | 2.0 | 2.0 | 1000 | $3,200 | $3.20 | 2d | 1 | 0.98mi |
| 317 Sadie Cir New Brunswick, NJ | 2.0 | 2.0 | 1000 | $3,200 | $3.20 | 11d | 1 | 0.98mi |
| 323 Sadie Cir New Brunswick, NJ | 2.0 | 2.0 | 1000 | $3,200 | $3.20 | 2d | 1 | 0.98mi |
| 614 Sadie Cir New Brunswick, NJ | 2.0 | 2.0 | 1004 | $3,100 | $3.09 | 24d | 1 | 0.99mi |
| 110 Somerset St New Brunswick, NJ | 1.0–2.0 | 1.0–2.0 | 912 | $4,433 | $4.86 | 2d | 20 | 1.10mi |
| 1 Chester Cir New Brunswick, NJ | 2.0 | 1.0–1.5 | 646 | $2,865 | $4.43 | 2d | 17 | 1.26mi |
| 11 U.S. 1 New Brunswick, NJ | 1.0–2.0 | 1.0–2.0 | 1044 | $3,283 | $3.14 | 2d | 12 | 1.35mi |
| 44 Courtlandt St New Brunswick, NJ | 3.0 | 1.0–2.0 | 930 | $3,918 | $4.21 | 2d | 1 | 1.42mi |
Listing history 6 events
-
2026-06-18days on market $535,000 Active 6 DOM
-
2026-06-17days on market $535,000 Active 5 DOM
-
2026-06-16days on market $535,000 Active 4 DOM
-
2026-06-15days on market $535,000 Active 3 DOM
-
2026-06-13remarks 699-char remark
-
2026-06-13$535,000 Active 1 DOM
ⓘ Source: listings_history table (triggers on properties + properties_extension) + one-shot
backfill from property_details.listing_events for pre-trigger history.
Climate risk First Street
- Flood 1/10 Low FEMA zone X (unshaded) · 0% chance over 30 yrs
- Wildfire 1/10 Low
- Heat 7/10 Severe 7 d/yr ≥101°F today · 15 d/yr by 30 yrs out
- Wind 6/10 Major 27% chance of damaging wind over 30 yrs
- Air quality 3/10 Moderate 3 unhealthy d/yr today · 5 by 30 yrs out
Nearby sold comps map
Loading sold comps map…
Walkable amenities ~0.75 mi
Loading nearby amenities…
Taxation est. · year 1
- Rental income
- $78,576
- − Mortgage interest
- −$29,968
- − Property taxes
- −$8,025
- − Insurance
- −$2,675
- − Repairs & maintenance
- −$6,286
- − Management
- −$6,286
- − Depreciation
- −$15,564
- Taxable income
- $9,772
- Est. tax owed @ 24.0%
- −$2,345
- After-tax cash flow
- $15,363/yr
For passive investors: Depreciation is non-cash, so a rental often shows a tax loss while cash-flowing — sheltering income. Rental losses are passive: they offset passive income freely, and up to $25,000/yr can offset ordinary (W-2) income if you actively participate and your MAGI is under $100k (phasing out to $0 by $150k); unused losses carry forward. On sale, claimed depreciation is recaptured at up to 25%, and gains may owe capital-gains tax (a 1031 exchange can defer both). Figures are a year-1 estimate at your 24.0% rate — not tax advice; consult a CPA.
Condition & rehab AI · 13 photos
This property requires moderate renovations to improve its condition and add value. The kitchen and bathroom need significant updates, while exterior siding and landscaping can be refreshed to enhance curb appeal.
Repairs flagged
- Major Kitchen cabinets — Old and outdated
- Major Kitchen countertops — Worn and outdated
- Major Bathroom fixtures — Dated and worn
- Moderate Exterior siding — Weathered and discolored
- Minor Landscaping — Some overgrown vegetation
Value-add opportunities
- Resale New kitchen cabinets and countertops — Modernizes the kitchen and adds value
- Resale New bathroom fixtures — Enhances the bathroom and adds value
- Both Paint exterior siding — Improves curb appeal and adds value
- Both Landscaping improvements — Enhances curb appeal and adds value
Renovation cost estimate screening
| Repair item | Severity | Est. cost |
|---|---|---|
| Kitchen cabinets · Old and outdated | Major | $15,000–50,000 |
| Kitchen countertops · Worn and outdated | Major | $15,000–50,000 |
| Bathroom fixtures · Dated and worn | Major | $15,000–50,000 |
| Exterior siding · Weathered and discolored | Moderate | $3,000–15,000 |
| Landscaping · Some overgrown vegetation | Minor | $500–3,000 |
| Total estimated repair cost · 5 items | $48,500–168,000 |
Value-add ROI direction
- Resale New kitchen cabinets and countertops — Modernizes the kitchen and adds value ↑
- Resale New bathroom fixtures — Enhances the bathroom and adds value ↑
- Both Paint exterior siding — Improves curb appeal and adds value ↑
- Both Landscaping improvements — Enhances curb appeal and adds value ↑
ⓘ Cost ranges are severity-bucket heuristics (US national rule-of-thumb). Get contractor quotes + a written scope before underwriting a rehab budget.
Schools (NCES district)
- District
- New Brunswick School District
- NCES district ID
- 3411220
- Math proficiency
- 4% ▼ -15.00%
- Reading proficiency
- 23% ▼ -9.00%
- Median HH income
- $40,376
- Composite
- 11.53/100
- National rank
- #9700
- State rank
- #463 of 472 in NJ
Livability — New Brunswick
- Score
- 75/100
- State rank
- #154
- US rank
- #3986
Category grades
Schools grade is shown separately in the Schools card above.
Census & demographics
- Census place
- New Brunswick, NJ
- City population
- 57,263
- Population (ZIP)
- 14,518
Population outlook (Middlesex County) Hauer SSP2
- Today (2025)
- 901,713 people
- By 2030
- 930,661 · +3.2%
- By 2040
- 986,276 · +9.4%
- By 2050
- 1,038,920 · +15.2%
- By 2075
- 1,159,418 · +28.6%
- By 2100
- 1,221,973 · +35.5%
Race, ethnicity, and origin ACS 2023
- Neighborhood character
- Diverse neighborhood (Simpson 0.62)
- Race & ethnicity
- White 54% Hispanic / Latino 26% Asian 12% Two or more races 9% Black 6% Native American 2%
- Hispanic origin (detail)
- Mexican 1% Puerto Rican 8% Dominican 3%
- Common ancestry
- Romanian 5% Hispanic 2% Subsaharan African 1%
- Foreign-born
- 24% · Canada, Jamaica, Vietnam
- Languages at home
- 66% English-only · Spanish 18% Other Indo-European 8% Arabic 2%
Political lean MEDSL · Middlesex
- 2024 margin
- Lean D (+8.0) · D 52.5% · R 44.5% · Other 3.0%
- 2008→2024 swing
- -13.8pp toward R · 2008: 21.8pp · 2024: 8.0pp
- All cycles
- 2024: D+8.0 2020: D+22.0 2016: D+19.8 2012: D+27.0 2008: D+21.8
Not yet ingested
- Civics
- —
Market trends
- HPI YoY
- ▼ -290.23%
- Current HPI
- 293.6148
- Rent YoY
- —
- Metro
- —
- State GDP YoY
- ▲ 2.05%
- F500 in state
- 34
Industry mix (Fortune 500 HQ in NJ)
| Industry | F500 HQs | Revenue |
|---|---|---|
| Consumer Goods | 3 | $31B |
|
||
| Pharmaceuticals | 2 | $153B |
|
||
| Technology | 2 | $21B |
|
||
| Insurance | 2 | $20B |
|
||
| Healthcare | 2 | $19B |
|
||
| Financial Services | 1 | $70B |
|
||
Price history
1 event — show timeline
- 2026-06-12 Listed $535,000 MOMLS
Cash-flow waterfall
monthlySold comps — $/sqft
last 12 mo · ≤1 miLoading sold comps…