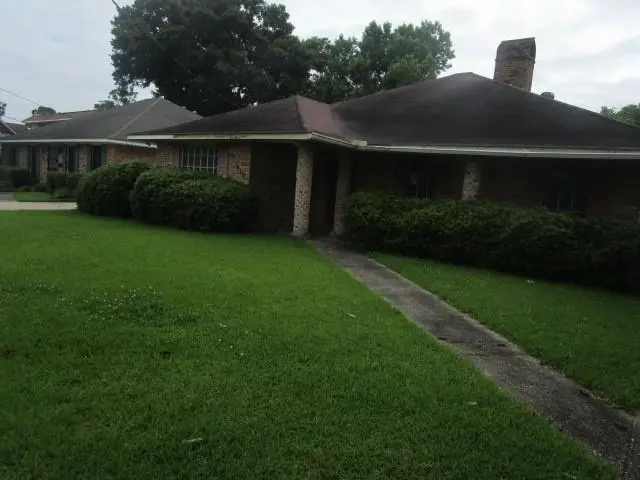
1410 N 28th St · Baton Rouge, LA
Flood risk 1/10 · Minimal
- FEMA flood zone
- X (unshaded)
- Chance of flooding over 30 yrs
- 0.0%
- Est. flood insurance / yr
- $507 – $1,088
Fire risk 1/10 · Minimal
- Est. fire insurance / yr
- $1,269 – $2,357
Heat risk 8/10 · Major
- Hot days now (above 108°F)
- 7 days/yr
- Hot days in 30 yrs
- 20 days/yr
Wind risk 9/10 · Severe
- Chance of severe wind over 30 yrs
- 99.0%
Air-quality risk 2/10 · Minimal
- Unhealthy air days now
- 1 days/yr
- Unhealthy air days in 30 yrs
- 1 days/yr
Risk factors via First Street. Map © Google.
Why this score? — see what drove the B+ grade
The composite is a weighted blend of 9 inputs, each scored 0–100. Each bar is that input's sub-score; the figure is the points it added to the 100-point composite (weight × sub-score).
- Cash flow +30.0/30.0
- ARV discount +15.0/15.0
- 1% rule +10.0/10.0
- DSCR +10.0/10.0
- Rent growth +4.1/5.0
- Livability +3.7/5.0
- Condition / age +2.5/5.0
- Schools +2.4/10.0
- Appreciation +0.0/10.0
$80,000
🖨 Deal sheet 📄 Offer letter ✓ Due diligence
Listing remarks MLS
3 bedroom 2.5 bath brick house features a large carport and brick storage room attached
Key facts
- 7,448 sq ft lot
- 2 parking spots
- Built 1970
Property features AI
Exterior
- Parking: Two parking spaces
- Utilities: Public water; Public sewer
- Home design: Single-story; Brick construction; Asbestos shingle roof; Slab foundation
- Construction: Built with brick; Asbestos shingle roof; Slab foundation
- Exterior features: City lot; Rectangular lot; Lot dimensions approximately 120 x 60
Interior
- Bathrooms: 2 full bathrooms; 1 half bathroom
- Interior features: Total of 4 rooms; Average condition
Neighborhood map
What this means for you Summary
Snapshot
- This is a 3-bed/2.5-bath single-family listed at $80k.
Deal economics
- At list price, monthly cash flow is $622 ($7k/yr) — positive.
- The deal already cash-flows at list — no discount required.
- Meets the 1% rule at list price ($2k rent vs $80k).
- Cap rate 15.6% vs local median 4.3% in Baton Rouge — top-decile yield for the area; either an underpriced asset or a hidden risk that comps aren't pricing in. Stress-test before assuming the spread holds.
Location & tenants
- Location reads 74/100 on livability (#24 in LA, #4,535 nationally) — a middle-class / working-renter tenant base. Strengths: commute A+, cost of living A+, health & safety A+; Watch: amenities D, crime F, employment D-.
- East Baton Rouge Parish (urban): math 22% / reading 34% proficiency, ranked #47 of 98 in LA (top 48%) — low school quality limits family demand, transient renter base, plan for 1-2y turnover; 77% free/reduced lunch — lower-income household profile, screen leases tightly.
- Market conditions: Rents rising fast (+6.6%/yr); 188 active listings in the ZIP; 16 comparable units currently listed for rent nearby; rentals at typical pace (median 24d on market — plan ~3-4 weeks tenant-placement turnaround); lower-income renter base — watch delinquency; 2,252 units permitted in East Baton Rouge Parish in 2024 (440 in 5+ unit buildings).
- At $1,510/mo this rent would consume 53% of the median local household income ($34k/yr) (locally 1831% of renters already pay >50% of income on rent) — very limited rent-growth headroom before tenants either downsize or default.
Forward outlook
- Local home prices are declining (-3.0%/yr); year-one equity from $553 of loan paydown is wiped out by about $2k of value loss. Plan a longer hold.
- East Baton Rouge County population projected at +4% by 2050 — modest demand growth; plan on rents tracking national, not racing it.
- At projected returns (-3.0% appreciation + 6.6% rent growth), your $22k cash investment doubles in ~4 years — after that, you're playing with house money.
Negotiation context
- Only 14 days on market — expect competitive offers; lowballing is unlikely to land.
- 7 sale attempts since 15y ago with the ask held roughly flat each time — persistent listings suggest the price (not the market) is what's stuck; bring a comps-based counter.
Risks & watch-outs
- Climate carrying-cost: severe wind risk, 99% chance of damaging wind over 30y; extreme-heat days projected 7→20/yr by 2055 (HVAC capex compounding) — expect insurance premiums to compound above CPI over the hold.
Questions for the listing agent
- Built in 1970 — when were the roof, HVAC, electrical panel, plumbing, and water heater last replaced?
- Is there a deadline driving the sale (1031 exchange, divorce, estate, relocation)? That informs how much negotiation room exists.
- Crime grade is F in this area — have there been break-ins, vandalism, or insurance claims at this property in the last 3 years? What carrier currently insures it and at what premium?
- What's the average days-on-market for RENTAL listings here right now (not sales)? A rising rental-DOM trend means longer vacancies and softer asking-rent achievability than the comps imply.
- What's the recent tenant-quality profile in this submarket — average credit score on applications, eviction rate, late-payment / NSF rate, and stable-employment percentage? A property-management company in the area should have these aggregated.
- How much new for-sale + rental construction is in the pipeline within 1–3 miles? Heavy new supply typically softens prices + rents 12–24 months out; constrained supply supports both.
Investment metrics
- 1% rule
- 1.89% ✓
- Cap rate
- 15.63%
- Cash-on-cash
- 33.33%
- DSCR
- 2.48
- GRM
- 4.4
CMA / ARV
- ARV (on-the-fly)
- $125,710
- Comps found
- 12
Show comp detail 12 sales within ~0.75 mi
| Address | Dist | Beds/Ba | Sqft | Sold | Price | $/sf | Match |
|---|---|---|---|---|---|---|---|
| 1715 N 26th St | 0.20mi | 3/2.0 | 1,977 (+2%) | 21mo | $140,000 | $71 | 68 |
| 1812 N Plank Rd | 0.36mi | 4/1.5 (+1) | 1,826 (-6%) | 3mo | $49,900 | $27 | 62 |
| 2944 Lula Ave | 0.11mi | 3/2.0 | 1,702 (-12%) | 13mo | $169,000 | $99 | 62 |
| 668 N 30th St | 0.51mi | 4/2.0 (+1) | 1,807 (-7%) | 4mo | $55,000 | $30 | 55 |
| 2410 Willow St | 0.22mi | 4/1.5 (+1) | 1,746 (-10%) | 12mo | $139,000 | $80 | 54 |
| 2029 Gracie St | 0.57mi | 3/2.0 | 1,790 (-7%) | 7mo | $75,000 | $42 | 53 |
| 2959 Jackson Ave | 0.33mi | 3/2.0 | 1,781 (-8%) | 20mo | $115,000 | $65 | 53 |
| 4042 S Barrow Dr | 0.70mi | 4/1.5 (+1) | 1,918 (-1%) | 9mo | $79,900 | $42 | 50 |
| 407 N 24th St | 0.75mi | 3/2.0 | 1,647 (-15%) | 4mo | $205,000 | $124 | 35 |
| 1130 N 38th St | 0.55mi | 3/2.0 | 2,200 (+14%) | 19mo | $60,000 | $27 | 33 |
| 2060 Hemlock St | 0.60mi | 2/1.0 (-1) | 1,665 (-14%) | 7mo | $99,000 | $59 | 32 |
| 449 N 24th St | 0.71mi | 3/2.0 | 1,647 (-15%) | 12mo | $210,000 | $128 | 30 |
Match score weights: distance 35% · size 25% · config 20% · recency 20%. Top-matched comps best support the ARV.
Projected returns pro-forma
-3.0% appreciation · 6.59% rent growth · sell at horizon
- IRR
- 32.7%
- Equity multiple
- 2.44×
- Total profit
- $32,348
- Equity at exit
- $11,928
- IRR
- 41.6%
- Equity multiple
- 5.66×
- Total profit
- $104,292
- Equity at exit
- $6,917
Cash invested: $22,400 (down + closing). Projections, not guarantees.
Landlord ↔ Tenant lean methodology
- Overall (STATE)
- 90 Strongly Landlord-Friendly
- State Louisiana
- 90 Strongly Landlord-Friendly · R+12
- County
- — inherits STATE
- City
- — inherits STATE
ZIP-level market 70802
- Rents YoY
- 6.6%
- Active inventory
- 188
- Price-to-rent
- 4.4×
Monthly cashflow live
- Estimated rent
- $1,510 high interval (Pro) →
- Mortgage (P&I)
- −$420
- Tax from tax record
- −$117 /mo · $1,410/yr
- Insurance
- −$33
- HOA
- −$0
- Vacancy / Maint / Mgmt
- −$317
- Net cashflow
- $622
Break-even live
UW: 25.0% down · 7.5% · 30yr · 1.5% tax · 5.0% vac · 8.0% maint · 8.0% mgmt
Financing live
Cash to close
- Down payment
- $20,000
- Closing costs
- $2,400
- Reserves months
- —
- Total cash needed
- —
Loan-product check · same deal, 3 products live
Conventional
25% down · 7.5% · 30yr
- Down + closing
- —
- Monthly P&I
- —
- Monthly cashflow
- —
- DSCR
- —
- Eligible?
- —
Personal DTI + credit; lowest rate.
DSCR
20% down · 8.5% · 30yr
- Down + closing
- —
- Monthly P&I
- —
- Monthly cashflow
- —
- DSCR
- —
- Eligible?
- —
No personal income docs; deal must DSCR.
Hard money
10% down · 12.0% · 12mo
- Down + closing
- —
- Monthly P&I
- —
- Monthly cashflow
- —
- DSCR
- —
- Eligible?
- —
Short-term bridge; refi at stabilization.
Rent comps 16 comps
| Address | Beds | Baths | Sqft | Rent | $/sqft | DOM | Units | Dist |
|---|---|---|---|---|---|---|---|---|
| 1336 N 29th St Baton Rouge, LA | 3.0 | 2.0 | 1400 | $1,450 | $1.04 | 14d | 1 | 0.07mi |
| 3906 S Barrow Dr Baton Rouge, LA | 3.0 | 2.0 | 1523 | $1,295 | $0.85 | 23d | 1 | 0.58mi |
| 2645 Seneca St Baton Rouge, LA | 3.0 | 2.0 | 1650 | $1,550 | $0.94 | 23d | 1 | 0.67mi |
| 2347 Rhodes Ave Baton Rouge, LA | 2.0 | 1.0 | 1250 | $950 | $0.76 | 19d | 1 | 0.86mi |
| 2120 Convention St Baton Rouge, LA | 3.0 | 2.0 | 2200 | $1,675 | $0.76 | 14d | 1 | 0.99mi |
| 3044 Wilshire Dr Baton Rouge, LA | 3.0 | 2.0 | 1734 | $2,350 | $1.36 | 14d | 1 | 1.12mi |
| 239 West Dr Baton Rouge, LA | 2.0 | 1.0 | 1428 | $1,250 | $0.88 | 23d | 1 | 1.16mi |
| 1201 N Foster Dr Baton Rouge, LA | 1.0–3.0 | 1.0–3.0 | 1300 | $1,688 | $1.30 | 14d | 31 | 1.20mi |
| 3725 Winbourne Ave Baton Rouge, LA | 4.0 | 2.0 | 1900 | $1,550 | $0.82 | 43d | 1 | 1.24mi |
| 3725 Winbourne Ave Baton Rouge, LA | 4.0 | 1.5 | 1800 | $1,495 | $0.83 | 19d | 1 | 1.24mi |
| 3567 Charles St Baton Rouge, LA | 3.0 | 1.0 | 1400 | $1,250 | $0.89 | 43d | 1 | 1.40mi |
| 755 Arlington Ave Baton Rouge, LA | 4.0 | 2.5 | 1760 | $2,250 | $1.28 | 19d | 1 | 1.41mi |
| 422 Glenmore Ave Baton Rouge, LA | 3.0 | 2.0 | 1307 | $1,700 | $1.30 | 23d | 1 | 1.41mi |
| 5212 Jackson Ave Baton Rouge, LA | 4.0 | 2.0 | 1500 | $1,650 | $1.10 | 23d | 1 | 1.42mi |
| 3888 Charles St Baton Rouge, LA | 3.0 | 2.0 | 1600 | $1,500 | $0.94 | 19d | 1 | 1.45mi |
| 3888 Charles St Baton Rouge, LA | 3.0 | 2.0 | 1650 | $1,425 | $0.86 | 23d | 1 | 1.45mi |
Listing history 11 events
-
2026-06-15status $80,000 Pending 14 DOM
-
2026-06-15days on market $80,000 Active 14 DOM
-
2026-06-14days on market $80,000 Active 12 DOM
-
2026-06-10days on market $80,000 Active 9 DOM
-
2026-06-09days on market $80,000 Active 8 DOM
-
2026-06-08days on market $80,000 Active 7 DOM
-
2026-06-07days on market $80,000 Active 6 DOM
-
2026-06-05days on market $80,000 Active 3 DOM
-
2026-06-03days on market $80,000 Active 2 DOM
-
2026-06-02remarks 87-char remark
-
2026-06-02$80,000 Active 1 DOM
ⓘ Source: listings_history table (triggers on properties + properties_extension) + one-shot
backfill from property_details.listing_events for pre-trigger history.
Tax reassessment forecast LA · Resets to sale price
- Current annual tax
- $1,410 · $117/mo
- Projected year-2 tax
- $1,410 · $117/mo
- Expected delta
- $0/yr ($0/mo · 0.0%)
ⓘ Screening estimate from a state-policy table — verify with the county assessor before closing.
Climate risk First Street
- Flood 1/10 Low FEMA zone X (unshaded) · 0% chance over 30 yrs
- Wildfire 1/10 Low
- Heat 8/10 Severe 7 d/yr ≥108°F today · 20 d/yr by 30 yrs out
- Wind 9/10 Extreme 99% chance of damaging wind over 30 yrs
- Air quality 2/10 Low 1 unhealthy d/yr today · 1 by 30 yrs out
Nearby sold comps map
Loading sold comps map…
Walkable amenities ~0.75 mi
Loading nearby amenities…
Taxation est. · year 1
- Rental income
- $18,115
- − Mortgage interest
- −$4,481
- − Property taxes
- −$1,410
- − Insurance
- −$400
- − Repairs & maintenance
- −$1,449
- − Management
- −$1,449
- − Depreciation
- −$2,327
- Taxable income
- $6,598
- Est. tax owed @ 24.0%
- −$1,584
- After-tax cash flow
- $5,883/yr
For passive investors: Depreciation is non-cash, so a rental often shows a tax loss while cash-flowing — sheltering income. Rental losses are passive: they offset passive income freely, and up to $25,000/yr can offset ordinary (W-2) income if you actively participate and your MAGI is under $100k (phasing out to $0 by $150k); unused losses carry forward. On sale, claimed depreciation is recaptured at up to 25%, and gains may owe capital-gains tax (a 1031 exchange can defer both). Figures are a year-1 estimate at your 24.0% rate — not tax advice; consult a CPA.
Schools (NCES district)
- District
- East Baton Rouge Parish
- NCES district ID
- 2200540
- Math proficiency
- 22% ▼ -36.00%
- Reading proficiency
- 34% ▼ -31.00%
- Median HH income
- $46,263
- Composite
- 24.14/100
- National rank
- #7745
- State rank
- #47 of 98 in LA
Livability — Baton Rouge
- Score
- 74/100
- State rank
- #24
- US rank
- #4535
Category grades
Schools grade is shown separately in the Schools card above.
Census & demographics
- Census place
- Baton Rouge, LA
- County
- East Baton Rouge Parish · 399,686 people
- City population
- 351,868
- Metro
- Baton Rouge, LA
- Population (ZIP)
- 25,118
- Household income
- $34,458
- Rent vs Own
- Severe rent burden
- 1831.0
Population outlook (East Baton Rouge County) Hauer SSP2
- Today (2025)
- 464,810 people
- By 2030
- 472,137 · +1.6%
- By 2040
- 480,243 · +3.3%
- By 2050
- 484,422 · +4.2%
- By 2075
- 492,069 · +5.9%
- By 2100
- 476,347 · +2.5%
Race, ethnicity, and origin ACS 2023
- Neighborhood character
- Predominantly Black (69%)
- Race & ethnicity
- Black 69% White 20% Two or more races 5% Hispanic / Latino 5% Asian 3%
- Common ancestry
- Lithuanian 2% Italian 1% Iranian 0%
- Foreign-born
- 6% · Canada, Vietnam
- Languages at home
- 91% English-only · Spanish 3% Tagalog/Filipino 1% Other Indo-European 1%
Political lean MEDSL · East Baton Rouge
- 2024 margin
- D (+11.1) · D 54.5% · R 43.4% · Other 2.1%
- 2008→2024 swing
- +8.9pp toward D · 2008: 2.2pp · 2024: 11.1pp
- All cycles
- 2024: D+11.1 2020: D+13.1 2016: D+9.2 2012: D+5.2 2008: D+2.2
Not yet ingested
- Civics
- —
Market trends
- HPI YoY
- ▼ -137.02%
- Current HPI
- 47.7285
- Rent YoY
- ▲ 6.59%
- Metro
- Baton Rouge, LA
- State GDP YoY
- ▲ 3.29%
- F500 in state
- 10
Industry mix (Fortune 500 HQ in LA)
| Industry | F500 HQs | Revenue |
|---|---|---|
| Telecommunications | 2 | $23B |
|
||
| Utilities | 1 | $12B |
|
||
| Wholesale / Distribution | 1 | $5B |
|
||
| Advertising | 1 | $2B |
|
||
Price history
-30.4% since first listed12 events — show timeline
- 2026-06-01 Listed $80,000 GSREIN
- 2026-06-01 Listed $80,000 AcadianaMLS
- 2025-03-15 Pending — GBRMLS
- 2025-03-05 Relisted — GBRMLS
- 2025-02-12 Pending — GBRMLS
- 2025-02-04 Relisted — GBRMLS
- 2024-12-31 Pending — GBRMLS
- 2024-12-28 Listed $125,000 GBRMLS
- 2024-12-28 Listed $125,000 AcadianaMLS
- 2011-12-19 Sold (Public Records) $115,000 Public Records
- 2011-10-29 Listed $115,000 AcadianaMLS
- 1980-08-15 Sold (Public Records) — Public Records
Property tax history
+8.7%/yrLatest (2025): $1,410 · +4.7% YoY. Source: county tax records.
Cash-flow waterfall
monthlySold comps — $/sqft
last 12 mo · ≤1 miLoading sold comps…