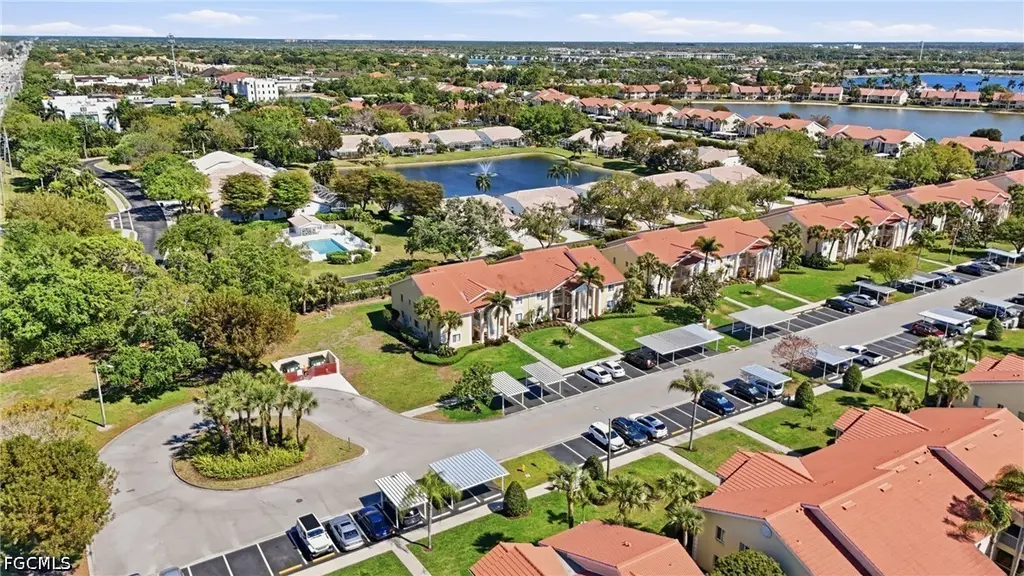
7774 Jewel Ln #103 · Pelican Marsh, FL
Flood risk 4/10 · Minor
- FEMA flood zone
- X (shaded)
- Chance of flooding over 30 yrs
- 0.13%
- Est. flood insurance / yr
- $507 – $1,088
Fire risk 1/10 · Minimal
- Est. fire insurance / yr
- $947 – $1,759
Heat risk 10/10 · Severe
- Hot days now (above 107°F)
- 7 days/yr
- Hot days in 30 yrs
- 29 days/yr
Wind risk 10/10 · Severe
- Chance of severe wind over 30 yrs
- 99.0%
Air-quality risk 2/10 · Minimal
- Unhealthy air days now
- 2 days/yr
- Unhealthy air days in 30 yrs
- 2 days/yr
Risk factors via First Street. Map © Google.
Why this score? — see what drove the C grade
The composite is a weighted blend of 9 inputs, each scored 0–100. Each bar is that input's sub-score; the figure is the points it added to the 100-point composite (weight × sub-score).
- Cash flow +19.7/30.0
- ARV discount +7.5/15.0
- 1% rule +7.2/10.0
- DSCR +6.3/10.0
- Appreciation +5.1/10.0
- Schools +5.0/10.0
- Rent growth +2.7/5.0
- Livability +2.5/5.0
- Condition / age +2.5/5.0
$265,000
🖨 Deal sheet 📄 Offer letter ✓ Due diligence
Listing remarks
First-Floor Condo in Prime North Naples Location | Move-In Ready Welcome to easy, low-maintenance living in the heart of North Naples. This sun-filled 2-bedroom, 2-bathroom first-floor condo offers a desirable split-bedroom layout, providing both comfort and privacy for owners and guests alike. The kitchen has been thoughtfully updated with granite countertops and stainless steel appliances, creating a clean, modern feel that flows seamlessly into the main living space. Recent improvements add peace of mind, including a 2025 garbage disposal, 2023 microwave, 2023 reverse osmosis system, updated ceiling fans, and a 2018 AC system. The spacious primary suite features an updated bathroom wi
Key facts
- Gated community
- Split bedroom layout
- First floor condo
Tags
Neighborhood map
What this means for you Summary
Snapshot
- This is a 2-bed/2.0-bath condo listed at $265k.
Deal economics
- At list price, monthly cash flow is $313 ($4k/yr) — positive.
- The deal already cash-flows at list — no discount required.
- Meets the 1% rule at list price ($3k rent vs $265k).
- Recommended offer: $257k (3.0% below list) — sets the bar for market timing.
Location & tenants
- Location reads: area grade C — affects rentability + tenant quality, not the cash-flow math above.
- Collier (suburban): math 60% / reading 56% proficiency, ranked #16 of 73 in FL (top 22%) — acceptable for families but not a draw, mixed tenant base, ~2y average lease.
- Market conditions: Rents flat; 424 active listings in the ZIP; 40 comparable units currently listed for rent nearby; rentals leasing fast (median 14d on market — plan ~1-2 weeks tenant-placement turnaround); solid renter incomes; 3,520 units permitted in Collier County in 2024 (959 in 5+ unit buildings).
- This rent runs 42% of the median local income ($92k/yr) — at the standard rent-burdened threshold; future hikes will face affordability resistance.
Forward outlook
- In year one you build about $3k of equity ($2k loan paydown + $781 appreciation (0.3% local appreciation)).
- Collier County population projected at +30% by 2050 — long-run rental-demand tailwind backs the buy-and-hold thesis.
- By year 10, paydown + projected appreciation supports a ~$32k cash-out refi (75% LTV) — recoverable capital for the next deal without selling this one.
Negotiation context
- It's been on market 32 days — a 3% lower offer ($257k) is reasonable based on typical stale-listing flexibility.
- 7 sale attempts since 12y ago with the ask held roughly flat each time — persistent listings suggest the price (not the market) is what's stuck; bring a comps-based counter.
- Current owner paid $120k; list at $265k implies a 120% gain — meaningful room to come down on a strong offer.
Risks & watch-outs
- Climate carrying-cost: severe wind risk, 99% chance of damaging wind over 30y; extreme-heat days projected 7→29/yr by 2055 (HVAC capex compounding) — expect insurance premiums to compound above CPI over the hold.
Questions for the listing agent
- It's been on market 32 days. Have you received any prior offers? Is the seller open to a 3% concession, seller financing, or rate buy-down credit?
- What does the HOA fee cover, when was the last increase, and are there any pending special assessments or reserve-fund shortfalls?
- Any open or pending special assessments — roof, HVAC, plumbing, elevator, façade? What's the per-unit balance and payoff schedule, and is the seller paying it off at close or rolling it to the buyer?
- Is there a deadline driving the sale (1031 exchange, divorce, estate, relocation)? That informs how much negotiation room exists.
- What's the average days-on-market for RENTAL listings here right now (not sales)? A rising rental-DOM trend means longer vacancies and softer asking-rent achievability than the comps imply.
- What's the recent tenant-quality profile in this submarket — average credit score on applications, eviction rate, late-payment / NSF rate, and stable-employment percentage? A property-management company in the area should have these aggregated.
- How much new apartment / multifamily construction is in the pipeline within 1–3 miles? Heavy new supply (>2% of stock underway) typically softens rents 12–24 months out; light construction supports rent growth.
Investment metrics
- 1% rule
- 1.22% ✓
- Cap rate
- 7.71%
- Cash-on-cash
- 5.06%
- DSCR
- 1.23
- GRM
- 6.8
CMA / ARV
No comps found within radius.
Projected returns pro-forma
0.29% appreciation · 0.92% rent growth · sell at horizon
- IRR
- 2.7%
- Equity multiple
- 1.13×
- Total profit
- $9,532
- Equity at exit
- $80,878
- IRR
- 6.1%
- Equity multiple
- 1.65×
- Total profit
- $48,062
- Equity at exit
- $100,414
Cash invested: $74,200 (down + closing). Projections, not guarantees.
Landlord ↔ Tenant lean methodology
- Overall (STATE)
- 87 Strongly Landlord-Friendly
- State Florida
- 87 Strongly Landlord-Friendly · R+3
- County
- — inherits STATE
- City
- — inherits STATE
ZIP-level market 34109
- Home prices YoY
- 0.1%
- Rents YoY
- 0.9%
- Active inventory
- 424
- Price-to-rent
- 6.8×
Monthly cashflow live
- Estimated rent
- $3,236 high interval (Pro) →
- Mortgage (P&I)
- −$1,390
- Tax from tax record
- −$193 /mo · $2,320/yr
- Insurance
- −$110
- HOA
- −$550
- Vacancy / Maint / Mgmt
- −$679
- Net cashflow
- $313
Break-even live
UW: 25.0% down · 7.5% · 30yr · 1.5% tax · 5.0% vac · 8.0% maint · 8.0% mgmt
Financing live
Cash to close
- Down payment
- $66,250
- Closing costs
- $7,950
- Reserves months
- —
- Total cash needed
- —
Loan-product check · same deal, 3 products live
Conventional
25% down · 7.5% · 30yr
- Down + closing
- —
- Monthly P&I
- —
- Monthly cashflow
- —
- DSCR
- —
- Eligible?
- —
Personal DTI + credit; lowest rate.
DSCR
20% down · 8.5% · 30yr
- Down + closing
- —
- Monthly P&I
- —
- Monthly cashflow
- —
- DSCR
- —
- Eligible?
- —
No personal income docs; deal must DSCR.
Hard money
10% down · 12.0% · 12mo
- Down + closing
- —
- Monthly P&I
- —
- Monthly cashflow
- —
- DSCR
- —
- Eligible?
- —
Short-term bridge; refi at stabilization.
Rent comps 40 comps
| Address | Beds | Baths | Sqft | Rent | $/sqft | DOM | Units | Dist |
|---|---|---|---|---|---|---|---|---|
| 7774 Jewel Ln #201 Naples, FL | 3.0 | 2.0 | 1299 | $2,800 | $2.16 | 23d | 1 | 0.02mi |
| 7756 Jewel Ln #102 Naples, FL | 2.0 | 2.0 | 1022 | $3,700 | $3.62 | 23d | 1 | 0.08mi |
| 7750 Jewel Ln #103 Naples, FL | 2.0 | 2.0 | 1102 | $2,100 | $1.91 | 13d | 1 | 0.11mi |
| 7750 Jewel Ln #101 Naples, FL | 3.0 | 2.0 | 1199 | $2,400 | $2.00 | 21d | 1 | 0.11mi |
| 7754 Emerald Cir Unit T202 Naples, FL | 2.0 | 2.0 | 1022 | $3,850 | $3.77 | 13d | 1 | 0.15mi |
| 7778 Emerald Cir #104 Naples, FL | 3.0 | 2.0 | 1199 | $2,300 | $1.92 | 21d | 1 | 0.22mi |
| 7778 Emerald Cir #204 Naples, FL | 3.0 | 2.0 | 1199 | $6,750 | $5.63 | 13d | 1 | 0.22mi |
| 7719 Jewel Ln #103 Naples, FL | 2.0 | 2.0 | 1022 | $3,800 | $3.72 | 23d | 1 | 0.25mi |
| 7712 Jewel Ln Naples, FL | 2.0 | 2.0 | 1022 | $1,850 | $1.81 | 23d | 1 | 0.26mi |
| 7791 Esmeralda Way #203 Naples, FL | 2.0 | 2.0 | 1022 | $1,950 | $1.91 | 13d | 1 | 0.29mi |
| 7794 Emerald Cir Unit A-102 Naples, FL | 2.0 | 2.0 | 1022 | $4,000 | $3.91 | 13d | 1 | 0.29mi |
| 7800 Emerald Cir #104 Naples, FL | 2.0 | 2.0 | 1022 | $2,200 | $2.15 | 21d | 1 | 0.30mi |
| 7800 Emerald Cir Unit B104 Naples, FL | 2.0 | 2.0 | 1022 | $2,200 | $2.15 | 13d | 1 | 0.30mi |
| 7707 Jewel Ln #201 Naples, FL | 3.0 | 2.0 | 1199 | $2,900 | $2.42 | 23d | 1 | 0.30mi |
| 7546 Mill Pond Cir Naples, FL | 3.0 | 2.0 | 1373 | $6,500 | $4.73 | 23d | 1 | 0.37mi |
| 6914 Satinleaf Rd N #103 Naples, FL | 2.0 | 2.0 | 1404 | $6,200 | $4.42 | 23d | 1 | 0.66mi |
| 7287 Mill Pond Cir Naples, FL | 3.0 | 2.0 | 1355 | $3,800 | $2.80 | 23d | 1 | 0.66mi |
| 2460 Old Groves Rd Unit E102 Naples, FL | 2.0 | 2.0 | 1226 | $2,400 | $1.96 | 13d | 1 | 0.68mi |
| 2608 Sailors Way #122 Naples, FL | 2.0 | 2.0 | 1387 | $5,500 | $3.97 | 23d | 1 | 0.68mi |
| 7416 Plumbago Bridge Rd #103 Naples, FL | 2.0 | 2.0 | 1223 | $2,400 | $1.96 | 13d | 1 | 0.74mi |
| 6934 Rain Lily Ct #102 Naples, FL | 2.0 | 2.0 | 1282 | $4,500 | $3.51 | 23d | 1 | 0.81mi |
| 6934 Rain Lily Ct #103 Naples, FL | 2.0 | 2.0 | 1282 | $5,200 | $4.06 | 23d | 1 | 0.81mi |
| 7518 Silver Trumpet Ln Unit Q102 Naples, FL | 2.0 | 2.0 | 1300 | $2,600 | $2.00 | 13d | 1 | 0.84mi |
| 2651 Citrus Lake Dr Unit D302 Naples, FL | 2.0 | 2.0 | 1250 | $5,000 | $4.00 | 13d | 1 | 0.84mi |
| 2671 Citrus Lake Dr Unit E-303 Naples, FL | 2.0 | 2.0 | 1380 | $3,500 | $2.54 | 13d | 1 | 0.86mi |
| 2671 Citrus Lake Dr Unit E-201 Naples, FL | 3.0 | 2.0 | 1380 | $5,250 | $3.80 | 13d | 1 | 0.86mi |
| 2516 Orchid Bay Dr #203 Naples, FL | 2.0 | 2.0 | 1360 | $4,750 | $3.49 | 23d | 1 | 0.87mi |
| 6816 Satinleaf Rd S #102 Naples, FL | 2.0 | 2.0 | 1282 | $5,000 | $3.90 | 23d | 1 | 0.89mi |
| 2711 Citrus Lake Dr Unit F302 Naples, FL | 2.0 | 2.0 | 1272 | $4,500 | $3.54 | 13d | 1 | 0.90mi |
| 2711 Citrus Lake Dr Unit F305 Naples, FL | 3.0 | 2.0 | 1480 | $5,500 | $3.72 | 13d | 1 | 0.90mi |
| 2585 Old Groves Rd Unit L203 Naples, FL | 2.0 | 2.0 | 1448 | $5,500 | $3.80 | 13d | 1 | 0.91mi |
| 2731 Citrus Lake Dr #202 Naples, FL | 2.0 | 2.0 | 1260 | $2,500 | $1.98 | 13d | 1 | 0.93mi |
| 2864 Mizzen Way Unit Y106 Naples, FL | 2.0 | 2.0 | 1350 | $5,200 | $3.85 | 13d | 1 | 0.98mi |
| 516 Gordonia Rd Naples, FL | 2.0 | 1.0 | 1100 | $3,200 | $2.91 | 23d | 1 | 0.99mi |
| 2885 Citrus Lake Dr Unit N103 Naples, FL | 2.0 | 2.0 | 1249 | $5,250 | $4.20 | 13d | 1 | 1.04mi |
| 2058 Arbour Walk Cir #3322 Naples, FL | 2.0 | 2.0 | 918 | $2,000 | $2.18 | 23d | 1 | 1.11mi |
| 2277 Arbour Walk Cir Naples, FL | 1.0–2.0 | 1.0–2.0 | 937 | $2,540 | $2.71 | 13d | 25 | 1.13mi |
| 9580 Victoria Ln Unit A-202 Naples, FL | 2.0 | 2.0 | 1191 | $1,900 | $1.60 | 13d | 1 | 1.13mi |
| 2728 Tiburon Blvd E Unit A-104 Naples, FL | 2.0 | 2.0 | 1465 | $12,500 | $8.53 | 13d | 1 | 1.13mi |
| 2728 Tiburon Blvd E Unit A-203 Naples, FL | 2.0 | 2.0 | 1465 | $11,000 | $7.51 | 13d | 1 | 1.13mi |
HOA detail condo
- Monthly dues
- $550 · $6,600/yr
- Likely covers
- trash
- Assessments
- None detected in remarks — confirm with the listing agent.
Listing history 24 events
-
2026-04-27status Pending
-
2026-04-21price $265,000
-
2026-03-23$275,000 Active
-
2026-03-17historical
-
2026-01-23price $304,900
-
2025-10-20$324,900 Active
-
2025-04-02historical
-
2025-03-04price $287,900
-
2025-01-08$299,900 Active
-
2024-11-28historical
-
2024-11-21price $309,900
-
2024-10-30status Active
-
2024-10-16status Pending
-
2024-09-17price $315,000
-
2024-04-29price $326,900
-
2024-03-29$336,900 Active
-
2024-03-25historical
-
2024-03-14price $336,900
-
2024-02-09$346,900 Active
-
2015-03-02price $115,000
-
2014-04-21soldstatus $120,474
-
2014-03-18$120,474
-
2005-05-05soldstatus $175,000
-
1994-09-29soldstatus $61,500
ⓘ Source: listings_history table (triggers on properties + properties_extension) + one-shot
backfill from property_details.listing_events for pre-trigger history.
Tax reassessment forecast FL · Resets to sale price
- Current annual tax
- $2,320 · $193/mo
- Projected year-2 tax
- $2,320 · $193/mo
- Expected delta
- $0/yr ($0/mo · 0.0%)
ⓘ Screening estimate from a state-policy table — verify with the county assessor before closing.
Climate risk First Street
- Flood 4/10 Moderate FEMA zone X (shaded) · 13% chance over 30 yrs
- Wildfire 1/10 Low
- Heat 10/10 Extreme 7 d/yr ≥107°F today · 29 d/yr by 30 yrs out
- Wind 10/10 Extreme 99% chance of damaging wind over 30 yrs
- Air quality 2/10 Low 2 unhealthy d/yr today · 2 by 30 yrs out
Nearby sold comps map
Loading sold comps map…
Walkable amenities ~0.75 mi
Loading nearby amenities…
Taxation est. · year 1
- Rental income
- $38,829
- − Mortgage interest
- −$14,844
- − Property taxes
- −$2,320
- − Insurance
- −$1,325
- − Repairs & maintenance
- −$3,106
- − Management
- −$3,106
- − HOA
- −$6,600
- − Depreciation
- −$7,709
- Taxable loss
- −$182
- Est. tax savings @ 24.0%
- +$44
- After-tax cash flow
- $3,797/yr
For passive investors: Depreciation is non-cash, so a rental often shows a tax loss while cash-flowing — sheltering income. Rental losses are passive: they offset passive income freely, and up to $25,000/yr can offset ordinary (W-2) income if you actively participate and your MAGI is under $100k (phasing out to $0 by $150k); unused losses carry forward. On sale, claimed depreciation is recaptured at up to 25%, and gains may owe capital-gains tax (a 1031 exchange can defer both). Figures are a year-1 estimate at your 24.0% rate — not tax advice; consult a CPA.
Schools (NCES district)
- District
- Collier
- NCES district ID
- 1200330
- Math proficiency
- 60% ▼ -4.00%
- Reading proficiency
- 56% ▼ -2.00%
- Median HH income
- $58,275
- Composite
- 50.23/100
- National rank
- #1892
- State rank
- #16 of 73 in FL
Livability — Pelican Marsh
No livability data for this city. (Only ~50 U.S. cities are tracked.)
Census & demographics
- County
- Collier County · 396,295 people
- Metro
- Naples-Marco Island, FL
- Population (ZIP)
- 27,273
- Household income
- $92,259
- Rent vs Own
- Severe rent burden
- 1712.0
Population outlook (Collier County) Hauer SSP2
- Today (2025)
- 420,858 people
- By 2030
- 450,054 · +6.9%
- By 2040
- 502,232 · +19.3%
- By 2050
- 544,932 · +29.5%
- By 2075
- 627,203 · +49.0%
- By 2100
- 659,015 · +56.6%
Race, ethnicity, and origin ACS 2023
- Neighborhood character
- Predominantly White (78%)
- Race & ethnicity
- White 78% Hispanic / Latino 11% Two or more races 9% Black 4% Asian 4%
- Hispanic origin (detail)
- Mexican 1% Puerto Rican 1% Cuban 3%
- Common ancestry
- Romanian 5% Scotch-Irish 3% Lithuanian 2%
- Foreign-born
- 20% · Canada, Jamaica, Vietnam
- Languages at home
- 77% English-only · Spanish 10% Other Indo-European 5% Russian/Polish/Slavic 3%
Political lean MEDSL · Collier
- 2024 margin
- Solid R (+33.1) · D 33.1% · R 66.2%
- 2008→2024 swing
- -10.6pp toward R · 2008: -22.5pp · 2024: -33.1pp
- All cycles
- 2024: R+33.1 2020: R+24.7 2016: R+26.0 2012: R+30.1 2008: R+22.5
Not yet ingested
- Civics
- —
Market trends
- HPI YoY
- ▲ 0.29%
- Current HPI
- 279.357
- Rent YoY
- ▲ 0.92%
- Metro
- Naples-Marco Island, FL
- State GDP YoY
- ▲ 3.28%
- F500 in state
- 36
Industry mix (Fortune 500 HQ in FL)
| Industry | F500 HQs | Revenue |
|---|---|---|
| Industrial Technology | 2 | $29B |
|
||
| Insurance | 2 | $17B |
|
||
| Retail | 1 | $60B |
|
||
| Technology Distribution | 1 | $58B |
|
||
| Homebuilding | 1 | $35B |
|
||
| Technology Manufacturing | 1 | $35B |
|
||
Price history
+330.9% since first listed24 events — show timeline
- 2026-04-27 Pending — FORTMLS
- 2026-04-21 Price Changed $265,000 FORTMLS
- 2026-03-23 Listed $275,000 FORTMLS
- 2026-03-17 Listing Removed — NAPLESMLS
- 2026-01-23 Price Changed $304,900 NAPLESMLS
- 2025-10-20 Listed $324,900 NAPLESMLS
- 2025-04-02 Listing Removed — NAPLESMLS
- 2025-03-04 Price Changed $287,900 NAPLESMLS
- 2025-01-08 Listed $299,900 NAPLESMLS
- 2024-11-28 Listing Removed — NAPLESMLS
- 2024-11-21 Price Changed $309,900 NAPLESMLS
- 2024-10-30 Relisted — NAPLESMLS
- 2024-10-16 Pending — NAPLESMLS
- 2024-09-17 Price Changed $315,000 NAPLESMLS
- 2024-04-29 Price Changed $326,900 NAPLESMLS
- 2024-03-29 Listed $336,900 NAPLESMLS
- 2024-03-25 Listing Removed — FORTMLS
- 2024-03-14 Price Changed $336,900 FORTMLS
- 2024-02-09 Listed $346,900 FORTMLS
- 2015-03-02 Price Changed $115,000 FORTMLS
- 2014-04-21 Sold (MLS) $120,474 FORTMLS
- 2014-03-18 Listed $120,474 FORTMLS
- 2005-05-05 Sold (Public Records) $175,000 Public Records
- 1994-09-29 Sold (Public Records) $61,500 Public Records
Property tax history
+7.0%/yrLatest (2025): $2,320 · +6.2% YoY. Source: county tax records.
Cash-flow waterfall
monthlySold comps — $/sqft
last 12 mo · ≤1 miLoading sold comps…