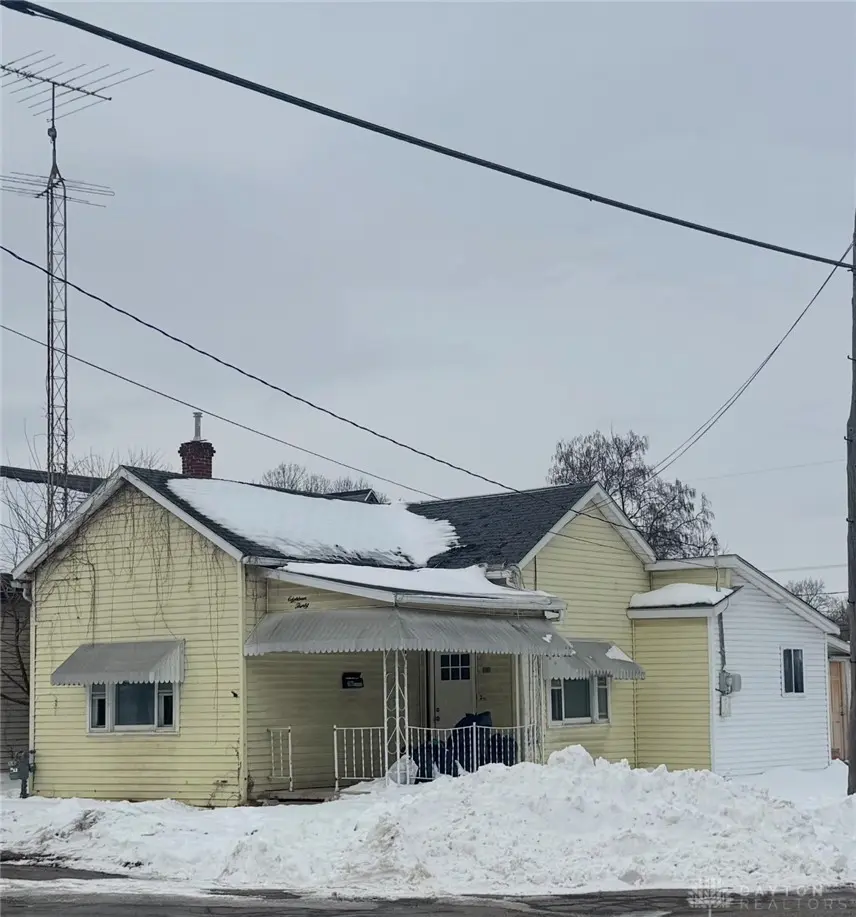
1830 Edwards Ave · Springfield, OH
Flood risk 1/10 · Minimal
- FEMA flood zone
- X (unshaded)
- Chance of flooding over 30 yrs
- 0.0%
- Est. flood insurance / yr
- $507 – $1,088
Fire risk 1/10 · Minimal
- Est. fire insurance / yr
- $713 – $1,323
Heat risk 4/10 · Minor
- Hot days now (above 100°F)
- 7 days/yr
- Hot days in 30 yrs
- 18 days/yr
Wind risk 2/10 · Minimal
- Chance of severe wind over 30 yrs
- —
Air-quality risk 3/10 · Minor
- Unhealthy air days now
- 2 days/yr
- Unhealthy air days in 30 yrs
- 3 days/yr
Risk factors via First Street. Map © Google.
Why this score? — see what drove the D+ grade
The composite is a weighted blend of 9 inputs, each scored 0–100. Each bar is that input's sub-score; the figure is the points it added to the 100-point composite (weight × sub-score).
- Cash flow +17.4/30.0
- ARV discount +9.5/15.0
- DSCR +5.4/10.0
- 1% rule +3.4/10.0
- Livability +2.8/5.0
- Rent growth +2.5/5.0
- Condition / age +2.5/5.0
- Schools +1.9/10.0
- Appreciation +0.0/10.0
$120,000
🖨 Deal sheet (PDF) 📄 Offer letter ✓ Due diligence
Listing remarks MLS
Completely renovated! This beautifully updated 3-bedroom, 2-bath home offers modern living with peace of mind thanks to all-new electrical and plumbing systems. The interior has been fully remodeled, featuring brand-new cabinetry, updated finishes, and a clean, contemporary feel throughout. The functional layout provides comfortable living spaces ideal for both everyday living and entertaining. Whether you are a first-time buyer or looking to downsize without sacrificing quality, this home delivers exceptional value with major mechanical updates already completed. Conveniently located near shopping, dining, schools, and commuter routes, this turnkey property is ready for its next owner.
Key facts
- Updated electrical
- Fully remodeled
- Functional layout
Tags
Neighborhood map
What this means for you Summary
Snapshot
- This is a 2-bed/1.0-bath single-family listed at $120k.
Deal economics
- At list price, monthly cash flow is $90 ($1k/yr) — positive.
- The deal already cash-flows at list — no discount required.
- To meet the 1% rule (rent ≥ 1% of price), the offer needs to be $101k (16.0% below list).
- Recommended offer: $101k (16.0% below list) — sets the bar for 1% rule.
- Cap rate 7.2% vs local median 4.7% in Springfield — top-decile yield for the area; either an underpriced asset or a hidden risk that comps aren't pricing in. Stress-test before assuming the spread holds.
Location & tenants
- Location reads 56/100 on livability (#1,108 in OH) — a working-class tenant base; expect higher turnover. Strengths: cost of living A+, housing A+; Watch: crime F, amenities F, commute F.
- Springfield City School District (urban): math 20% / reading 27% proficiency, ranked #616 of 656 in OH (top 94%) — low school quality limits family demand, transient renter base, plan for 1-2y turnover; 75% free/reduced lunch — lower-income household profile, screen leases tightly.
- Zoned schools: Warder Park-Wayne Elementary School (math 13% / reading 22%, grade F, #1,328 of 1,584 statewide, top 84%, 407 students, 0% FRL); Schaefer Middle School (math 20% / reading 27%, grade F, #597 of 654 statewide, top 92%, 268 students, 0% FRL); Springfield High School (math 17% / reading 31%, grade F, #665 of 781 statewide, top 85%, 1,516 students, 0% FRL) — zoned schools average 0% FRL vs 75% district-wide (75 pts lower); this property's tenant base skews higher-income than the district average.
- Market conditions: 144 active listings in the ZIP; 3 comparable units currently listed for rent nearby; rentals leasing fast (median 4d on market — plan ~1-2 weeks tenant-placement turnaround); 232 units permitted in Clark County in 2024 (116 in 5+ unit buildings).
Forward outlook
- Local home prices are declining (-3.0%/yr); year-one equity from $830 of loan paydown is wiped out by about $4k of value loss. Plan a longer hold.
- Clark County population projected at -16% by 2050 — secular population decline; favor cash flow + early exit over multi-decade hold.
Negotiation context
- It's been on market 133 days — a 12% lower offer ($106k) is reasonable based on typical stale-listing flexibility.
- 4 sale attempts since 19y ago with the ask held roughly flat each time — persistent listings suggest the price (not the market) is what's stuck; bring a comps-based counter.
- Current owner paid $97k; 24% above their basis — modest negotiation headroom, anchor on the comps not their cost.
Risks & watch-outs
- Watch-outs: built in 1901 — expect roof / HVAC / electrical / plumbing capex.
Questions for the listing agent
- It's been on market 133 days. Have you received any prior offers? Is the seller open to a 16% concession, seller financing, or rate buy-down credit?
- Built in 1901 — when were the roof, HVAC, electrical panel, plumbing, and water heater last replaced?
- Why hasn't it sold? Are there any deal-killer items the seller is aware of (foundation, flood, title, zoning, code violations)?
- Is there a deadline driving the sale (1031 exchange, divorce, estate, relocation)? That informs how much negotiation room exists.
- Crime grade is F in this area — have there been break-ins, vandalism, or insurance claims at this property in the last 3 years? What carrier currently insures it and at what premium?
- The area grade is low — what's the realistic commute time and amenity access for the typical tenant pool here? Any planned neighborhood developments (good or bad) we should know about?
- What's the average days-on-market for RENTAL listings here right now (not sales)? A rising rental-DOM trend means longer vacancies and softer asking-rent achievability than the comps imply.
- What's the recent tenant-quality profile in this submarket — average credit score on applications, eviction rate, late-payment / NSF rate, and stable-employment percentage? A property-management company in the area should have these aggregated.
- How much new for-sale + rental construction is in the pipeline within 1–3 miles? Heavy new supply typically softens prices + rents 12–24 months out; constrained supply supports both.
Investment metrics
- 1% rule
- 0.84% ✗
- Cap rate
- 7.19%
- Cash-on-cash
- 3.21%
- DSCR
- 1.14
- GRM
- 9.9
CMA / ARV
- ARV (median comp)
- $125,621
- List price
- $120,000
- Delta
- -4.47%
- Verdict
- FAIR
- Comps
- 20 within 1.0 mi
Show comp detail 12 sales within ~0.75 mi
| Address | Dist | Beds/Ba | Sqft | Sold | Price | $/sf | Match |
|---|---|---|---|---|---|---|---|
| 1783 Edwards Ave | 0.09mi | 3/1.5 (+1) | 1,014 (+4%) | 4mo | $225,000 | $222 | 78 |
| 2136 Hillside Ave | 0.45mi | 2/1.0 | 936 (-4%) | 7mo | $75,500 | $81 | 67 |
| 2124 Woodside Ave | 0.33mi | 2/1.0 | 880 (-9%) | 4mo | $159,000 | $181 | 66 |
| 2040 Beatrice St | 0.35mi | 3/1.0 (+1) | 1,008 (+4%) | 8mo | $123,500 | $123 | 65 |
| 419 Bellevue Ave | 0.61mi | 2/1.0 | 936 (-4%) | 3mo | $149,900 | $160 | 63 |
| 2115 Hoppes Ave | 0.29mi | 2/1.0 | 840 (-13%) | 5mo | $144,000 | $171 | 60 |
| 1519 Edgewood Ave | 0.68mi | 3/1.0 (+1) | 980 (+1%) | 3mo | $139,900 | $143 | 59 |
| 515 N Clairmont Ave | 0.51mi | 2/1.5 | 875 (-10%) | 1mo | $175,000 | $200 | 58 |
| 1664 Warder St | 0.66mi | 2/2.0 | 1,015 (+5%) | 3mo | $140,000 | $138 | 55 |
| 1704 Highland Ave | 0.72mi | 2/1.0 | 884 (-9%) | 6mo | $120,000 | $136 | 46 |
| 2514 Hillside Ave | 0.65mi | 2/1.0 | 840 (-13%) | 3mo | $129,000 | $154 | 45 |
| 515 Bellevue Ave | 0.58mi | 3/1.5 (+1) | 840 (-13%) | 4mo | $1,400 | $2 | 40 |
Match score weights: distance 35% · size 25% · config 20% · recency 20%. Top-matched comps best support the ARV.
Projected returns pro-forma
-3.0% appreciation · 3.0% rent growth · sell at horizon
- IRR
- -11.3%
- Equity multiple
- 0.59×
- Total profit
- $-13,784
- Equity at exit
- $17,892
- IRR
- -2.1%
- Equity multiple
- 0.85×
- Total profit
- $-4,879
- Equity at exit
- $10,375
Cash invested: $33,600 (down + closing). Projections, not guarantees.
Landlord ↔ Tenant lean methodology
- Overall (STATE)
- 73 Landlord-Friendly
- State Ohio
- 73 Landlord-Friendly · R+6
- County
- — inherits STATE
- City
- — inherits STATE
ZIP-level market 45503
- Active inventory
- 144
- Price-to-rent
- 9.9×
Monthly cashflow live
- Estimated rent
- $1,008 medium interval (Pro) →
- Mortgage (P&I)
- −$629
- Tax from tax record
- −$27 /mo · $329/yr
- Insurance
- −$50
- HOA
- −$0
- Vacancy / Maint / Mgmt
- −$212
- Net cashflow
- $90
Break-even live
Sensitivity live
| Price | -10% $158 | -5% $124 | +0% $90 | +5% $56 | +10% $22 |
|---|---|---|---|---|---|
| Rent | -10% $10 | -5% $50 | +0% $90 | +5% $130 | +10% $169 |
| Rate | -1.0pp $150 | -0.5pp $120 | base $90 | +0.5pp $59 | +1.0pp $27 |
UW: 25.0% down · 7.5% · 30yr · 1.5% tax · 5.0% vac · 8.0% maint · 8.0% mgmt
Financing live
Cash to close
- Down payment
- $30,000
- Closing costs
- $3,600
- Reserves months
- —
- Total cash needed
- —
Loan-product check · same deal, 3 products live
Conventional
25% down · 7.5% · 30yr
- Down + closing
- —
- Monthly P&I
- —
- Monthly cashflow
- —
- DSCR
- —
- Eligible?
- —
Personal DTI + credit; lowest rate.
DSCR
20% down · 8.5% · 30yr
- Down + closing
- —
- Monthly P&I
- —
- Monthly cashflow
- —
- DSCR
- —
- Eligible?
- —
No personal income docs; deal must DSCR.
Hard money
10% down · 12.0% · 12mo
- Down + closing
- —
- Monthly P&I
- —
- Monthly cashflow
- —
- DSCR
- —
- Eligible?
- —
Short-term bridge; refi at stabilization.
Rent comps 3 comps
| Address | Beds | Baths | Sqft | Rent | $/sqft | DOM | Units | Dist |
|---|---|---|---|---|---|---|---|---|
| 127 N Belmont Ave Unit 1 Springfield, OH | 2.0 | 1.0 | 1052 | $1,050 | $1.00 | 3d | 1 | 0.70mi |
| 509 E Northern Ave Unit 511 Springfield, OH | 3.0 | 1.0 | 995 | $995 | $1.00 | 3d | 1 | 1.10mi |
| 515 Ludlow Ave Springfield, OH | 3.0 | 1.0 | 1000 | $950 | $0.95 | 45d | 1 | 1.32mi |
Listing history 24 events
-
2026-06-19days on market $120,000 Active 133 DOM
-
2026-06-18days on market $120,000 Active 132 DOM
-
2026-06-17days on market $120,000 Active 131 DOM
-
2026-06-16days on market $120,000 Active 130 DOM
-
2026-06-15days on market $120,000 Active 129 DOM
-
2026-06-14days on market $120,000 Active 127 DOM
-
2026-06-12days on market $120,000 Active 126 DOM
-
2026-06-09days on market $120,000 Active 123 DOM
-
2026-06-08days on market $120,000 Active 122 DOM
-
2026-06-07days on market $120,000 Active 121 DOM
-
2026-06-05days on market $120,000 Active 118 DOM
-
2026-06-02days on market $120,000 Active 116 DOM
-
2026-06-01days on market $120,000 Active 115 DOM
-
2026-05-31days on market $120,000 Active 114 DOM
-
2026-05-30days on market $120,000 Active 113 DOM
-
2026-02-06$120,000 Active 695-char remark
Show marketing remark (695 chars)
Completely renovated! This beautifully updated 3-bedroom, 2-bath home offers modern living with peace of mind thanks to all-new electrical and plumbing systems. The interior has been fully remodeled, featuring brand-new cabinetry, updated finishes, and a clean, contemporary feel throughout. The functional layout provides comfortable living spaces ideal for both everyday living and entertaining. Whether you are a first-time buyer or looking to downsize without sacrificing quality, this home delivers exceptional value with major mechanical updates already completed. Conveniently located near shopping, dining, schools, and commuter routes, this turnkey property is ready for its next owner.
-
2023-12-28soldstatus $97,000
-
2022-01-18soldstatus $40,000 Closed 64-char remark
Show marketing remark (64 chars)
Hot water heater within 5 years old. Furnace within 8 years old.
-
2022-01-10status Pending 64-char remark
Show marketing remark (64 chars)
Hot water heater within 5 years old. Furnace within 8 years old.
-
2022-01-05$38,000 Active 64-char remark
Show marketing remark (64 chars)
Hot water heater within 5 years old. Furnace within 8 years old.
-
2021-07-26historical
-
2021-01-26$43,900
-
2007-10-19historical
-
2007-04-19$47,900
ⓘ Source: listings_history table (triggers on properties + properties_extension) + one-shot
backfill from property_details.listing_events for pre-trigger history.
Tax reassessment forecast OH · Partial reset (capped growth)
- Current annual tax
- $329 · $27/mo
- Projected year-2 tax
- $1,101 · $92/mo
- Expected delta
- +$771/yr (+$64/mo · 234.2%)
ⓘ Screening estimate from a state-policy table — verify with the county assessor before closing.
Climate risk First Street
- Flood 1/10 Low FEMA zone X (unshaded) · 0% chance over 30 yrs
- Wildfire 1/10 Low
- Heat 4/10 Moderate 7 d/yr ≥100°F today · 18 d/yr by 30 yrs out
- Wind 2/10 Low
- Air quality 3/10 Moderate 2 unhealthy d/yr today · 3 by 30 yrs out
Nearby sold comps map
Loading sold comps map…
Walkable amenities ~0.75 mi
Loading nearby amenities…
Taxation est. · year 1
- Rental income
- $12,100
- − Mortgage interest
- −$6,722
- − Property taxes
- −$329
- − Insurance
- −$600
- − Repairs & maintenance
- −$968
- − Management
- −$968
- − Depreciation
- −$3,491
- Taxable loss
- −$978
- Est. tax savings @ 24.0%
- +$235
- After-tax cash flow
- $1,313/yr
For passive investors: Depreciation is non-cash, so a rental often shows a tax loss while cash-flowing — sheltering income. Rental losses are passive: they offset passive income freely, and up to $25,000/yr can offset ordinary (W-2) income if you actively participate and your MAGI is under $100k (phasing out to $0 by $150k); unused losses carry forward. On sale, claimed depreciation is recaptured at up to 25%, and gains may owe capital-gains tax (a 1031 exchange can defer both). Figures are a year-1 estimate at your 24.0% rate — not tax advice; consult a CPA.
Schools (NCES district)
- District
- Springfield City School District
- NCES district ID
- 3904481
- Math proficiency
- 20% ▼ -16.00%
- Reading proficiency
- 27% ▼ -12.00%
- Median HH income
- $32,541
- Composite
- 19.12/100
- National rank
- #8834
- State rank
- #616 of 656 in OH
Livability — Springfield
- Score
- 56/100
- State rank
- #1108
- US rank
- #22551
Category grades
Schools grade is shown separately in the Schools card above.
Census & demographics
- Census place
- Springfield, OH
- County
- Clark · 134,280 people
- City population
- 33,261
- Metro
- Springfield, OH
- Population (ZIP)
- 32,673
- Household income
- $54,561
- Rent vs Own
- Severe rent burden
- 4.7
Population outlook (Clark County) Hauer SSP2
- Today (2025)
- 130,703 people
- By 2030
- 126,952 · -2.9%
- By 2040
- 118,344 · -9.5%
- By 2050
- 109,590 · -16.2%
- By 2075
- 89,464 · -31.6%
- By 2100
- 68,810 · -47.4%
Race, ethnicity, and origin ACS 2023
- Neighborhood character
- Predominantly White (84%)
- Race & ethnicity
- White 84% Black 9% Two or more races 5% Hispanic / Latino 2%
- Common ancestry
- Italian 2% Lithuanian 1% Slovak 1%
- Foreign-born
- 2% · Canada
- Languages at home
- 98% English-only · French/Haitian/Cajun 1% Spanish 1%
Political lean MEDSL · Clark
- 2024 margin
- Strong R (+29.5) · D 34.8% · R 64.3%
- 2008→2024 swing
- -27.0pp toward R · 2008: -2.5pp · 2024: -29.5pp
- All cycles
- 2024: R+29.5 2020: R+23.3 2016: R+19.5 2012: R+1.8 2008: R+2.5
Not yet ingested
- Civics
- —
Market trends
- HPI YoY
- ▼ -211.92%
- Current HPI
- 257.5694
- Rent YoY
- —
- Metro
- —
- State GDP YoY
- ▲ 1.98%
- F500 in state
- 48
Industry mix (Fortune 500 HQ in OH)
| Industry | F500 HQs | Revenue |
|---|---|---|
| Insurance | 3 | $145B |
|
||
| Industrial Machinery | 3 | $49B |
|
||
| Financial Services | 3 | $24B |
|
||
| Consumer Goods | 2 | $93B |
|
||
| Aerospace / Defense | 2 | $47B |
|
||
| Utilities | 2 | $33B |
|
||
Price history
+150.5% since first listed9 events — show timeline
- 2026-02-06 Listed $120,000 Dayton MLS
- 2023-12-28 Sold (Public Records) $97,000 Public Records
- 2022-01-18 Sold (MLS) $40,000 WRIST
- 2022-01-10 Pending — WRIST
- 2022-01-05 Listed $38,000 WRIST
- 2021-07-26 Listing Removed — WRIST
- 2021-01-26 Listed $43,900 WRIST
- 2007-10-19 Listing Removed — WRIST
- 2007-04-19 Listed $47,900 WRIST
Property tax history
+4.7%/yrLatest (2025): $329 · +19.2% YoY. Source: county tax records.
Cash-flow waterfall
monthlySold comps — $/sqft
last 12 mo · ≤1 miLoading sold comps…