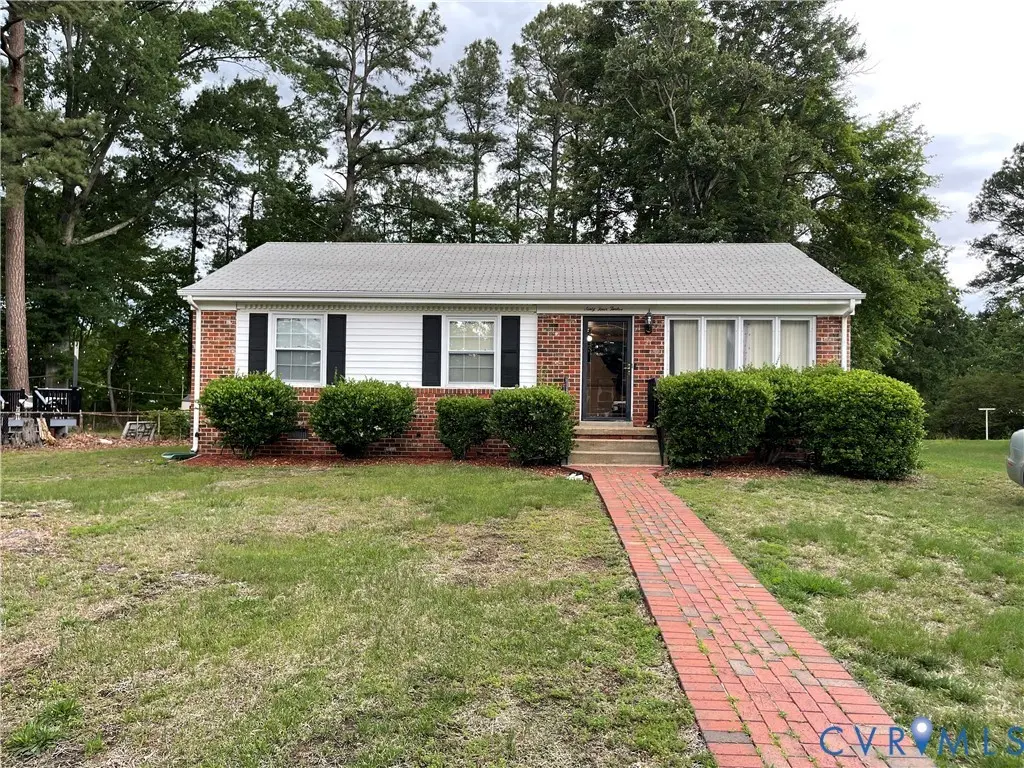
6412 Binns Ave · Richmond, VA
Flood risk 1/10 · Minimal
- FEMA flood zone
- X (unshaded)
- Chance of flooding over 30 yrs
- 0.0%
- Est. flood insurance / yr
- $507 – $1,088
Fire risk 1/10 · Minimal
- Est. fire insurance / yr
- $666 – $1,236
Heat risk 7/10 · Major
- Hot days now (above 105°F)
- 7 days/yr
- Hot days in 30 yrs
- 16 days/yr
Wind risk 6/10 · Moderate
- Chance of severe wind over 30 yrs
- 27.0%
Air-quality risk 2/10 · Minimal
- Unhealthy air days now
- 1 days/yr
- Unhealthy air days in 30 yrs
- 1 days/yr
Risk factors via First Street. Map © Google.
Why this score? — see what drove the B- grade
The composite is a weighted blend of 9 inputs, each scored 0–100. Each bar is that input's sub-score; the figure is the points it added to the 100-point composite (weight × sub-score).
- Cash flow +25.4/30.0
- ARV discount +15.0/15.0
- DSCR +8.4/10.0
- 1% rule +6.1/10.0
- Livability +4.2/5.0
- Schools +3.3/10.0
- Rent growth +2.7/5.0
- Condition / age +2.5/5.0
- Appreciation +0.0/10.0
$179,950
🖨 Deal sheet 📄 Offer letter ✓ Due diligence
Listing remarks
Attention Investors, Flippers, and Cash Buyers! Don't miss this value-add opportunity in Richmond's desirable Area 60 market. This 3-bedroom, 1-bath brick rancher sits on a quiet, established street and offers tremendous upside for renovation and resale or long-term rental income. Featuring a classic brick exterior and a floor plan featuring a spacious eat in kitchen and living room offering plenty of natural light, this property is ready for its next chapter. With renovated homes in the surrounding area selling in the low-to-mid $300s, savvy investors will recognize the potential to add value and maximize returns. Conveniently located near Downtown Richmond, major highways, shopping, dinin
Key facts
- Brick exterior
- Natural light
- Conveniently located
Tags
Property features AI
Exterior
- Parking: Driveway parking; Off-street parking; Unpaved parking
- Utilities: Public water; Public sewer
- Home design: Single-story home; Resale property; R-3 zoning
- Construction: Brick exterior; Drywall interior walls; Wood siding; Composition roof; Built (actual year reported); Crawl space foundation
- Exterior features: Back yard with fencing; Fenced yard; Unpaved driveway
Interior
- Kitchen: Kitchen on the first floor
- Bedrooms: Three bedrooms on the first floor
- Flooring: Laminate flooring; Wood flooring
- Bathrooms: One full bathroom with tub and shower
- Heating & cooling: Heat pump heating; Electric heating; Central air conditioning
- Interior features: Main-level primary bedroom; Bedroom on main level
- Laundry & utility: Electric water heater
Neighborhood map
What this means for you Summary
Snapshot
- This is a 3-bed/1.5-bath single-family listed at $180k.
Deal economics
- At list price, monthly cash flow is $412 ($5k/yr) — positive.
- The deal already cash-flows at list — no discount required.
- Meets the 1% rule at list price ($2k rent vs $180k).
- Cap rate 9.0% vs local median 3.3% in Richmond — top-decile yield for the area; either an underpriced asset or a hidden risk that comps aren't pricing in. Stress-test before assuming the spread holds.
Location & tenants
- Location reads 84/100 on livability (#33 in VA, #793 nationally) — a professional / high-income tenant draw. Strengths: amenities A+, commute A+, health & safety A+; Watch: crime D-.
- Richmond City Public School District (urban): math 32% / reading 47% proficiency, ranked #123 of 131 in VA (top 94%) — families likely to look elsewhere, expect single-tenant / working-renter base with shorter leases; 74% free/reduced lunch — lower-income household profile, screen leases tightly.
- Market conditions: Rents flat; 167 active listings in the ZIP; 19 comparable units currently listed for rent nearby; rentals leasing fast (median 2d on market — plan ~1-2 weeks tenant-placement turnaround); 2,540 units permitted in Richmond city in 2024 (2,077 in 5+ unit buildings).
- This rent runs 38% of the median local income ($63k/yr) — at the standard rent-burdened threshold; future hikes will face affordability resistance.
Forward outlook
- Local home prices are declining (-3.0%/yr); year-one equity from $1k of loan paydown is wiped out by about $5k of value loss. Plan a longer hold.
- Richmond County population projected at +40% by 2050 — long-run rental-demand tailwind backs the buy-and-hold thesis.
Negotiation context
- Only 3 days on market — expect competitive offers; lowballing is unlikely to land.
- Current owner paid $52k; list at $180k implies a 245% gain — meaningful room to come down on a strong offer.
Risks & watch-outs
- Climate carrying-cost: major wind risk, 27% chance of damaging wind over 30y; extreme-heat days projected 7→16/yr by 2055 (HVAC capex compounding) — expect insurance premiums to compound above CPI over the hold.
Questions for the listing agent
- Built in 1967 — when were the roof, HVAC, electrical panel, plumbing, and water heater last replaced?
- Is there a deadline driving the sale (1031 exchange, divorce, estate, relocation)? That informs how much negotiation room exists.
- Schools are A-rated — typically a magnet for longer-tenancy family renters. What's the average tenant stay here, and is there a school-zone premium baked into asking?
- Crime grade is D in this area — have there been break-ins, vandalism, or insurance claims at this property in the last 3 years? What carrier currently insures it and at what premium?
- What's the average days-on-market for RENTAL listings here right now (not sales)? A rising rental-DOM trend means longer vacancies and softer asking-rent achievability than the comps imply.
- What's the recent tenant-quality profile in this submarket — average credit score on applications, eviction rate, late-payment / NSF rate, and stable-employment percentage? A property-management company in the area should have these aggregated.
- How much new for-sale + rental construction is in the pipeline within 1–3 miles? Heavy new supply typically softens prices + rents 12–24 months out; constrained supply supports both.
Investment metrics
- 1% rule
- 1.11% ✓
- Cap rate
- 9.04%
- Cash-on-cash
- 9.81%
- DSCR
- 1.44
- GRM
- 7.5
CMA / ARV
- ARV (on-the-fly)
- $266,064
- Comps found
- 12
Show comp detail 12 sales within ~0.75 mi
| Address | Dist | Beds/Ba | Sqft | Sold | Price | $/sf | Match |
|---|---|---|---|---|---|---|---|
| 6521 Worthington Rd | 0.29mi | 3/1.5 | 1,098 (-0%) | 8mo | $265,000 | $241 | 79 |
| 906 Andros Rd | 0.35mi | 3/1.5 | 1,098 (-0%) | 8mo | $239,700 | $218 | 76 |
| 6607 Holliday Rd | 0.42mi | 3/1.0 | 1,098 (-0%) | 9mo | $264,500 | $241 | 70 |
| 1001 Whitehead Rd | 0.46mi | 3/2.0 | 1,140 (+3%) | 8mo | $175,000 | $154 | 65 |
| 621 Tilton Ct | 0.44mi | 3/1.0 | 1,049 (-5%) | 7mo | $253,800 | $242 | 64 |
| 128 Labrook Dr | 0.68mi | 4/2.0 (+1) | 1,134 (+3%) | 1mo | $325,000 | $287 | 56 |
| 5717 Warwick Rd | 0.68mi | 3/2.0 | 1,154 (+4%) | 4mo | $330,000 | $286 | 56 |
| 6525 Erhart Rd | 0.51mi | 3/1.5 | 1,220 (+10%) | 10mo | $305,000 | $250 | 51 |
| 6411 Daytona Dr | 0.75mi | 3/2.0 | 1,160 (+5%) | 9mo | $310,000 | $267 | 47 |
| 943 Barlen Dr | 0.73mi | 3/1.0 | 984 (-11%) | 5mo | $229,000 | $233 | 42 |
| 1037 Barlen Dr | 0.73mi | 3/1.0 | 984 (-11%) | 11mo | $224,000 | $228 | 36 |
| 5912 Sawston Rd | 0.72mi | 3/1.5 | 960 (-13%) | 12mo | $209,950 | $219 | 35 |
Match score weights: distance 35% · size 25% · config 20% · recency 20%. Top-matched comps best support the ARV.
Projected returns pro-forma
-3.0% appreciation · 0.63% rent growth · sell at horizon
- IRR
- -4.1%
- Equity multiple
- 0.85×
- Total profit
- $-7,598
- Equity at exit
- $26,831
- IRR
- 2.7%
- Equity multiple
- 1.18×
- Total profit
- $8,899
- Equity at exit
- $15,559
Cash invested: $50,386 (down + closing). Projections, not guarantees.
Landlord ↔ Tenant lean methodology
- Overall (STATE)
- 55 Moderately Landlord-Leaning
- State Virginia
- 55 Moderately Landlord-Leaning · D+2
- County
- — inherits STATE
- City
- — inherits STATE
ZIP-level market 23225
- Rents YoY
- 0.6%
- Active inventory
- 167
- Price-to-rent
- 7.5×
Monthly cashflow live
- Estimated rent
- $1,994 high interval (Pro) →
- Mortgage (P&I)
- −$944
- Tax from tax record
- −$145 /mo · $1,740/yr
- Insurance
- −$75
- HOA
- −$0
- Vacancy / Maint / Mgmt
- −$419
- Net cashflow
- $412
Break-even live
UW: 25.0% down · 7.5% · 30yr · 1.5% tax · 5.0% vac · 8.0% maint · 8.0% mgmt
Financing live
Cash to close
- Down payment
- $44,988
- Closing costs
- $5,398
- Reserves months
- —
- Total cash needed
- —
Loan-product check · same deal, 3 products live
Conventional
25% down · 7.5% · 30yr
- Down + closing
- —
- Monthly P&I
- —
- Monthly cashflow
- —
- DSCR
- —
- Eligible?
- —
Personal DTI + credit; lowest rate.
DSCR
20% down · 8.5% · 30yr
- Down + closing
- —
- Monthly P&I
- —
- Monthly cashflow
- —
- DSCR
- —
- Eligible?
- —
No personal income docs; deal must DSCR.
Hard money
10% down · 12.0% · 12mo
- Down + closing
- —
- Monthly P&I
- —
- Monthly cashflow
- —
- DSCR
- —
- Eligible?
- —
Short-term bridge; refi at stabilization.
Rent comps 19 comps
| Address | Beds | Baths | Sqft | Rent | $/sqft | DOM | Units | Dist |
|---|---|---|---|---|---|---|---|---|
| 311 Karl Linn Dr North Chesterfield, VA | 1.0–3.0 | 1.0–3.0 | 1271 | $3,416 | $2.69 | 1d | 21 | 0.70mi |
| 6925 Starview Ct Richmond, VA | 1.0–2.0 | 1.5 | 953 | $1,642 | $1.72 | 2d | 4 | 0.71mi |
| 1018 Barlen Dr Richmond, VA | 3.0 | 1.0 | 935 | $1,700 | $1.82 | 43d | 1 | 0.71mi |
| 6839 Carnation St Richmond, VA | 1.0–3.0 | 1.0–2.0 | 938 | $1,915 | $2.04 | 1d | 21 | 0.74mi |
| 161 Hioaks Rd Richmond, VA | 1.0–3.0 | 1.0–2.0 | 983 | $1,601 | $1.63 | 4d | 7 | 0.78mi |
| 6540 Greenbank Rd Richmond, VA | 1.0–3.0 | 1.0–1.5 | 887 | $1,790 | $2.02 | 1d | 59 | 0.89mi |
| 101 Springline Dr North Chesterfield, VA | 1.0–3.0 | 1.0–2.0 | 981 | $2,825 | $2.88 | 1d | 49 | 0.92mi |
| 435 German School Rd Richmond, VA | 1.0–3.0 | 1.0–2.0 | 956 | $1,744 | $1.82 | 1d | 18 | 0.99mi |
| 1501 Ivymount Rd Richmond, VA | 3.0 | 1.5 | 1084 | $1,750 | $1.61 | 43d | 1 | 1.06mi |
| 1244 Canterbury Ridge Rd Unit 1 Richmond, VA | 3.0 | 2.5 | 1250 | $2,000 | $1.60 | 4d | 1 | 1.08mi |
| 901 Saint John's Wood Dr Richmond, VA | 1.0–3.0 | 1.0–2.0 | 1023 | $1,855 | $1.81 | 1d | 196 | 1.10mi |
| 725 Boulder Springs Dr North Chesterfield, VA | 1.0–3.0 | 1.0–2.0 | 1155 | $2,050 | $1.77 | 1d | 26 | 1.16mi |
| 6901 Marlowe Rd Richmond, VA | 1.0–2.0 | 1.0–2.0 | 722 | $1,953 | $2.70 | 43d | 24 | 1.20mi |
| 6901 Marlowe Rd Richmond, VA | 1.0–2.0 | 1.0–2.0 | 722 | $1,910 | $2.64 | 1d | 51 | 1.20mi |
| 211 Lingstorm Ln Richmond, VA | 1.0–3.0 | 1.0–2.0 | 818 | $1,960 | $2.40 | 1d | 123 | 1.23mi |
| 1188 Grand Brook Dr Unit 1188 Richmond, VA | 3.0 | 2.5 | 1414 | $2,600 | $1.84 | 14d | 1 | 1.35mi |
| 811 Irby Dr Richmond, VA | 3.0 | 1.5 | 1202 | $1,895 | $1.58 | 16d | 1 | 1.40mi |
| 723 Faye St Richmond, VA | 2.0 | 1.0 | 1100 | $1,850 | $1.68 | 43d | 1 | 1.40mi |
| 2336 Sara Ln Richmond, VA | 3.0 | 1.0 | 1120 | $1,695 | $1.51 | 43d | 1 | 1.43mi |
Listing history 4 events
-
2026-06-07statusdays on market $179,950 Pending 3 DOM
-
2026-06-03days on market $179,950 Active 2 DOM
-
2026-06-02remarks 699-char remark
-
2026-06-02$179,950 Active 1 DOM
ⓘ Source: listings_history table (triggers on properties + properties_extension) + one-shot
backfill from property_details.listing_events for pre-trigger history.
Tax reassessment forecast VA · Resets to sale price
- Current annual tax
- $1,740 · $145/mo
- Projected year-2 tax
- $1,740 · $145/mo
- Expected delta
- $0/yr ($0/mo · 0.0%)
ⓘ Screening estimate from a state-policy table — verify with the county assessor before closing.
Climate risk First Street
- Flood 1/10 Low FEMA zone X (unshaded) · 0% chance over 30 yrs
- Wildfire 1/10 Low
- Heat 7/10 Severe 7 d/yr ≥105°F today · 16 d/yr by 30 yrs out
- Wind 6/10 Major 27% chance of damaging wind over 30 yrs
- Air quality 2/10 Low 1 unhealthy d/yr today · 1 by 30 yrs out
Nearby sold comps map
Loading sold comps map…
Walkable amenities ~0.75 mi
Loading nearby amenities…
Taxation est. · year 1
- Rental income
- $23,931
- − Mortgage interest
- −$10,080
- − Property taxes
- −$1,740
- − Insurance
- −$900
- − Repairs & maintenance
- −$1,914
- − Management
- −$1,914
- − Depreciation
- −$5,235
- Taxable income
- $2,147
- Est. tax owed @ 24.0%
- −$515
- After-tax cash flow
- $4,426/yr
For passive investors: Depreciation is non-cash, so a rental often shows a tax loss while cash-flowing — sheltering income. Rental losses are passive: they offset passive income freely, and up to $25,000/yr can offset ordinary (W-2) income if you actively participate and your MAGI is under $100k (phasing out to $0 by $150k); unused losses carry forward. On sale, claimed depreciation is recaptured at up to 25%, and gains may owe capital-gains tax (a 1031 exchange can defer both). Figures are a year-1 estimate at your 24.0% rate — not tax advice; consult a CPA.
Schools (NCES district)
- District
- Richmond City Public School District
- NCES district ID
- 5103240
- Math proficiency
- 32% ▼ -24.00%
- Reading proficiency
- 47% ▼ -9.00%
- Median HH income
- $40,276
- Composite
- 33.09/100
- National rank
- #5564
- State rank
- #123 of 131 in VA
Livability — Richmond
- Score
- 84/100
- State rank
- #33
- US rank
- #793
Category grades
Schools grade is shown separately in the Schools card above.
Census & demographics
- Census place
- Richmond, VA
- County
- Richmond City · 178,280 people
- City population
- 287,109
- Metro
- Richmond, VA
- Population (ZIP)
- 42,771
- Household income
- $62,949
- Rent vs Own
- Severe rent burden
- 2516.0
Population outlook (Richmond County) Hauer SSP2
- Today (2025)
- 262,263 people
- By 2030
- 284,503 · +8.5%
- By 2040
- 327,353 · +24.8%
- By 2050
- 367,946 · +40.3%
- By 2075
- 449,560 · +71.4%
- By 2100
- 500,301 · +90.8%
Race, ethnicity, and origin ACS 2023
- Neighborhood character
- Diverse neighborhood (Simpson 0.66)
- Race & ethnicity
- Black 42% White 38% Hispanic / Latino 14% Two or more races 7% Asian 1%
- Hispanic origin (detail)
- Mexican 2% Puerto Rican 1% Dominican 1%
- Common ancestry
- Slovak 2% Lithuanian 2% Serbian 1%
- Foreign-born
- 9% · Canada
- Languages at home
- 86% English-only · Spanish 11% Other Indo-European 1% Other Asian/Pacific 1%
Political lean MEDSL · Richmond
- 2024 margin
- Solid D (+66.3) · D 82.0% · R 15.8% · Other 2.2%
- 2008→2024 swing
- +7.2pp toward D · 2008: 59.1pp · 2024: 66.3pp
- All cycles
- 2024: D+66.3 2020: D+68.0 2016: D+63.8 2012: D+55.7 2008: D+59.1
Not yet ingested
- Civics
- —
Market trends
- HPI YoY
- ▼ -392.89%
- Current HPI
- 339.408
- Rent YoY
- ▲ 0.63%
- Metro
- Richmond, VA
- State GDP YoY
- ▲ 2.40%
- F500 in state
- 50
Industry mix (Fortune 500 HQ in VA)
| Industry | F500 HQs | Revenue |
|---|---|---|
| Aerospace / Defense | 4 | $236B |
|
||
| Technology / Defense | 3 | $32B |
|
||
| Financial Services | 2 | $176B |
|
||
| Utilities | 2 | $27B |
|
||
| Insurance | 2 | $25B |
|
||
| Technology | 2 | $15B |
|
||
Price history
+225.4% since first listed3 events — show timeline
- 2026-05-31 Listed $179,950 CVRMLS
- 1989-04-20 Sold (Public Records) $52,200 Public Records
- 1988-12-05 Sold (Public Records) $55,300 Public Records
Property tax history
+2.4%/yrLatest (2022): $1,740 · +302.8% YoY. Source: county tax records.
Cash-flow waterfall
monthlySold comps — $/sqft
last 12 mo · ≤1 miLoading sold comps…