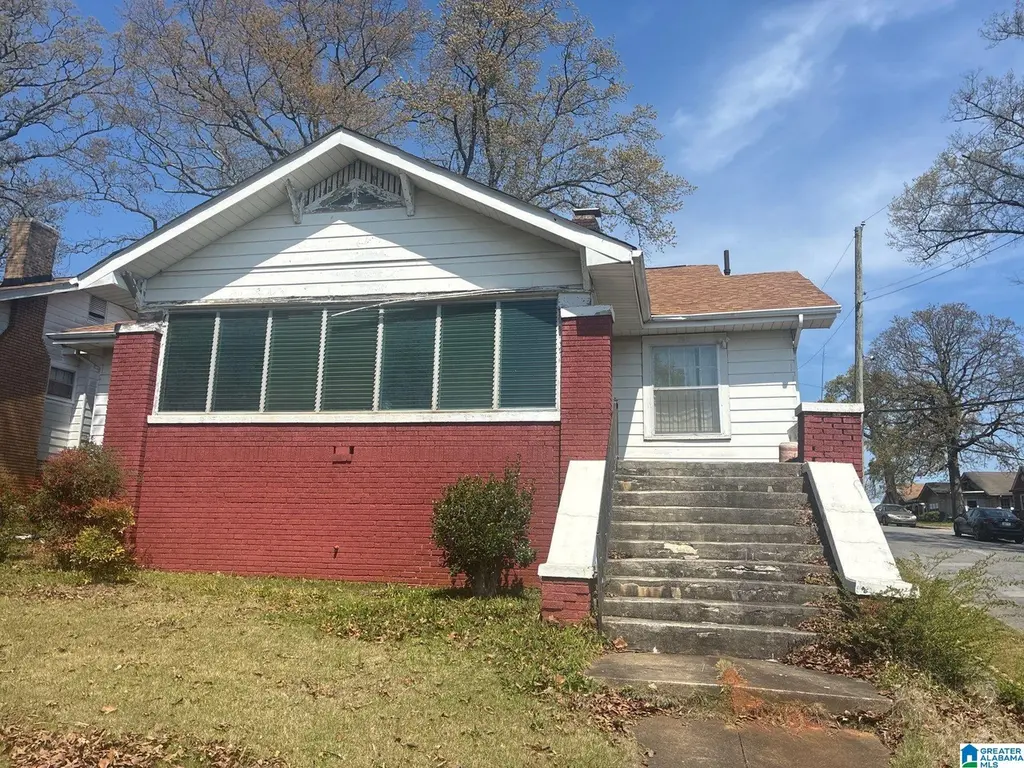
700 8th Ter · Birmingham, AL
Flood risk 1/10 · Minimal
- FEMA flood zone
- X (unshaded)
- Chance of flooding over 30 yrs
- 0.0%
- Est. flood insurance / yr
- $473 – $860
Fire risk 1/10 · Minimal
- Est. fire insurance / yr
- $916 – $1,700
Heat risk 6/10 · Moderate
- Hot days now (above 106°F)
- 7 days/yr
- Hot days in 30 yrs
- 17 days/yr
Wind risk 6/10 · Moderate
- Chance of severe wind over 30 yrs
- 27.0%
Air-quality risk 4/10 · Minor
- Unhealthy air days now
- 6 days/yr
- Unhealthy air days in 30 yrs
- 8 days/yr
Risk factors via First Street. Map © Google.
Why this score? — see what drove the B+ grade
The composite is a weighted blend of 9 inputs, each scored 0–100. Each bar is that input's sub-score; the figure is the points it added to the 100-point composite (weight × sub-score).
- Cash flow +30.0/30.0
- ARV discount +15.0/15.0
- 1% rule +10.0/10.0
- DSCR +10.0/10.0
- Appreciation +5.3/10.0
- Livability +3.4/5.0
- Rent growth +2.5/5.0
- Condition / age +2.5/5.0
- Schools +0.9/10.0
$66,000
🖨 Deal sheet 📄 Offer letter ✓ Due diligence
Listing remarks MLS
Charming 3-bedroom, 1-bath single-family home with a functional kitchen, comfortable bedrooms on a single level, and a generous lot with space for outdoor activities or gardening.
Key facts
- Functional kitchen
- Generous lot
- 7,840 sq ft lot
Tags
Neighborhood map
What this means for you Summary
Snapshot
- This is a 3-bed/1.0-bath single-family listed at $66k.
Deal economics
- At list price, monthly cash flow is $457 ($5k/yr) — positive.
- The deal already cash-flows at list — no discount required.
- Meets the 1% rule at list price ($1k rent vs $66k).
- Recommended offer: $62k (6.0% below list) — sets the bar for market timing.
- Cap rate 14.6% vs local median 6.2% in Birmingham — top-decile yield for the area; either an underpriced asset or a hidden risk that comps aren't pricing in. Stress-test before assuming the spread holds.
Location & tenants
- Location reads 67/100 on livability (#78 in AL) — a middle-class / working-renter tenant base. Strengths: commute A+, cost of living A+, housing A+; Watch: amenities C-, schools F, crime F.
- Birmingham City (urban): math 4% / reading 20% proficiency, ranked #116 of 129 in AL (top 90%) — low school quality limits family demand, transient renter base, plan for 1-2y turnover; 82% free/reduced lunch — lower-income household profile, screen leases tightly.
- Market conditions: 64 active listings in the ZIP; 40 comparable units currently listed for rent nearby; rentals lingering (median 44d on market — plan ~5-8 weeks vacancy on turnover, expect pricing pressure); 65% of comp listings sitting > 30 days — soft ceiling on asking rent; lower-income renter base — watch delinquency; 2,114 units permitted in Jefferson County in 2024 (556 in 5+ unit buildings).
- This rent runs 38% of the median local income ($35k/yr) — at the standard rent-burdened threshold; future hikes will face affordability resistance.
Forward outlook
- In year one you build about $879 of equity ($456 loan paydown + $423 appreciation (0.6% local appreciation)).
- Jefferson County population projected to shrink 4% by 2050 — rents likely to lag national; underwrite the cash flow, not the appreciation.
- At projected returns (0.6% appreciation + 3.0% rent growth), your $18k cash investment doubles in ~3 years — after that, you're playing with house money.
Negotiation context
- It's been on market 88 days — a 6% lower offer ($62k) is reasonable based on typical stale-listing flexibility.
- Current owner paid $31k; list at $66k implies a 113% gain — meaningful room to come down on a strong offer.
Risks & watch-outs
- Watch-outs: built in 1935 — expect roof / HVAC / electrical / plumbing capex.
- Climate carrying-cost: major wind risk, 27% chance of damaging wind over 30y; extreme-heat days projected 7→17/yr by 2055 (HVAC capex compounding) — expect insurance premiums to compound above CPI over the hold.
Questions for the listing agent
- It's been on market 88 days. Have you received any prior offers? Is the seller open to a 6% concession, seller financing, or rate buy-down credit?
- Built in 1935 — when were the roof, HVAC, electrical panel, plumbing, and water heater last replaced?
- Why hasn't it sold? Are there any deal-killer items the seller is aware of (foundation, flood, title, zoning, code violations)?
- Is there a deadline driving the sale (1031 exchange, divorce, estate, relocation)? That informs how much negotiation room exists.
- Schools are F-rated, which usually means shorter tenancies and higher turnover. Who's the typical renter profile here, and what's been the actual vacancy rate?
- Crime grade is F in this area — have there been break-ins, vandalism, or insurance claims at this property in the last 3 years? What carrier currently insures it and at what premium?
- What's the average days-on-market for RENTAL listings here right now (not sales)? A rising rental-DOM trend means longer vacancies and softer asking-rent achievability than the comps imply.
- What's the recent tenant-quality profile in this submarket — average credit score on applications, eviction rate, late-payment / NSF rate, and stable-employment percentage? A property-management company in the area should have these aggregated.
- How much new for-sale + rental construction is in the pipeline within 1–3 miles? Heavy new supply typically softens prices + rents 12–24 months out; constrained supply supports both.
Investment metrics
- 1% rule
- 1.70% ✓
- Cap rate
- 14.61%
- Cash-on-cash
- 29.70%
- DSCR
- 2.32
- GRM
- 4.9
CMA / ARV
- ARV (median comp)
- $116,862
- List price
- $66,000
- Delta
- -43.52%
- Verdict
- UNDERPRICED
- Comps
- 20 within 1.0 mi
Show comp detail 12 sales within ~0.75 mi
| Address | Dist | Beds/Ba | Sqft | Sold | Price | $/sf | Match |
|---|---|---|---|---|---|---|---|
| 704 9th Ct W | 0.20mi | 3/1.0 | 1,502 (+4%) | 1mo | $114,429 | $76 | 83 |
| 882 6th St W | 0.09mi | 3/2.0 | 1,485 (+2%) | 14mo | $147,500 | $99 | 76 |
| 933 6th St W | 0.21mi | 2/2.0 (-1) | 1,392 (-4%) | 0mo | $35,000 | $25 | 74 |
| 867 5th Pl W | 0.15mi | 3/2.0 | 1,300 (-10%) | 0mo | $150,000 | $115 | 72 |
| 1017 7th Pl W | 0.32mi | 3/1.5 | 1,353 (-7%) | 4mo | $147,000 | $109 | 68 |
| 963 3rd St W | 0.47mi | 3/1.0 | 1,444 (-0%) | 12mo | $75,500 | $52 | 68 |
| 622 10th St W | 0.39mi | 3/1.0 | 1,360 (-6%) | 7mo | $85,000 | $63 | 66 |
| 944 4th St W | 0.34mi | 3/2.0 | 1,560 (+8%) | 3mo | $170,000 | $109 | 65 |
| 628 4th Ct W | 0.46mi | 3/1.5 | 1,332 (-8%) | 14mo | $60,000 | $45 | 51 |
| 327 W 11th Ct | 0.61mi | 3/1.0 | 1,288 (-11%) | 6mo | $44,500 | $35 | 48 |
| 900 4th Ave W | 0.58mi | 3/1.5 | 1,232 (-15%) | 7mo | $115,000 | $93 | 40 |
| 1141 Graymont Ave W | 0.57mi | 3/1.0 | 1,266 (-13%) | 16mo | $45,000 | $36 | 39 |
Match score weights: distance 35% · size 25% · config 20% · recency 20%. Top-matched comps best support the ARV.
Projected returns pro-forma
0.64% appreciation · 3.0% rent growth · sell at horizon
- IRR
- 31.4%
- Equity multiple
- 2.58×
- Total profit
- $29,210
- Equity at exit
- $21,307
- IRR
- 34.2%
- Equity multiple
- 5.00×
- Total profit
- $73,938
- Equity at exit
- $27,391
Cash invested: $18,480 (down + closing). Projections, not guarantees.
Landlord ↔ Tenant lean methodology
- Overall (STATE)
- 90 Strongly Landlord-Friendly
- State Alabama
- 90 Strongly Landlord-Friendly · R+15
- County
- — inherits STATE
- City
- — inherits STATE
ZIP-level market 35204
- Home prices YoY
- 0.3%
- Active inventory
- 64
- Price-to-rent
- 4.9×
Monthly cashflow live
- Estimated rent
- $1,121 high interval (Pro) →
- Mortgage (P&I)
- −$346
- Tax from tax record
- −$54 /mo · $652/yr
- Insurance
- −$28
- HOA
- −$0
- Vacancy / Maint / Mgmt
- −$235
- Net cashflow
- $457
Break-even live
UW: 25.0% down · 7.5% · 30yr · 1.5% tax · 5.0% vac · 8.0% maint · 8.0% mgmt
Financing live
Cash to close
- Down payment
- $16,500
- Closing costs
- $1,980
- Reserves months
- —
- Total cash needed
- —
Loan-product check · same deal, 3 products live
Conventional
25% down · 7.5% · 30yr
- Down + closing
- —
- Monthly P&I
- —
- Monthly cashflow
- —
- DSCR
- —
- Eligible?
- —
Personal DTI + credit; lowest rate.
DSCR
20% down · 8.5% · 30yr
- Down + closing
- —
- Monthly P&I
- —
- Monthly cashflow
- —
- DSCR
- —
- Eligible?
- —
No personal income docs; deal must DSCR.
Hard money
10% down · 12.0% · 12mo
- Down + closing
- —
- Monthly P&I
- —
- Monthly cashflow
- —
- DSCR
- —
- Eligible?
- —
Short-term bridge; refi at stabilization.
Rent comps 40 comps
| Address | Beds | Baths | Sqft | Rent | $/sqft | DOM | Units | Dist |
|---|---|---|---|---|---|---|---|---|
| 905 7th St W Birmingham, AL | 3.0 | 2.0 | 1029 | $1,150 | $1.12 | 43d | 1 | 0.10mi |
| 915 6th St W Birmingham, AL | 3.0 | 1.0 | 1332 | $1,075 | $0.81 | 43d | 1 | 0.16mi |
| 854 5th St W Birmingham, AL | 3.0 | 1.0 | 1501 | $1,275 | $0.85 | 43d | 1 | 0.21mi |
| 757 10th Ave W Birmingham, AL | 2.0 | 1.0 | 1136 | $1,000 | $0.88 | 43d | 1 | 0.24mi |
| 410 8th Ter W Birmingham, AL | 3.0 | 1.0 | 1440 | $1,200 | $0.83 | 15d | 1 | 0.24mi |
| 617 7th St W Birmingham, AL | 3.0 | 1.5 | 1120 | $1,175 | $1.05 | 43d | 1 | 0.28mi |
| 827 6th Ave W Birmingham, AL | 3.0 | 1.0 | 1214 | $1,075 | $0.89 | 23d | 1 | 0.35mi |
| 1101 7th Ave W Birmingham, AL | 3.0 | 1.0 | 1248 | $1,250 | $1.00 | 43d | 1 | 0.47mi |
| 963 3rd St W Birmingham, AL | 3.0 | 2.0 | 1444 | $1,295 | $0.90 | 23d | 1 | 0.47mi |
| 624 4th Ct W Birmingham, AL | 3.0 | 1.5 | 992 | $1,250 | $1.26 | 43d | 1 | 0.50mi |
| 724 4th Ct W Birmingham, AL | 3.0 | 1.0 | 1300 | $930 | $0.72 | 43d | 1 | 0.52mi |
| 517 11th Ct W Birmingham, AL | 2.0 | 1.0 | 970 | $795 | $0.82 | 43d | 1 | 0.52mi |
| 612 12th St W Birmingham, AL | 3.0 | 1.5 | 1242 | $1,150 | $0.93 | 43d | 1 | 0.54mi |
| 1119 Graymont Ave W Birmingham, AL | 3.0 | 1.0 | 1260 | $1,073 | $0.85 | 1d | 1 | 0.55mi |
| 1108 4th Ct W Birmingham, AL | 3.0 | 2.0 | 1623 | $1,125 | $0.69 | 2d | 1 | 0.68mi |
| 1230 4th Ter W Birmingham, AL | 3.0 | 2.0 | 1540 | $1,000 | $0.65 | 43d | 1 | 0.75mi |
| 413 Fulton Ave SW Birmingham, AL | 3.0 | 1.0 | 940 | $525 | $0.56 | 2d | 1 | 0.83mi |
| 644 Alabama Ave SW Birmingham, AL | 3.0 | 1.0 | 1274 | $1,125 | $0.88 | 23d | 1 | 0.87mi |
| 608 Fulton Ave SW Birmingham, AL | 3.0 | 1.0 | 1271 | $1,300 | $1.02 | 43d | 1 | 0.88mi |
| 451 2nd St N Birmingham, AL | 4.0 | 3.0 | 1400 | $1,600 | $1.14 | 43d | 1 | 0.94mi |
| 719 Washington Ave SW Birmingham, AL | 3.0 | 1.0 | 1064 | $950 | $0.89 | 11d | 1 | 0.97mi |
| 1642 Graymont Ave W Birmingham, AL | 3.0 | 1.0 | 1219 | $1,090 | $0.89 | 2d | 1 | 1.03mi |
| 1153 2nd St N Birmingham, AL | 3.0 | 1.0 | 1056 | $1,150 | $1.09 | 19d | 1 | 1.04mi |
| 3113 Pike Rd Birmingham, AL | 3.0 | 2.0 | 1143 | $1,275 | $1.12 | 43d | 1 | 1.06mi |
| 405 11th St SW Unit B Birmingham, AL | 2.0 | 1.0 | 1065 | $800 | $0.75 | 43d | 1 | 1.19mi |
| 1621 2nd Ct W Birmingham, AL | 3.0 | 1.0 | 1074 | $1,095 | $1.02 | 43d | 1 | 1.19mi |
| 1216 4th Pl N Birmingham, AL | 3.0 | 2.0 | 1565 | $1,150 | $0.73 | 43d | 1 | 1.22mi |
| 2920 24th Street Ensley Unit ENSLEY Birmingham, AL | 3.0 | 2.0 | 1800 | $1,050 | $0.58 | 23d | 1 | 1.26mi |
| 2309 Eufaula Ave Birmingham, AL | 4.0 | 2.0 | 1454 | $1,395 | $0.96 | 23d | 1 | 1.29mi |
| 1174 16th Avenue Thomas Birmingham, AL | 2.0 | 1.0 | 1000 | $750 | $0.75 | 43d | 1 | 1.29mi |
| 2304 Eufaula Ave Birmingham, AL | 3.0 | 1.0 | 1381 | $980 | $0.71 | 43d | 1 | 1.31mi |
| 1220 Alabama Ave SW Birmingham, AL | 3.0 | 1.5 | 1175 | $1,350 | $1.15 | 43d | 1 | 1.32mi |
| 1720 Cullman Ave Unit 2 Birmingham, AL | 3.0 | 1.0 | 1174 | $899 | $0.77 | 21d | 1 | 1.33mi |
| 1720 Cullman Ave Unit 3 Birmingham, AL | 3.0 | 2.0 | 1174 | $950 | $0.81 | 43d | 1 | 1.33mi |
| 1213 Alabama Ave SW Birmingham, AL | 4.0 | 2.0 | 1616 | $1,200 | $0.74 | 43d | 1 | 1.33mi |
| 451 2nd Ave N Birmingham, AL | 4.0 | 3.0 | 1400 | $1,600 | $1.14 | 23d | 1 | 1.37mi |
| 1012 Cotton Ave SW Birmingham, AL | 3.0 | 1.0 | 1232 | $1,000 | $0.81 | 43d | 1 | 1.38mi |
| 1217 Fulton Ave SW Birmingham, AL | 4.0 | 2.0 | 1397 | $1,395 | $1.00 | 43d | 1 | 1.39mi |
| 1228 Fulton Ave SW Birmingham, AL | 2.0 | 1.0 | 900 | $800 | $0.89 | 44d | 1 | 1.39mi |
| 2661 Bush Blvd Birmingham, AL | 3.0 | 2.0 | 1024 | $1,200 | $1.17 | 43d | 1 | 1.45mi |
Listing history 13 events
-
2026-06-16days on market $66,000 Active 88 DOM
-
2026-06-15days on market $66,000 Active 87 DOM
-
2026-06-13days on market $66,000 Active 85 DOM
-
2026-06-10days on market $66,000 Active 82 DOM
-
2026-06-09days on market $66,000 Active 81 DOM
-
2026-06-08days on market $66,000 Active 80 DOM
-
2026-06-07days on market $66,000 Active 79 DOM
-
2026-06-03days on market $66,000 Active 75 DOM
-
2026-06-02days on market $66,000 Active 74 DOM
-
2026-06-01days on market $66,000 Active 73 DOM
-
2026-05-31days on market $66,000 Active 72 DOM
-
2026-03-18$66,000 Active 179-char remark
Show marketing remark (179 chars)
Charming 3-bedroom, 1-bath single-family home with a functional kitchen, comfortable bedrooms on a single level, and a generous lot with space for outdoor activities or gardening.
-
1988-02-02soldstatus $31,000
ⓘ Source: listings_history table (triggers on properties + properties_extension) + one-shot
backfill from property_details.listing_events for pre-trigger history.
Tax reassessment forecast AL · Resets to sale price
- Current annual tax
- $652 · $54/mo
- Projected year-2 tax
- $652 · $54/mo
- Expected delta
- $0/yr ($0/mo · 0.0%)
ⓘ Screening estimate from a state-policy table — verify with the county assessor before closing.
Climate risk First Street
- Flood 1/10 Low FEMA zone X (unshaded) · 0% chance over 30 yrs
- Wildfire 1/10 Low
- Heat 6/10 Major 7 d/yr ≥106°F today · 17 d/yr by 30 yrs out
- Wind 6/10 Major 27% chance of damaging wind over 30 yrs
- Air quality 4/10 Moderate 6 unhealthy d/yr today · 8 by 30 yrs out
Nearby sold comps map
Loading sold comps map…
Walkable amenities ~0.75 mi
Loading nearby amenities…
Taxation est. · year 1
- Rental income
- $13,447
- − Mortgage interest
- −$3,697
- − Property taxes
- −$652
- − Insurance
- −$330
- − Repairs & maintenance
- −$1,076
- − Management
- −$1,076
- − Depreciation
- −$1,920
- Taxable income
- $4,697
- Est. tax owed @ 24.0%
- −$1,127
- After-tax cash flow
- $4,361/yr
For passive investors: Depreciation is non-cash, so a rental often shows a tax loss while cash-flowing — sheltering income. Rental losses are passive: they offset passive income freely, and up to $25,000/yr can offset ordinary (W-2) income if you actively participate and your MAGI is under $100k (phasing out to $0 by $150k); unused losses carry forward. On sale, claimed depreciation is recaptured at up to 25%, and gains may owe capital-gains tax (a 1031 exchange can defer both). Figures are a year-1 estimate at your 24.0% rate — not tax advice; consult a CPA.
Schools (NCES district)
- District
- Birmingham City
- NCES district ID
- 0100390
- Math proficiency
- 4% ▼ -17.00%
- Reading proficiency
- 20% ▼ -4.00%
- Median HH income
- $31,988
- Composite
- 9.49/100
- National rank
- #9850
- State rank
- #116 of 129 in AL
Livability — Birmingham
- Score
- 67/100
- State rank
- #78
- US rank
- #10412
Category grades
Schools grade is shown separately in the Schools card above.
Census & demographics
- Census place
- Birmingham, AL
- County
- Jefferson County · 527,445 people
- City population
- 210,422
- Metro
- Birmingham-Hoover, AL
- Population (ZIP)
- 8,953
- Household income
- $35,420
- Rent vs Own
- Severe rent burden
- 422.0
Population outlook (Jefferson County) Hauer SSP2
- Today (2025)
- 669,185 people
- By 2030
- 669,694 · +0.1%
- By 2040
- 661,388 · -1.2%
- By 2050
- 643,086 · -3.9%
- By 2075
- 577,267 · -13.7%
- By 2100
- 474,758 · -29.1%
Race, ethnicity, and origin ACS 2023
- Neighborhood character
- Predominantly Black (86%)
- Race & ethnicity
- Black 86% White 7% Hispanic / Latino 5% Two or more races 2%
- Foreign-born
- 3% · Canada
- Languages at home
- 94% English-only · Spanish 5%
Political lean MEDSL · Jefferson
- 2024 margin
- D (+10.4) · D 54.6% · R 44.2% · Other 1.2%
- 2008→2024 swing
- +5.4pp toward D · 2008: 5.1pp · 2024: 10.4pp
- All cycles
- 2024: D+10.4 2020: D+13.2 2016: D+7.2 2012: D+6.0 2008: D+5.1
Not yet ingested
- Civics
- —
Market trends
- HPI YoY
- ▲ 0.64%
- Current HPI
- 201.0777
- Rent YoY
- —
- Metro
- Birmingham-Hoover, AL
- State GDP YoY
- ▲ 2.94%
- F500 in state
- 4
Industry mix (Fortune 500 HQ in AL)
| Industry | F500 HQs | Revenue |
|---|---|---|
| Financial Services | 1 | $8B |
|
||
| Healthcare | 1 | $5B |
|
||
Price history
+112.9% since first listed2 events — show timeline
- 2026-03-18 Listed $66,000 Greater Alabama MLS
- 1988-02-02 Sold (Public Records) $31,000 Public Records
Property tax history
+5.1%/yrLatest (2025): $652 · +0.0% YoY. Source: county tax records.
Cash-flow waterfall
monthlySold comps — $/sqft
last 12 mo · ≤1 miLoading sold comps…