21 Stillman Village Rd · North Pownal, VT
Flood risk 9/10 · Severe
- FEMA flood zone
- X
- Chance of flooding over 30 yrs
- 0.99%
- Est. flood insurance / yr
- $473 – $860
Fire risk 3/10 · Minor
- Est. fire insurance / yr
- $691 – $1,283
Heat risk 2/10 · Minimal
- Hot days now (above 91°F)
- 7 days/yr
- Hot days in 30 yrs
- 17 days/yr
Wind risk 3/10 · Minor
- Chance of severe wind over 30 yrs
- 6.0%
Air-quality risk 2/10 · Minimal
- Unhealthy air days now
- 1 days/yr
- Unhealthy air days in 30 yrs
- 1 days/yr
Risk factors via First Street. Map © Google.
Why this score? — see what drove the C- grade
The composite is a weighted blend of 9 inputs, each scored 0–100. Each bar is that input's sub-score; the figure is the points it added to the 100-point composite (weight × sub-score).
- Cash flow +15.0/30.0
- Appreciation +10.0/10.0
- ARV discount +7.5/15.0
- 1% rule +5.0/10.0
- DSCR +5.0/10.0
- Schools +4.2/10.0
- Rent growth +2.5/5.0
- Livability +2.5/5.0
- Condition / age +2.5/5.0
$35,999
🖨 Deal sheet 📄 Offer letter ✓ Due diligence
Listing remarks MLS
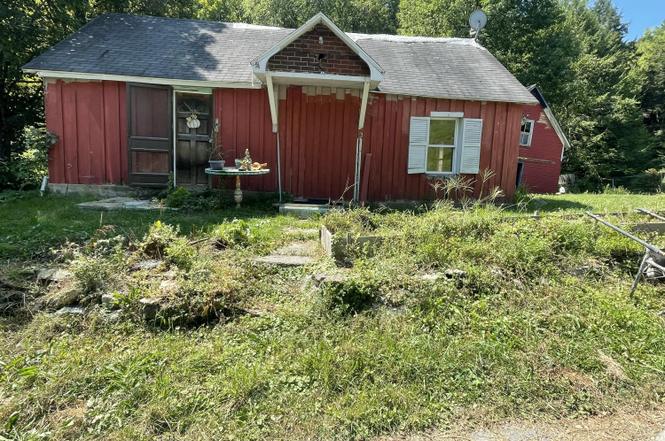
This two bedroom one bath old style home needs total rehab, sold "as is". Poor Condition
Key facts
- Stream flows
- 20 x 16 barn
- 4,791 sq ft lot
Tags
Neighborhood map
What this means for you Summary
Snapshot
- This is a 2-bed/1.0-bath single-family listed at $36k.
Deal economics
- At list price, monthly cash flow is $1k ($13k/yr) — positive.
- The deal already cash-flows at list — no discount required.
- Meets the 1% rule at list price ($2k rent vs $36k).
- Recommended offer: $32k (12.0% below list) — sets the bar for market timing.
Location & tenants
- Location reads: area grade C — affects rentability + tenant quality, not the cash-flow math above.
- Berlin Central School District (rural): math 45% / reading 50% proficiency, ranked #412 of 590 in NY (top 70%) — families likely to look elsewhere, expect single-tenant / working-renter base with shorter leases.
- Market conditions: 405 units permitted in Rensselaer County in 2024 (224 in 5+ unit buildings).
Forward outlook
- In year one you build about $4k of equity ($249 loan paydown + $4k appreciation (10.0% local appreciation)).
- Rensselaer County population projected to shrink 6% by 2050 — rents likely to lag national; underwrite the cash flow, not the appreciation.
- At projected returns (10.0% appreciation + 3.0% rent growth), your $10k cash investment doubles in ~1 year — after that, you're playing with house money.
- By year 8, paydown + projected appreciation supports a ~$34k cash-out refi (75% LTV) — recoverable capital for the next deal without selling this one.
Negotiation context
- It's been on market 175 days — a 12% lower offer ($32k) is reasonable based on typical stale-listing flexibility.
- 2 sale attempts since 19y ago; this cycle's ask has dropped $14k (28%) from the opening price — seller is motivated, your offer sets the floor, not the list.
Risks & watch-outs
- Watch-outs: flood insurance adds $56/mo; built in 1793 — expect roof / HVAC / electrical / plumbing capex.
- Climate carrying-cost: severe flood risk — expect insurance premiums to compound above CPI over the hold.
Questions for the listing agent
- It's been on market 175 days. Have you received any prior offers? Is the seller open to a 12% concession, seller financing, or rate buy-down credit?
- Built in 1793 — when were the roof, HVAC, electrical panel, plumbing, and water heater last replaced?
- What's the actual annual flood-insurance premium (NFIP or private), and is the property in a SFHA with mandatory coverage?
- Why hasn't it sold? Are there any deal-killer items the seller is aware of (foundation, flood, title, zoning, code violations)?
- Is there a deadline driving the sale (1031 exchange, divorce, estate, relocation)? That informs how much negotiation room exists.
- What's the average days-on-market for RENTAL listings here right now (not sales)? A rising rental-DOM trend means longer vacancies and softer asking-rent achievability than the comps imply.
- What's the recent tenant-quality profile in this submarket — average credit score on applications, eviction rate, late-payment / NSF rate, and stable-employment percentage? A property-management company in the area should have these aggregated.
- How much new for-sale + rental construction is in the pipeline within 1–3 miles? Heavy new supply typically softens prices + rents 12–24 months out; constrained supply supports both.
Investment metrics
- 1% rule
- 4.75% ✓
- Cap rate
- 43.04%
- Cash-on-cash
- 131.24%
- DSCR
- 6.84
- GRM
- 1.8
CMA / ARV
No comps found within radius.
Projected returns pro-forma
10.0% appreciation · 3.0% rent growth · sell at horizon
- IRR
- —
- Equity multiple
- 9.57×
- Total profit
- $86,341
- Equity at exit
- $32,431
- IRR
- —
- Equity multiple
- 21.03×
- Total profit
- $201,946
- Equity at exit
- $69,938
Cash invested: $10,080 (down + closing). Projections, not guarantees.
Landlord ↔ Tenant lean methodology
- Overall (STATE)
- 41 Moderately Tenant-Leaning
- State Vermont
- 41 Moderately Tenant-Leaning · D+15
- County
- — inherits STATE
- City
- — inherits STATE
ZIP-level market 12138
- Home prices YoY
- 9.0%
- Price-to-rent
- 1.8×
Monthly cashflow live
- Estimated rent
- $1,710 medium interval (Pro) →
- Mortgage (P&I)
- −$189
- Tax est. 1.5%
- −$45 /mo · $540/yr
- Insurance
- −$15
- Flood insurance flood zone
- −$56 /mo · $666/yr
- HOA
- −$0
- Vacancy / Maint / Mgmt
- −$359
- Net cashflow
- $1,047
Break-even live
UW: 25.0% down · 7.5% · 30yr · 1.5% tax · 5.0% vac · 8.0% maint · 8.0% mgmt
Financing live
Cash to close
- Down payment
- $9,000
- Closing costs
- $1,080
- Reserves months
- —
- Total cash needed
- —
Loan-product check · same deal, 3 products live
Conventional
25% down · 7.5% · 30yr
- Down + closing
- —
- Monthly P&I
- —
- Monthly cashflow
- —
- DSCR
- —
- Eligible?
- —
Personal DTI + credit; lowest rate.
DSCR
20% down · 8.5% · 30yr
- Down + closing
- —
- Monthly P&I
- —
- Monthly cashflow
- —
- DSCR
- —
- Eligible?
- —
No personal income docs; deal must DSCR.
Hard money
10% down · 12.0% · 12mo
- Down + closing
- —
- Monthly P&I
- —
- Monthly cashflow
- —
- DSCR
- —
- Eligible?
- —
Short-term bridge; refi at stabilization.
Listing history 10 events
-
2026-04-16soldstatus $33,000
-
2026-02-05status Pending
-
2026-01-16price $35,999
-
2025-09-26price $40,000
-
2025-09-04price $46,999
-
2025-08-15$50,000 Active
-
2007-10-12soldstatus $10,100 98-char remark
Show marketing remark (98 chars)
This two bedroom one bath old style home needs total rehab, sold "as is". Poor Condition
-
2007-07-09historical 98-char remark
Show marketing remark (98 chars)
This two bedroom one bath old style home needs total rehab, sold "as is". Poor Condition
-
2007-06-07$14,900 98-char remark
Show marketing remark (98 chars)
This two bedroom one bath old style home needs total rehab, sold "as is". Poor Condition
-
2005-10-28soldstatus $47,940
ⓘ Source: listings_history table (triggers on properties + properties_extension) + one-shot
backfill from property_details.listing_events for pre-trigger history.
Climate risk First Street
- Flood 9/10 Extreme FEMA zone X · 99% chance over 30 yrs
- Wildfire 3/10 Moderate
- Heat 2/10 Low 7 d/yr ≥91°F today · 17 d/yr by 30 yrs out
- Wind 3/10 Moderate 6% chance of damaging wind over 30 yrs
- Air quality 2/10 Low 1 unhealthy d/yr today · 1 by 30 yrs out
Nearby sold comps map
Loading sold comps map…
Walkable amenities ~0.75 mi
Loading nearby amenities…
Taxation est. · year 1
- Rental income
- $20,524
- − Mortgage interest
- −$2,017
- − Property taxes
- −$540
- − Insurance
- −$846
- − Repairs & maintenance
- −$1,642
- − Management
- −$1,642
- − Depreciation
- −$1,047
- Taxable income
- $12,790
- Est. tax owed @ 24.0%
- −$3,070
- After-tax cash flow
- $9,493/yr
For passive investors: Depreciation is non-cash, so a rental often shows a tax loss while cash-flowing — sheltering income. Rental losses are passive: they offset passive income freely, and up to $25,000/yr can offset ordinary (W-2) income if you actively participate and your MAGI is under $100k (phasing out to $0 by $150k); unused losses carry forward. On sale, claimed depreciation is recaptured at up to 25%, and gains may owe capital-gains tax (a 1031 exchange can defer both). Figures are a year-1 estimate at your 24.0% rate — not tax advice; consult a CPA.
Schools (NCES district)
- District
- Berlin Central School District
- NCES district ID
- 3604620
- Math proficiency
- 45% ▼ -3.00%
- Reading proficiency
- 50% ▲ 2.00%
- Median HH income
- $58,335
- Composite
- 41.5/100
- National rank
- #3455
- State rank
- #412 of 590 in NY
Livability — North Pownal
No livability data for this city. (Only ~50 U.S. cities are tracked.)
Census & demographics
- Population (ZIP)
- 2,826
Population outlook (Rensselaer County) Hauer SSP2
- Today (2025)
- 162,400 people
- By 2030
- 161,746 · -0.4%
- By 2040
- 158,095 · -2.7%
- By 2050
- 152,966 · -5.8%
- By 2075
- 140,767 · -13.3%
- By 2100
- 124,727 · -23.2%
Race, ethnicity, and origin ACS 2023
- Neighborhood character
- Predominantly White (90%)
- Race & ethnicity
- White 90% Two or more races 6% Hispanic / Latino 5%
- Common ancestry
- Lithuanian 7% Iranian 3% Romanian 3%
- Foreign-born
- 2% · Canada
- Languages at home
- 98% English-only · Spanish 1%
Political lean MEDSL · Rensselaer
- 2024 margin
- Toss-up / Even · D 50.7% · R 49.3%
- 2008→2024 swing
- -8.0pp toward R · 2008: 9.3pp · 2024: 1.4pp
- All cycles
- 2024: D+1.4 2020: D+5.6 2016: R+2.9 2012: D+11.8 2008: D+9.3
Not yet ingested
- Civics
- —
Market trends
- HPI YoY
- ▲ 26.77%
- Current HPI
- 324.5137
- Rent YoY
- —
- Metro
- —
- State GDP YoY
- —
- F500 in state
- 0
Price history
-31.2% since first listed10 events — show timeline
- 2026-04-16 Sold (Public Records) $33,000 Public Records
- 2026-02-05 Pending — Global MLS
- 2026-01-16 Price Changed $35,999 Global MLS
- 2025-09-26 Price Changed $40,000 Global MLS
- 2025-09-04 Price Changed $46,999 Global MLS
- 2025-08-15 Listed $50,000 Global MLS
- 2007-10-12 Sold (MLS) $10,100 Global MLS
- 2007-07-09 Listing Removed — Global MLS
- 2007-06-07 Listed $14,900 Global MLS
- 2005-10-28 Sold (Public Records) $47,940 Public Records
Property tax history
+4.8%/yrLatest (2025): $2,111 · +11.8% YoY. Source: county tax records.
Cash-flow waterfall
monthlySold comps — $/sqft
last 12 mo · ≤1 miLoading sold comps…