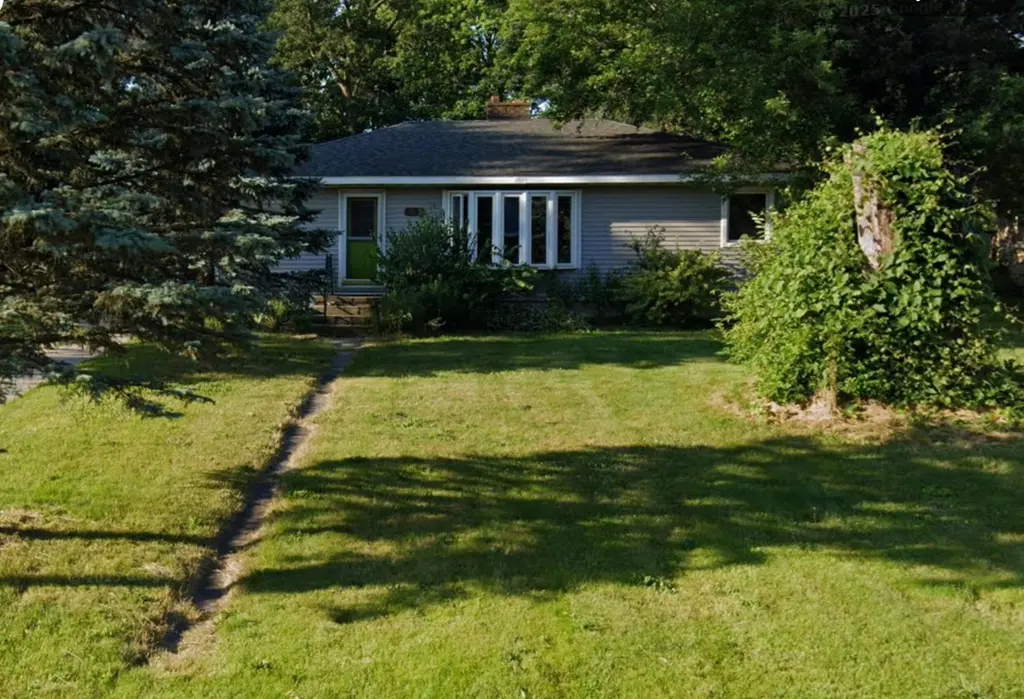
2295 W 41st Ave · Ross, IN
Flood risk 1/10 · Minimal
- FEMA flood zone
- X (unshaded)
- Chance of flooding over 30 yrs
- 0.0%
- Est. flood insurance / yr
- $473 – $860
Fire risk 1/10 · Minimal
- Est. fire insurance / yr
- $717 – $1,331
Heat risk 2/10 · Minimal
- Hot days now (above 102°F)
- 7 days/yr
- Hot days in 30 yrs
- 15 days/yr
Wind risk 2/10 · Minimal
- Chance of severe wind over 30 yrs
- 1.0%
Air-quality risk 3/10 · Minor
- Unhealthy air days now
- 2 days/yr
- Unhealthy air days in 30 yrs
- 3 days/yr
Risk factors via First Street. Map © Google.
Why this score? — see what drove the B grade
The composite is a weighted blend of 9 inputs, each scored 0–100. Each bar is that input's sub-score; the figure is the points it added to the 100-point composite (weight × sub-score).
- Cash flow +30.0/30.0
- ARV discount +15.0/15.0
- DSCR +10.0/10.0
- 1% rule +9.9/10.0
- Rent growth +2.5/5.0
- Livability +2.5/5.0
- Condition / age +2.5/5.0
- Schools +1.3/10.0
- Appreciation +0.0/10.0
$104,500
🖨 Deal sheet 📄 Offer letter ✓ Due diligence
Key facts
- 0.48 acre lot
- 2 garage spots
- Built 1956
Neighborhood map
What this means for you Summary
Snapshot
- This is a 3-bed/1.0-bath single-family listed at $104k.
Deal economics
- At list price, monthly cash flow is $530 ($6k/yr) — positive.
- The deal already cash-flows at list — no discount required.
- Meets the 1% rule at list price ($2k rent vs $104k).
Location & tenants
- Location reads: area grade B — affects rentability + tenant quality, not the cash-flow math above.
- Lake Ridge New Tech Schools (suburban): math 11% / reading 20% proficiency, ranked #287 of 301 in IN (top 95%) — low school quality limits family demand, transient renter base, plan for 1-2y turnover; 79% free/reduced lunch — lower-income household profile, screen leases tightly.
- Market conditions: 102 active listings in the ZIP; 8 comparable units currently listed for rent nearby; rentals leasing fast (median 11d on market — plan ~1-2 weeks tenant-placement turnaround); 1,642 units permitted in Lake County in 2024 (14 in 5+ unit buildings).
- This rent runs 39% of the median local income ($47k/yr) — at the standard rent-burdened threshold; future hikes will face affordability resistance.
Forward outlook
- Local home prices are declining (-3.0%/yr); year-one equity from $722 of loan paydown is wiped out by about $3k of value loss. Plan a longer hold.
- Lake County population projected to shrink 7% by 2050 — rents likely to lag national; underwrite the cash flow, not the appreciation.
- At projected returns (-3.0% appreciation + 3.0% rent growth), your $29k cash investment doubles in ~6 years — after that, you're playing with house money.
Negotiation context
- Only 0 days on market — expect competitive offers; lowballing is unlikely to land.
Risks & watch-outs
- Watch-outs: built in 1956 — expect roof / HVAC / electrical / plumbing capex.
Questions for the listing agent
- Built in 1956 — when were the roof, HVAC, electrical panel, plumbing, and water heater last replaced?
- Is there a deadline driving the sale (1031 exchange, divorce, estate, relocation)? That informs how much negotiation room exists.
- What's the average days-on-market for RENTAL listings here right now (not sales)? A rising rental-DOM trend means longer vacancies and softer asking-rent achievability than the comps imply.
- What's the recent tenant-quality profile in this submarket — average credit score on applications, eviction rate, late-payment / NSF rate, and stable-employment percentage? A property-management company in the area should have these aggregated.
- How much new for-sale + rental construction is in the pipeline within 1–3 miles? Heavy new supply typically softens prices + rents 12–24 months out; constrained supply supports both.
Investment metrics
- 1% rule
- 1.49% ✓
- Cap rate
- 12.37%
- Cash-on-cash
- 21.72%
- DSCR
- 1.97
- GRM
- 5.6
CMA / ARV
- ARV (on-the-fly)
- $179,025
- Comps found
- 9
Show comp detail 9 sales within ~0.75 mi
| Address | Dist | Beds/Ba | Sqft | Sold | Price | $/sf | Match |
|---|---|---|---|---|---|---|---|
| 3964 Marshall St | 0.30mi | 3/1.0 | 1,782 (+4%) | 6mo | $187,000 | $105 | 74 |
| 2345 Ranburn Dr | 0.11mi | 3/2.0 | 1,909 (+12%) | 5mo | $236,950 | $124 | 67 |
| 2120 Crest Rd | 0.25mi | 3/2.0 | 1,612 (-6%) | 23mo | $165,000 | $102 | 56 |
| 3125 W Ridge Rd | 0.58mi | 3/1.0 | 1,698 (-0%) | 20mo | $120,000 | $71 | 56 |
| 3740 Garfield St | 0.58mi | 3/1.0 | 1,560 (-8%) | 10mo | $70,500 | $45 | 51 |
| 4410 Taney St | 0.54mi | 3/2.0 | 1,768 (+4%) | 21mo | $205,000 | $116 | 47 |
| 4441 Marshall St | 0.48mi | 3/2.0 | 1,494 (-12%) | 10mo | $145,000 | $97 | 44 |
| 3230 W 40th Pl | 0.61mi | 4/1.0 (+1) | 1,497 (-12%) | 13mo | $178,600 | $119 | 35 |
| 3031 W 45th Ave | 0.70mi | 2/1.5 (-1) | 1,940 (+14%) | 11mo | $270,000 | $139 | 28 |
Match score weights: distance 35% · size 25% · config 20% · recency 20%. Top-matched comps best support the ARV.
Projected returns pro-forma
-3.0% appreciation · 3.0% rent growth · sell at horizon
- IRR
- 14.4%
- Equity multiple
- 1.57×
- Total profit
- $16,808
- Equity at exit
- $15,581
- IRR
- 23.1%
- Equity multiple
- 2.99×
- Total profit
- $58,106
- Equity at exit
- $9,035
Cash invested: $29,260 (down + closing). Projections, not guarantees.
Landlord ↔ Tenant lean methodology
- Overall (STATE)
- 90 Strongly Landlord-Friendly
- State Indiana
- 90 Strongly Landlord-Friendly · R+11
- County
- — inherits STATE
- City
- — inherits STATE
ZIP-level market 46408
- Home prices YoY
- -31.6%
- Active inventory
- 102
- Price-to-rent
- 5.6×
Monthly cashflow live
- Estimated rent
- $1,554 high interval (Pro) →
- Mortgage (P&I)
- −$548
- Tax from tax record
- −$106 /mo · $1,274/yr
- Insurance
- −$44
- HOA
- −$0
- Vacancy / Maint / Mgmt
- −$326
- Net cashflow
- $530
Break-even live
UW: 25.0% down · 7.5% · 30yr · 1.5% tax · 5.0% vac · 8.0% maint · 8.0% mgmt
Financing live
Cash to close
- Down payment
- $26,125
- Closing costs
- $3,135
- Reserves months
- —
- Total cash needed
- —
Loan-product check · same deal, 3 products live
Conventional
25% down · 7.5% · 30yr
- Down + closing
- —
- Monthly P&I
- —
- Monthly cashflow
- —
- DSCR
- —
- Eligible?
- —
Personal DTI + credit; lowest rate.
DSCR
20% down · 8.5% · 30yr
- Down + closing
- —
- Monthly P&I
- —
- Monthly cashflow
- —
- DSCR
- —
- Eligible?
- —
No personal income docs; deal must DSCR.
Hard money
10% down · 12.0% · 12mo
- Down + closing
- —
- Monthly P&I
- —
- Monthly cashflow
- —
- DSCR
- —
- Eligible?
- —
Short-term bridge; refi at stabilization.
Rent comps 8 comps
| Address | Beds | Baths | Sqft | Rent | $/sqft | DOM | Units | Dist |
|---|---|---|---|---|---|---|---|---|
| 3788 Lincoln St Gary, IN | 3.0 | 2.0 | 1398 | $1,400 | $1.00 | 10d | 1 | 0.75mi |
| 3449 Buchanan St Gary, IN | 3.0 | 1.0 | 1301 | $1,395 | $1.07 | 44d | 1 | 1.10mi |
| 4208 Jackson St Gary, IN | 3.0 | 1.0 | 1411 | $1,350 | $0.96 | 44d | 1 | 1.15mi |
| 5005 Chase St Gary, IN | 3.0 | 2.0 | 1142 | $1,400 | $1.23 | 1d | 1 | 1.21mi |
| 3612 Van Buren St Gary, IN | 3.0 | 1.0 | 1534 | $1,600 | $1.04 | 1d | 1 | 1.23mi |
| 3901 W 47th Ave Gary, IN | 4.0 | 1.0 | 1703 | $1,695 | $1.00 | 15d | 1 | 1.24mi |
| 4767 Harrison St Gary, IN | 3.0 | 1.0 | 1664 | $1,500 | $0.90 | 2d | 1 | 1.35mi |
| 4748 Monroe St Gary, IN | 3.0 | 1.0 | 1074 | $1,695 | $1.58 | 1d | 1 | 1.46mi |
Listing history 1 events
-
2026-06-10$104,500 Pending
ⓘ Source: listings_history table (triggers on properties + properties_extension) + one-shot
backfill from property_details.listing_events for pre-trigger history.
Tax reassessment forecast IN · Partial reset (capped growth)
- Current annual tax
- $1,274 · $106/mo
- Projected year-2 tax
- $1,274 · $106/mo
- Expected delta
- $0/yr ($0/mo · 0.0%)
ⓘ Screening estimate from a state-policy table — verify with the county assessor before closing.
Climate risk First Street
- Flood 1/10 Low FEMA zone X (unshaded) · 0% chance over 30 yrs
- Wildfire 1/10 Low
- Heat 2/10 Low 7 d/yr ≥102°F today · 15 d/yr by 30 yrs out
- Wind 2/10 Low 100% chance of damaging wind over 30 yrs
- Air quality 3/10 Moderate 2 unhealthy d/yr today · 3 by 30 yrs out
Nearby sold comps map
Loading sold comps map…
Walkable amenities ~0.75 mi
Loading nearby amenities…
Taxation est. · year 1
- Rental income
- $18,643
- − Mortgage interest
- −$5,854
- − Property taxes
- −$1,274
- − Insurance
- −$522
- − Repairs & maintenance
- −$1,491
- − Management
- −$1,491
- − Depreciation
- −$3,040
- Taxable income
- $4,970
- Est. tax owed @ 24.0%
- −$1,193
- After-tax cash flow
- $5,163/yr
For passive investors: Depreciation is non-cash, so a rental often shows a tax loss while cash-flowing — sheltering income. Rental losses are passive: they offset passive income freely, and up to $25,000/yr can offset ordinary (W-2) income if you actively participate and your MAGI is under $100k (phasing out to $0 by $150k); unused losses carry forward. On sale, claimed depreciation is recaptured at up to 25%, and gains may owe capital-gains tax (a 1031 exchange can defer both). Figures are a year-1 estimate at your 24.0% rate — not tax advice; consult a CPA.
Schools (NCES district)
- District
- Lake Ridge New Tech Schools
- NCES district ID
- 1805460
- Math proficiency
- 11% ▼ -18.00%
- Reading proficiency
- 20% ▼ -9.00%
- Median HH income
- $34,568
- Composite
- 12.67/100
- National rank
- #9607
- State rank
- #287 of 301 in IN
Livability — Ross
No livability data for this city. (Only ~50 U.S. cities are tracked.)
Census & demographics
- Census place
- Ross, IN
- County
- Lake County · 422,878 people
- City population
- 15,571
- Metro
- Chicago-Naperville-Elgin, IL-IN-WI
- Population (ZIP)
- 15,747
- Household income
- $47,453
- Rent vs Own
- Severe rent burden
- 619.0
Population outlook (Lake County) Hauer SSP2
- Today (2025)
- 484,026 people
- By 2030
- 478,091 · -1.2%
- By 2040
- 462,974 · -4.3%
- By 2050
- 449,894 · -7.1%
- By 2075
- 436,169 · -9.9%
- By 2100
- 426,607 · -11.9%
Race, ethnicity, and origin ACS 2023
- Neighborhood character
- Diverse neighborhood (Simpson 0.68)
- Race & ethnicity
- Black 41% White 32% Hispanic / Latino 22% Two or more races 12%
- Hispanic origin (detail)
- Mexican 14% Puerto Rican 7%
- Common ancestry
- Romanian 5% Iranian 1% Slovak 1%
- Foreign-born
- 4% · Canada, China
- Languages at home
- 87% English-only · Spanish 12% Chinese 1%
Political lean MEDSL · Lake
- 2024 margin
- Lean D (+5.6) · D 52.1% · R 46.5% · Other 1.5%
- 2008→2024 swing
- -28.6pp toward R · 2008: 34.3pp · 2024: 5.6pp
- All cycles
- 2024: D+5.6 2020: D+15.1 2016: D+20.6 2012: D+31.0 2008: D+34.3
Not yet ingested
- Civics
- —
Market trends
- HPI YoY
- ▼ -72.08%
- Current HPI
- 155.6238
- Rent YoY
- —
- Metro
- Chicago-Naperville-Elgin, IL-IN-WI
- State GDP YoY
- ▲ 2.90%
- F500 in state
- 18
Industry mix (Fortune 500 HQ in IN)
| Industry | F500 HQs | Revenue |
|---|---|---|
| Industrial Machinery | 2 | $37B |
|
||
| Healthcare | 1 | $177B |
|
||
| Pharmaceuticals | 1 | $45B |
|
||
| Metals / Steel | 1 | $18B |
|
||
| Agriculture | 1 | $17B |
|
||
| Packaging | 1 | $12B |
|
||
Price history
2 events — show timeline
- 2026-06-09 Listing Removed — NIRA MLS as Distributed by MLS Grid
- 2026-06-08 Listed $104,500 NIRA MLS as Distributed by MLS Grid
Property tax history
+1.0%/yrLatest (2024): $1,274 · +2.7% YoY. Source: county tax records.
Cash-flow waterfall
monthlySold comps — $/sqft
last 12 mo · ≤1 miLoading sold comps…