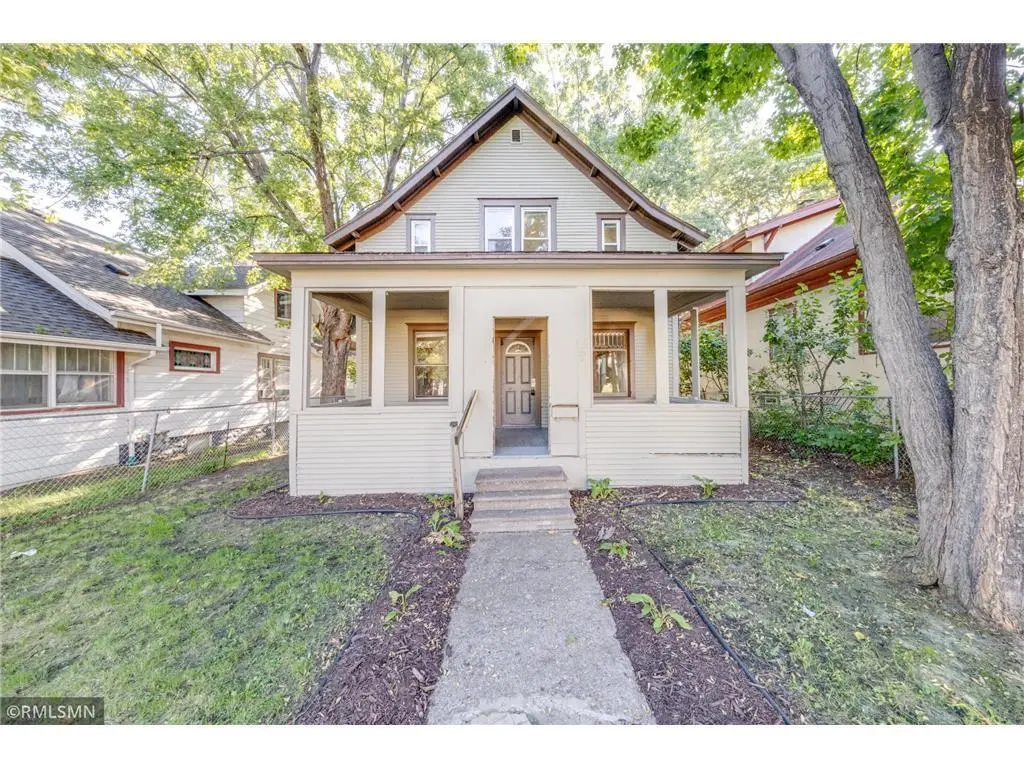
3842 Fremont Ave N · Minneapolis, MN
Flood risk 1/10 · Minimal
- FEMA flood zone
- X (unshaded)
- Chance of flooding over 30 yrs
- 0.0%
- Est. flood insurance / yr
- $473 – $860
Fire risk 1/10 · Minimal
- Est. fire insurance / yr
- $888 – $1,650
Heat risk 2/10 · Minimal
- Hot days now (above 99°F)
- 7 days/yr
- Hot days in 30 yrs
- 14 days/yr
Wind risk 2/10 · Minimal
- Chance of severe wind over 30 yrs
- —
Air-quality risk 2/10 · Minimal
- Unhealthy air days now
- 1 days/yr
- Unhealthy air days in 30 yrs
- 1 days/yr
Risk factors via First Street. Map © Google.
Why this score? — see what drove the C grade
The composite is a weighted blend of 9 inputs, each scored 0–100. Each bar is that input's sub-score; the figure is the points it added to the 100-point composite (weight × sub-score).
- Cash flow +18.1/30.0
- ARV discount +15.0/15.0
- DSCR +5.7/10.0
- 1% rule +4.8/10.0
- Rent growth +4.1/5.0
- Livability +3.9/5.0
- Schools +3.5/10.0
- Condition / age +2.5/5.0
- Appreciation +0.0/10.0
$185,000
🖨 Deal sheet 📄 Offer letter ✓ Due diligence
Listing remarks
This charming home is perfect for investors or first-time buyers! The kitchen has been beautifully updated with new flooring, cabinets, granite countertops, and appliances. The interior will be freshly painted where necessary to give it a bright, welcoming feel, and the refinished hardwood floors add warmth and character. The bathroom got a stylish refresh too! Currently used as a rental, this home is already generating income, making it a smart investment or a great place to start your next chapter. Current lease ends on May 28th, and house will be ready on or before June 10th after repairs. 48 hour notice is required for all showings. Contract for deed accepted with significant down payme
Key facts
- New flooring
- Kitchen updated
- Bathroom refresh
Tags
Property features AI
Finance
- Financial info: Rental license: Standard (rental license active)
Exterior
- Parking: Gravel parking
- Utilities: City water connected; City sewer connected; Natural gas fuel; Electric service with circuit breakers
- Home design: Residential property with two levels; Main entry on main level
- Construction: Asphalt roof; Foundation listed as other with foundation dimensions ~29x24; Above-grade finished area and living area approximately 1,392
- Exterior features: Covered front porch; Glass-enclosed porch; Rear porch; Wood exterior; Chain link fence; Road frontage on a city street; Lot dimensions approximately 127x40
Interior
- Kitchen: Kitchen (14x19); Range; Refrigerator
- Bedrooms: 3 bedrooms (two on upper level, one on main level); Bedroom sizes include 20x10, 12x9, and 9x9
- Bathrooms: 1 full bathroom (upper level)
- Heating & cooling: Forced air heating; No central air
- Interior features: Separate/formal dining room; Full, unfinished basement
- Laundry & utility: Washer and dryer (in basement)
Neighborhood map
What this means for you Summary
Snapshot
- This is a 3-bed/1.5-bath single-family listed at $185k.
Deal economics
- At list price, monthly cash flow is $161 ($2k/yr) — positive.
- The deal already cash-flows at list — no discount required.
- To meet the 1% rule (rent ≥ 1% of price), the offer needs to be $181k (2.3% below list).
- Recommended offer: $181k (2.3% below list) — sets the bar for 1% rule.
- Cap rate 7.3% vs local median 3.1% in Minneapolis — top-decile yield for the area; either an underpriced asset or a hidden risk that comps aren't pricing in. Stress-test before assuming the spread holds.
Location & tenants
- Location reads 78/100 on livability (#110 in MN, #2,525 nationally) — a middle-class / working-renter tenant base. Strengths: amenities A+, commute A+, housing A+; Watch: cost of living C-, crime F.
- Minneapolis Public School District (urban): math 35% / reading 46% proficiency, ranked #217 of 301 in MN (top 72%) — families likely to look elsewhere, expect single-tenant / working-renter base with shorter leases.
- Market conditions: Rents rising fast (+6.3%/yr); 169 active listings in the ZIP; 16 comparable units currently listed for rent nearby; rentals at typical pace (median 22d on market — plan ~3-4 weeks tenant-placement turnaround); 4,651 units permitted in Hennepin County in 2024 (2,443 in 5+ unit buildings).
- This rent runs 32% of the median local income ($69k/yr) — at the standard rent-burdened threshold; future hikes will face affordability resistance.
Forward outlook
- Local home prices are declining (-3.0%/yr); year-one equity from $1k of loan paydown is wiped out by about $6k of value loss. Plan a longer hold.
- Hennepin County population projected at +30% by 2050 — long-run rental-demand tailwind backs the buy-and-hold thesis.
Negotiation context
- It's been on market 28 days — a 2% lower offer ($182k) is reasonable based on typical stale-listing flexibility.
- 14 sale attempts since 33y ago with the ask held roughly flat each time — persistent listings suggest the price (not the market) is what's stuck; bring a comps-based counter.
- Current owner paid $158k; 17% above their basis — modest negotiation headroom, anchor on the comps not their cost.
Risks & watch-outs
- Watch-outs: built in 1912 — expect roof / HVAC / electrical / plumbing capex.
Questions for the listing agent
- Built in 1912 — when were the roof, HVAC, electrical panel, plumbing, and water heater last replaced?
- Is there a deadline driving the sale (1031 exchange, divorce, estate, relocation)? That informs how much negotiation room exists.
- Crime grade is F in this area — have there been break-ins, vandalism, or insurance claims at this property in the last 3 years? What carrier currently insures it and at what premium?
- What's the average days-on-market for RENTAL listings here right now (not sales)? A rising rental-DOM trend means longer vacancies and softer asking-rent achievability than the comps imply.
- What's the recent tenant-quality profile in this submarket — average credit score on applications, eviction rate, late-payment / NSF rate, and stable-employment percentage? A property-management company in the area should have these aggregated.
- How much new for-sale + rental construction is in the pipeline within 1–3 miles? Heavy new supply typically softens prices + rents 12–24 months out; constrained supply supports both.
Investment metrics
- 1% rule
- 0.98% ✗
- Cap rate
- 7.34%
- Cash-on-cash
- 3.73%
- DSCR
- 1.17
- GRM
- 8.5
CMA / ARV
- ARV (median comp)
- $338,960
- List price
- $185,000
- Delta
- -42.47%
- Verdict
- UNDERPRICED
- Comps
- 3 within 2.0 mi
Projected returns pro-forma
-3.0% appreciation · 6.35% rent growth · sell at horizon
- IRR
- -6.8%
- Equity multiple
- 0.74×
- Total profit
- $-13,402
- Equity at exit
- $27,584
- IRR
- 6.6%
- Equity multiple
- 1.57×
- Total profit
- $29,301
- Equity at exit
- $15,995
Cash invested: $51,800 (down + closing). Projections, not guarantees.
Landlord ↔ Tenant lean methodology
- Overall (CITY)
- 34 Tenant-Leaning
- State Minnesota
- 46 Balanced · D+2
- County
- — inherits STATE
- City Minneapolis
- 34 Tenant-Leaning · D+50
ZIP-level market 55412
- Home prices YoY
- -26.9%
- Rents YoY
- 6.3%
- Active inventory
- 169
- Price-to-rent
- 8.5×
Monthly cashflow live
- Estimated rent
- $1,807 high interval (Pro) →
- Mortgage (P&I)
- −$970
- Tax from tax record
- −$219 /mo · $2,632/yr
- Insurance
- −$77
- HOA
- −$0
- Vacancy / Maint / Mgmt
- −$380
- Net cashflow
- $161
Break-even live
UW: 25.0% down · 7.5% · 30yr · 1.5% tax · 5.0% vac · 8.0% maint · 8.0% mgmt
Financing live
Cash to close
- Down payment
- $46,250
- Closing costs
- $5,550
- Reserves months
- —
- Total cash needed
- —
Loan-product check · same deal, 3 products live
Conventional
25% down · 7.5% · 30yr
- Down + closing
- —
- Monthly P&I
- —
- Monthly cashflow
- —
- DSCR
- —
- Eligible?
- —
Personal DTI + credit; lowest rate.
DSCR
20% down · 8.5% · 30yr
- Down + closing
- —
- Monthly P&I
- —
- Monthly cashflow
- —
- DSCR
- —
- Eligible?
- —
No personal income docs; deal must DSCR.
Hard money
10% down · 12.0% · 12mo
- Down + closing
- —
- Monthly P&I
- —
- Monthly cashflow
- —
- DSCR
- —
- Eligible?
- —
Short-term bridge; refi at stabilization.
Rent comps 16 comps
| Address | Beds | Baths | Sqft | Rent | $/sqft | DOM | Units | Dist |
|---|---|---|---|---|---|---|---|---|
| 1315 N Dowling Ave Unit 304 Minneapolis, MN | 2.0 | 1.0 | 900 | $1,450 | $1.61 | 4d | 1 | 0.11mi |
| 4311 Humboldt Ave N Minneapolis, MN | 2.0 | 1.0 | 915 | $1,795 | $1.96 | 43d | 1 | 0.63mi |
| 3315 James Ave N Minneapolis, MN | 4.0 | 1.0 | 1400 | $2,100 | $1.50 | 4d | 1 | 0.72mi |
| 3255 N Logan Ave Unit 2 Minneapolis, MN | 2.0 | 1.0 | 900 | $995 | $1.11 | 17d | 1 | 0.82mi |
| 414 N 33rd Ave Unit 2 Minneapolis, MN | 2.0 | 1.0 | 1246 | $1,600 | $1.28 | 43d | 1 | 0.82mi |
| 3105 N Girard Ave Unit 2 Minneapolis, MN | 4.0 | 1.0 | 1250 | $2,300 | $1.84 | 24d | 1 | 0.88mi |
| 3211 N 6th St Unit 2 Minneapolis, MN | 4.0 | 1.0 | 900 | $1,450 | $1.61 | 24d | 1 | 0.89mi |
| 3114 Morgan Ave N Minneapolis, MN | 4.0 | 2.0 | 1362 | $2,000 | $1.47 | 14d | 1 | 0.96mi |
| 2900 N Colfax Ave Unit 2 Minneapolis, MN | 2.0 | 1.0 | 1200 | $1,345 | $1.12 | 24d | 1 | 1.07mi |
| 2947 Morgan Ave N Minneapolis, MN | 2.0 | 1.0 | 1106 | $1,950 | $1.76 | 14d | 1 | 1.07mi |
| 3001 N 3rd St Apt 1 Minneapolis, MN | 2.0 | 1.0 | 900 | $1,250 | $1.39 | 20d | 1 | 1.12mi |
| 2703 Humboldt Ave N Minneapolis, MN | 3.0 | 1.0 | 1218 | $1,450 | $1.19 | 21d | 1 | 1.19mi |
| 2646 Dupont Ave N Unit 2 Minneapolis, MN | 4.0 | 1.0 | 1514 | $2,245 | $1.48 | 43d | 1 | 1.22mi |
| 318 N 27th Ave #2 Minneapolis, MN | 3.0 | 1.0 | 1200 | $1,800 | $1.50 | 4d | 1 | 1.33mi |
| 318 N 27th Ave #2 Minneapolis, MN | 3.0 | 1.0 | 1200 | $1,800 | $1.50 | 43d | 1 | 1.33mi |
| 2330 N Irving Ave Minneapolis, MN | 2.0 | 1.0 | 1600 | $1,375 | $0.86 | 7d | 1 | 1.49mi |
Listing history 50 events
-
2026-06-18days on market $185,000 Active 28 DOM
-
2026-06-17days on market $185,000 Active 27 DOM
-
2026-06-16days on market $185,000 Active 26 DOM
-
2026-06-15days on market $185,000 Active 25 DOM
-
2026-06-13days on market $185,000 Active 23 DOM
-
2026-06-09days on market $185,000 Active 19 DOM
-
2026-06-08days on market $185,000 Active 18 DOM
-
2026-06-07days on market $185,000 Active 17 DOM
-
2026-06-04days on market $185,000 Active 14 DOM
-
2026-06-03days on market $185,000 Active 13 DOM
-
2026-06-02days on market $185,000 Active 12 DOM
-
2026-06-01days on market $185,000 Active 11 DOM
-
2026-05-31days on market $185,000 Active 10 DOM
-
2026-05-01price $195,000 702-char remark
-
2026-04-09$200,000 Active 702-char remark
-
2026-04-07historical $200,000 702-char remark
-
2025-06-30historical
-
2025-03-29$200,000 Active
-
2025-03-28historical
-
2023-03-08soldstatus $157,500
-
2023-02-23soldstatus $157,500 Sold
-
2023-02-07status Pending
-
2023-01-20price $169,900
-
2023-01-04$174,900 Active
-
2022-12-28historical $174,900
-
2022-12-20historical
-
2022-12-01status Active
-
2022-10-18status Pending
-
2022-09-14price $179,900
-
2022-08-31$189,900 Active
-
2022-04-04historical
-
2022-04-04historical
-
2022-04-04$135,000
-
2013-11-08soldstatus $65,000
-
2012-01-27soldstatus $20,000
-
2012-01-11historical
-
2011-11-21$31,000
-
2011-10-11historical
-
2010-08-05$24,900
-
2005-01-11soldstatus $126,500
-
2004-12-08soldstatus $126,500
-
2004-11-04historical
-
2004-05-19$128,900
-
1997-12-18soldstatus $35,000
-
1997-10-28soldstatus $35,000
-
1997-09-09historical
-
1997-08-20$35,000
-
1996-05-06historical
-
1995-11-06$48,900
-
1994-04-28soldstatus $51,900
ⓘ Source: listings_history table (triggers on properties + properties_extension) + one-shot
backfill from property_details.listing_events for pre-trigger history.
Tax reassessment forecast MN · Partial reset (capped growth)
- Current annual tax
- $2,632 · $219/mo
- Projected year-2 tax
- $2,632 · $219/mo
- Expected delta
- $0/yr ($0/mo · 0.0%)
ⓘ Screening estimate from a state-policy table — verify with the county assessor before closing.
Climate risk First Street
- Flood 1/10 Low FEMA zone X (unshaded) · 0% chance over 30 yrs
- Wildfire 1/10 Low
- Heat 2/10 Low 7 d/yr ≥99°F today · 14 d/yr by 30 yrs out
- Wind 2/10 Low
- Air quality 2/10 Low 1 unhealthy d/yr today · 1 by 30 yrs out
Nearby sold comps map
Loading sold comps map…
Walkable amenities ~0.75 mi
Loading nearby amenities…
Taxation est. · year 1
- Rental income
- $21,686
- − Mortgage interest
- −$10,363
- − Property taxes
- −$2,632
- − Insurance
- −$925
- − Repairs & maintenance
- −$1,735
- − Management
- −$1,735
- − Depreciation
- −$5,382
- Taxable loss
- −$1,085
- Est. tax savings @ 24.0%
- +$260
- After-tax cash flow
- $2,194/yr
For passive investors: Depreciation is non-cash, so a rental often shows a tax loss while cash-flowing — sheltering income. Rental losses are passive: they offset passive income freely, and up to $25,000/yr can offset ordinary (W-2) income if you actively participate and your MAGI is under $100k (phasing out to $0 by $150k); unused losses carry forward. On sale, claimed depreciation is recaptured at up to 25%, and gains may owe capital-gains tax (a 1031 exchange can defer both). Figures are a year-1 estimate at your 24.0% rate — not tax advice; consult a CPA.
Schools (NCES district)
- District
- Minneapolis Public School District
- NCES district ID
- 2721240
- Math proficiency
- 35% ▼ -7.00%
- Reading proficiency
- 46% ▼ -1.00%
- Median HH income
- $50,521
- Composite
- 34.92/100
- National rank
- #5067
- State rank
- #217 of 301 in MN
Livability — Minneapolis
- Score
- 78/100
- State rank
- #110
- US rank
- #2525
Category grades
Schools grade is shown separately in the Schools card above.
Census & demographics
- Census place
- Minneapolis, MN
- County
- Hennepin County · 1,150,272 people
- City population
- 417,555
- Metro
- Minneapolis-St. Paul-Bloomington, MN-WI
- Population (ZIP)
- 24,460
- Household income
- $68,682
- Rent vs Own
- Severe rent burden
- 913.0
Population outlook (Hennepin County) Hauer SSP2
- Today (2025)
- 1,405,227 people
- By 2030
- 1,492,650 · +6.2%
- By 2040
- 1,660,157 · +18.1%
- By 2050
- 1,823,498 · +29.8%
- By 2075
- 2,221,283 · +58.1%
- By 2100
- 2,509,976 · +78.6%
Race, ethnicity, and origin ACS 2023
- Neighborhood character
- Highly diverse neighborhood (Simpson 0.73)
- Race & ethnicity
- White 36% Black 33% Hispanic / Latino 14% Two or more races 12% Asian 8% Native American 1%
- Hispanic origin (detail)
- Mexican 8%
- Common ancestry
- Portuguese 6% Lithuanian 2% Romanian 1%
- Foreign-born
- 12% · Canada
- Languages at home
- 82% English-only · Spanish 9% Other Asian/Pacific 7% Tagalog/Filipino 1%
Political lean MEDSL · Hennepin
- 2024 margin
- Solid D (+42.6) · D 70.2% · R 27.5% · Other 2.3%
- 2008→2024 swing
- +14.0pp toward D · 2008: 28.6pp · 2024: 42.6pp
- All cycles
- 2024: D+42.6 2020: D+43.2 2016: D+35.3 2012: D+27.1 2008: D+28.6
Not yet ingested
- Civics
- —
Market trends
- HPI YoY
- ▼ -109.98%
- Current HPI
- 298.1414
- Rent YoY
- ▲ 6.35%
- Metro
- Minneapolis-St. Paul-Bloomington, MN-WI
- State GDP YoY
- ▲ 2.41%
- F500 in state
- 34
Industry mix (Fortune 500 HQ in MN)
| Industry | F500 HQs | Revenue |
|---|---|---|
| Healthcare | 2 | $407B |
|
||
| Retail | 2 | $150B |
|
||
| Consumer Goods | 2 | $32B |
|
||
| Industrial Machinery | 2 | $6B |
|
||
| Agriculture | 1 | $40B |
|
||
| Healthcare / Medical Devices | 1 | $32B |
|
||
Price history
+270.7% since first listed43 events — show timeline
- 2026-05-21 Listing Removed — NORTHSTARMLS as Distributed by MLS Grid
- 2026-05-21 Listed $185,000 NORTHSTARMLS as Distributed by MLS Grid
- 2026-05-01 Price Changed $195,000 NORTHSTARMLS as Distributed by MLS Grid
- 2026-04-09 Listed $200,000 NORTHSTARMLS as Distributed by MLS Grid
- 2026-04-07 Coming Soon — NORTHSTARMLS as Distributed by MLS Grid
- 2025-06-30 Listing Removed — NORTHSTARMLS as Distributed by MLS Grid
- 2025-03-29 Listed $200,000 NORTHSTARMLS as Distributed by MLS Grid
- 2025-03-28 Coming Soon — NORTHSTARMLS as Distributed by MLS Grid
- 2023-03-08 Sold (Public Records) $157,500 Public Records
- 2023-02-23 Sold (MLS) $157,500 NORTHSTARMLS as Distributed by MLS Grid
- 2023-02-07 Pending — NORTHSTARMLS as Distributed by MLS Grid
- 2023-01-20 Price Changed $169,900 NORTHSTARMLS as Distributed by MLS Grid
- 2023-01-04 Listed $174,900 NORTHSTARMLS as Distributed by MLS Grid
- 2022-12-28 Coming Soon $174,900 NORTHSTARMLS as Distributed by MLS Grid
- 2022-12-20 Listing Removed — NORTHSTARMLS as Distributed by MLS Grid
- 2022-12-01 Relisted — NORTHSTARMLS as Distributed by MLS Grid
- 2022-10-18 Pending — NORTHSTARMLS as Distributed by MLS Grid
- 2022-09-14 Price Changed $179,900 NORTHSTARMLS as Distributed by MLS Grid
- 2022-08-31 Listed $189,900 NORTHSTARMLS as Distributed by MLS Grid
- 2022-04-04 Listing Removed — NORTHSTARMLS as Distributed by MLS Grid
- 2022-04-04 Listing Removed — NORTHSTARMLS as Distributed by MLS Grid
- 2022-04-04 Listed $135,000 NORTHSTARMLS as Distributed by MLS Grid
- 2013-11-08 Sold (Public Records) $65,000 Public Records
- 2012-01-27 Sold (MLS) $20,000 NORTHSTARMLS as Distributed by MLS Grid
- 2012-01-11 Listing Removed — NORTHSTARMLS as Distributed by MLS Grid
- 2011-11-21 Listed $31,000 NORTHSTARMLS as Distributed by MLS Grid
- 2011-10-11 Listing Removed — NORTHSTARMLS as Distributed by MLS Grid
- 2010-08-05 Listed $24,900 NORTHSTARMLS as Distributed by MLS Grid
- 2005-01-11 Sold (Public Records) $126,500 Public Records
- 2004-12-08 Sold (MLS) $126,500 NORTHSTARMLS as Distributed by MLS Grid
- 2004-11-04 Listing Removed — NORTHSTARMLS as Distributed by MLS Grid
- 2004-05-19 Listed $128,900 NORTHSTARMLS as Distributed by MLS Grid
- 1997-12-18 Sold (Public Records) $35,000 Public Records
- 1997-10-28 Sold (MLS) $35,000 NORTHSTARMLS as Distributed by MLS Grid
- 1997-09-09 Listing Removed — NORTHSTARMLS as Distributed by MLS Grid
- 1997-08-20 Listed $35,000 NORTHSTARMLS as Distributed by MLS Grid
- 1996-05-06 Listing Removed — NORTHSTARMLS as Distributed by MLS Grid
- 1995-11-06 Listed $48,900 NORTHSTARMLS as Distributed by MLS Grid
- 1994-04-28 Sold (MLS) $51,900 NORTHSTARMLS as Distributed by MLS Grid
- 1994-03-05 Listing Removed — NORTHSTARMLS as Distributed by MLS Grid
- 1994-03-04 Listed $51,900 NORTHSTARMLS as Distributed by MLS Grid
- 1993-05-21 Sold (MLS) $49,900 NORTHSTARMLS as Distributed by MLS Grid
- 1993-01-21 Listed $49,900 NORTHSTARMLS as Distributed by MLS Grid
Property tax history
-8.9%/yrLatest (2025): $2,632 · +106.7% YoY. Source: county tax records.
Cash-flow waterfall
monthlySold comps — $/sqft
last 12 mo · ≤1 miLoading sold comps…