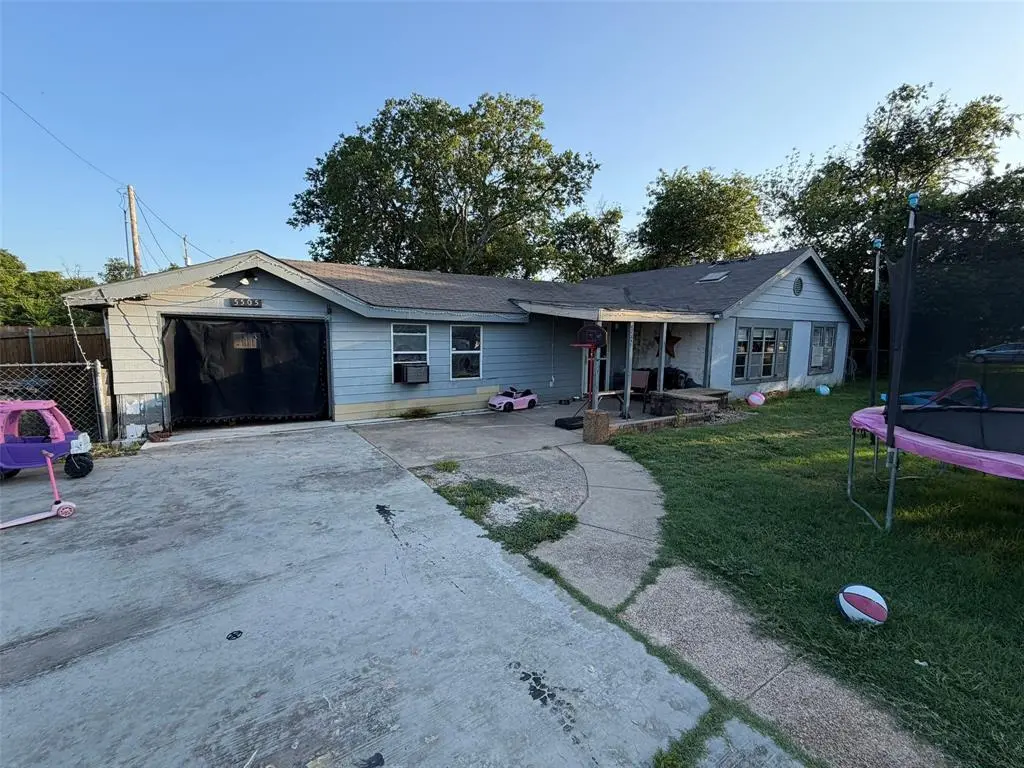
5506 Urbanview St · Sansom Park, TX
Flood risk 1/10 · Minimal
- FEMA flood zone
- X (unshaded)
- Chance of flooding over 30 yrs
- 0.0%
- Est. flood insurance / yr
- $507 – $1,088
Fire risk 4/10 · Minor
- Est. fire insurance / yr
- $1,222 – $2,270
Heat risk 7/10 · Major
- Hot days now (above 109°F)
- 7 days/yr
- Hot days in 30 yrs
- 23 days/yr
Wind risk 4/10 · Minor
- Chance of severe wind over 30 yrs
- 21.0%
Air-quality risk 3/10 · Minor
- Unhealthy air days now
- 3 days/yr
- Unhealthy air days in 30 yrs
- 4 days/yr
Risk factors via First Street. Map © Google.
Why this score? — see what drove the C+ grade
The composite is a weighted blend of 9 inputs, each scored 0–100. Each bar is that input's sub-score; the figure is the points it added to the 100-point composite (weight × sub-score).
- Cash flow +25.4/30.0
- 1% rule +10.0/10.0
- DSCR +8.4/10.0
- ARV discount +7.5/15.0
- Livability +3.5/5.0
- Rent growth +3.0/5.0
- Condition / age +2.5/5.0
- Schools +2.2/10.0
- Appreciation +0.0/10.0
$99,000
🖨 Deal sheet 📄 Offer letter ✓ Due diligence
Listing remarks MLS
Welcome to 5506 Urbanview St, a stunning fully remodeled gem nestled in the heart of Samson Park! This beautifully updated 3-bedroom, 1-bath home offers modern living on a spacious lot—perfect for those who love both style and space. Step inside to an inviting open layout filled with natural light and modern charm. The completely redesigned kitchen features all new quartz countertops, new cabinetry, new stainless steel appliances, and a family style dining area. Luxury vinyl plank flooring runs through the home while carpet accents the bedrooms. The three fresh bedrooms offer comfort and versatility, while the fully renovated bathroom features sleek tile work, a stylish vanity, and a linen closet. Situated on a large lot, the backyard provides endless possibilities—garden, build, entertain, or just enjoy wide-open outdoor space. There’s plenty of room for expansion, a pool, or a workshop. Located just minutes from downtown Fort Worth, Trinity Trails, and major highways, this home blends quiet neighborhood charm with city convenience. Don’t miss the opportunity to own this like-new home on an oversized lot—schedule your private showing today!
Key facts
- 0.32 acre lot
- Garage
- Built 1955
Property features AI
Finance
- Other: Parcel number 02682249
- Financial info: No second mortgage indicated; Listing handled as clear title/loan type treated as clear
- HOA & community: No homeowners association
Exterior
- Parking: Covered parking for 1 vehicle; Attached garage with 1 garage space; Driveway and concrete parking surfaces
- Security: No accessibility features indicated
- Utilities: City water; City sewer; Not in a municipal utility district
- Home design: Single family residence; Residential property; One story; Built in 1955; Not attached to another property
- Construction: Built in 1955
- Exterior features: Lot under half an acre (approx. 0.323 acres); Located in Sansom Park Add subdivision
Interior
- Kitchen: Includes appliances (unspecified/other)
- Bedrooms: Three bedrooms (all on the main level)
- Flooring: No flooring details provided
- Bathrooms: One full bathroom; One half bathroom
- Heating & cooling: No heating or cooling details provided
- Interior features: One-level layout; Five total rooms; One living area; One dining area; No fireplaces
- Laundry & utility: No specific laundry details provided
Neighborhood map
What this means for you Summary
Snapshot
- This is a 3-bed/1.0-bath single-family listed at $99k.
Deal economics
- At list price, monthly cash flow is $229 ($3k/yr) — positive.
- The deal already cash-flows at list — no discount required.
- Meets the 1% rule at list price ($1k rent vs $99k).
Location & tenants
- Location reads 69/100 on livability (#403 in TX) — a middle-class / working-renter tenant base. Strengths: cost of living A+, housing A+, health & safety A+; Watch: employment C-, crime D, amenities F.
- Castleberry ISD (suburban): math 21% / reading 32% proficiency, ranked #701 of 826 in TX (top 85%) — low school quality limits family demand, transient renter base, plan for 1-2y turnover; 72% free/reduced lunch — lower-income household profile, screen leases tightly.
- Zoned schools: Joy James Academy of Leadership (math 22% / reading 32%, grade F, #2,791 of 4,322 statewide, top 68%, 446 students, 89% FRL) — zoned schools average 89% FRL vs 72% district-wide (17 pts higher); higher-poverty schools than district average — tighter screening recommended.
- Market conditions: Rents rising (+1.9%/yr); 153 active listings in the ZIP; 22 comparable units currently listed for rent nearby; rentals at typical pace (median 25d on market — plan ~3-4 weeks tenant-placement turnaround); 18,938 units permitted in Tarrant County in 2024 (8,336 in 5+ unit buildings).
Forward outlook
- Local home prices are declining (-3.0%/yr); year-one equity from $684 of loan paydown is wiped out by about $3k of value loss. Plan a longer hold.
- Tarrant County population projected at +41% by 2050 — long-run rental-demand tailwind backs the buy-and-hold thesis.
Negotiation context
- Only 4 days on market — expect competitive offers; lowballing is unlikely to land.
- 2 sale attempts with the ask held roughly flat each time — persistent listings suggest the price (not the market) is what's stuck; bring a comps-based counter.
Risks & watch-outs
- Watch-outs: property tax is 4.7% of price; built in 1955 — expect roof / HVAC / electrical / plumbing capex.
- Climate carrying-cost: extreme-heat days projected 7→23/yr by 2055 (HVAC capex compounding) — expect insurance premiums to compound above CPI over the hold.
Questions for the listing agent
- Built in 1955 — when were the roof, HVAC, electrical panel, plumbing, and water heater last replaced?
- Property tax is high relative to price — has the assessment been appealed recently, and will the sale trigger a re-assessment?
- Is there a deadline driving the sale (1031 exchange, divorce, estate, relocation)? That informs how much negotiation room exists.
- Schools are F-rated, which usually means shorter tenancies and higher turnover. Who's the typical renter profile here, and what's been the actual vacancy rate?
- Crime grade is D in this area — have there been break-ins, vandalism, or insurance claims at this property in the last 3 years? What carrier currently insures it and at what premium?
- What's the average days-on-market for RENTAL listings here right now (not sales)? A rising rental-DOM trend means longer vacancies and softer asking-rent achievability than the comps imply.
- What's the recent tenant-quality profile in this submarket — average credit score on applications, eviction rate, late-payment / NSF rate, and stable-employment percentage? A property-management company in the area should have these aggregated.
- How much new for-sale + rental construction is in the pipeline within 1–3 miles? Heavy new supply typically softens prices + rents 12–24 months out; constrained supply supports both.
Investment metrics
- 1% rule
- 1.50% ✓
- Cap rate
- 9.07%
- Cash-on-cash
- 9.90%
- DSCR
- 1.44
- GRM
- 5.6
CMA / ARV
- ARV (on-the-fly)
- $205,656
- Comps found
- 12
Show comp detail 12 sales within ~0.75 mi
| Address | Dist | Beds/Ba | Sqft | Sold | Price | $/sf | Match |
|---|---|---|---|---|---|---|---|
| 5506 Urbanview St | 0.00mi | 3/1.0 | 1,038 (+6%) | 7mo | $239,000 | $230 | 85 |
| 5508 Terrace Trl | 0.14mi | 2/1.0 (-1) | 1,020 (+4%) | 6mo | $119,900 | $118 | 78 |
| 5716 Cowden St | 0.44mi | 3/1.0 | 990 (+1%) | 7mo | $159,000 | $161 | 72 |
| 5313 Graham St | 0.51mi | 3/1.0 | 1,026 (+4%) | 4mo | $130,000 | $127 | 66 |
| 5517 Flagstone Dr | 0.12mi | 2/2.0 (-1) | 1,040 (+6%) | 12mo | $209,000 | $201 | 66 |
| 5524 Korth St | 0.53mi | 3/1.0 | 1,022 (+4%) | 12mo | $219,500 | $215 | 59 |
| 4817 Urbanview St | 0.64mi | 3/1.0 | 955 (-3%) | 10mo | $199,900 | $209 | 57 |
| 2220 Andover St | 0.50mi | 2/1.0 (-1) | 1,040 (+6%) | 8mo | $230,000 | $221 | 56 |
| 3319 24th St | 0.69mi | 3/2.0 | 998 (+1%) | 14mo | $234,000 | $234 | 50 |
| 5569 Korth St | 0.47mi | 2/1.0 (-1) | 888 (-10%) | 12mo | $157,500 | $177 | 47 |
| 2421 Arrow Ln | 0.55mi | 2/2.0 (-1) | 1,104 (+12%) | 4mo | $250,000 | $226 | 42 |
| 5804 Isbell St | 0.71mi | 3/2.0 | 847 (-14%) | 10mo | $140,000 | $165 | 31 |
Match score weights: distance 35% · size 25% · config 20% · recency 20%. Top-matched comps best support the ARV.
Projected returns pro-forma
-3.0% appreciation · 1.88% rent growth · sell at horizon
- IRR
- -2.9%
- Equity multiple
- 0.89×
- Total profit
- $-2,949
- Equity at exit
- $14,761
- IRR
- 5.3%
- Equity multiple
- 1.37×
- Total profit
- $10,288
- Equity at exit
- $8,560
Cash invested: $27,720 (down + closing). Projections, not guarantees.
Landlord ↔ Tenant lean methodology
- Overall (STATE)
- 87 Strongly Landlord-Friendly
- State Texas
- 87 Strongly Landlord-Friendly · R+5
- County
- — inherits STATE
- City
- — inherits STATE
ZIP-level market 76114
- Home prices YoY
- -24.3%
- Rents YoY
- 1.9%
- Active inventory
- 153
- Price-to-rent
- 5.6×
Monthly cashflow live
- Estimated rent
- $1,485 high interval (Pro) →
- Mortgage (P&I)
- −$519
- Tax from tax record
- −$384 /mo · $4,613/yr
- Insurance
- −$41
- HOA
- −$0
- Vacancy / Maint / Mgmt
- −$312
- Net cashflow
- $229
Break-even live
UW: 25.0% down · 7.5% · 30yr · 1.5% tax · 5.0% vac · 8.0% maint · 8.0% mgmt
Financing live
Cash to close
- Down payment
- $24,750
- Closing costs
- $2,970
- Reserves months
- —
- Total cash needed
- —
Loan-product check · same deal, 3 products live
Conventional
25% down · 7.5% · 30yr
- Down + closing
- —
- Monthly P&I
- —
- Monthly cashflow
- —
- DSCR
- —
- Eligible?
- —
Personal DTI + credit; lowest rate.
DSCR
20% down · 8.5% · 30yr
- Down + closing
- —
- Monthly P&I
- —
- Monthly cashflow
- —
- DSCR
- —
- Eligible?
- —
No personal income docs; deal must DSCR.
Hard money
10% down · 12.0% · 12mo
- Down + closing
- —
- Monthly P&I
- —
- Monthly cashflow
- —
- DSCR
- —
- Eligible?
- —
Short-term bridge; refi at stabilization.
Rent comps 22 comps
| Address | Beds | Baths | Sqft | Rent | $/sqft | DOM | Units | Dist |
|---|---|---|---|---|---|---|---|---|
| 5217 Calloway St Fort Worth, TX | 3.0 | 2.0 | 964 | $1,375 | $1.43 | 44d | 1 | 0.33mi |
| 5217 Calloway St Unit B Fort Worth, TX | 3.0 | 2.0 | 964 | $1,275 | $1.32 | 44d | 1 | 0.33mi |
| 5217 Calloway St Unit B Fort Worth, TX | 3.0 | 2.0 | 964 | $1,275 | $1.32 | 24d | 1 | 0.33mi |
| 5205 Calloway St Fort Worth, TX | 2.0 | 1.0 | 872 | $1,495 | $1.71 | 44d | 1 | 0.35mi |
| 2762 Beverly Hills Dr Fort Worth, TX | 2.0 | 1.0 | 720 | $1,600 | $2.22 | 24d | 1 | 0.40mi |
| 5201 Azle Ave Unit 01 Fort Worth, TX | 2.0 | 2.0 | 868 | $1,250 | $1.44 | 44d | 1 | 0.59mi |
| 5600 Azle Ave Fort Worth, TX | 1.0–2.0 | 1.0–2.0 | 935 | $1,362 | $1.46 | 21d | 7 | 0.70mi |
| 3665 Marine Creek Pkwy Fort Worth, TX | 1.0–2.0 | 1.0–2.0 | 896 | $1,770 | $1.98 | 2d | 36 | 0.81mi |
| 5712 Azle Ave Unit 2121 Fort Worth, TX | 2.0 | 2.0 | 963 | $1,229 | $1.28 | 3d | 1 | 0.81mi |
| 5712 Azle Ave Unit 5769 Fort Worth, TX | 2.0 | 2.0 | 963 | $1,262 | $1.31 | 44d | 1 | 0.81mi |
| 2213 Capri Dr Unit 212 Fort Worth, TX | 2.0 | 1.0 | 600 | $1,100 | $1.83 | 24d | 1 | 0.86mi |
| 2213 Capri Dr Fort Worth, TX | 2.0 | 1.0 | 600 | $1,150 | $1.92 | 20d | 2 | 0.86mi |
| 2213 Capri Dr Unit 105 Fort Worth, TX | 2.0 | 1.0 | 600 | $1,200 | $2.00 | 24d | 1 | 0.86mi |
| 2213 Capri Dr Fort Worth, TX | 2.0 | 1.0 | 500 | $1,099 | $2.20 | 3d | 4 | 0.86mi |
| 2213 Capri Dr Unit 117 Fort Worth, TX | 2.0 | 1.0 | 600 | $1,100 | $1.83 | 22d | 1 | 0.86mi |
| 2801 NW 19th St Apt B Fort Worth, TX | 2.0 | 1.0 | 672 | $1,495 | $2.22 | 21d | 1 | 1.07mi |
| 2801 NW 19th St Unit 2 Fort Worth, TX | 2.0 | 1.0 | 672 | $1,495 | $2.22 | 13d | 1 | 1.07mi |
| 6303 Shady Oaks Manor Dr Fort Worth, TX | 3.0 | 1.0–2.0 | 931 | $1,605 | $1.72 | 3d | 44 | 1.13mi |
| 3217 NW 29th St Apt 103 Fort Worth, TX | 2.0 | 1.0 | 691 | $1,299 | $1.88 | 24d | 1 | 1.17mi |
| 2701 NW 18th St #2 Fort Worth, TX | 3.0 | 1.5 | 800 | $1,345 | $1.68 | 7d | 1 | 1.18mi |
| 6555 Shady Oaks Manor Dr Fort Worth, TX | 1.0–2.0 | 1.0–2.0 | 689 | $1,401 | $2.03 | 3d | 18 | 1.43mi |
| 2327 Wagner Ave Fort Worth, TX | 2.0 | 1.0 | 725 | $1,050 | $1.45 | 44d | 1 | 1.49mi |
Listing history 4 events
-
2026-06-15days on market $99,000 Active 4 DOM
-
2026-06-13days on market $99,000 Active 2 DOM
-
2026-06-13remarks 181-char remark
-
2026-06-13$99,000 Active 1 DOM
ⓘ Source: listings_history table (triggers on properties + properties_extension) + one-shot
backfill from property_details.listing_events for pre-trigger history.
Tax reassessment forecast TX · Resets to sale price
- Current annual tax
- $4,613 · $384/mo
- Projected year-2 tax
- $4,613 · $384/mo
- Expected delta
- $0/yr ($0/mo · 0.0%)
ⓘ Screening estimate from a state-policy table — verify with the county assessor before closing.
Climate risk First Street
- Flood 1/10 Low FEMA zone X (unshaded) · 0% chance over 30 yrs
- Wildfire 4/10 Moderate
- Heat 7/10 Severe 7 d/yr ≥109°F today · 23 d/yr by 30 yrs out
- Wind 4/10 Moderate 21% chance of damaging wind over 30 yrs
- Air quality 3/10 Moderate 3 unhealthy d/yr today · 4 by 30 yrs out
Nearby sold comps map
Loading sold comps map…
Walkable amenities ~0.75 mi
Loading nearby amenities…
Taxation est. · year 1
- Rental income
- $17,826
- − Mortgage interest
- −$5,546
- − Property taxes
- −$4,613
- − Insurance
- −$495
- − Repairs & maintenance
- −$1,426
- − Management
- −$1,426
- − Depreciation
- −$2,880
- Taxable income
- $1,440
- Est. tax owed @ 24.0%
- −$346
- After-tax cash flow
- $2,399/yr
For passive investors: Depreciation is non-cash, so a rental often shows a tax loss while cash-flowing — sheltering income. Rental losses are passive: they offset passive income freely, and up to $25,000/yr can offset ordinary (W-2) income if you actively participate and your MAGI is under $100k (phasing out to $0 by $150k); unused losses carry forward. On sale, claimed depreciation is recaptured at up to 25%, and gains may owe capital-gains tax (a 1031 exchange can defer both). Figures are a year-1 estimate at your 24.0% rate — not tax advice; consult a CPA.
Schools (NCES district)
- District
- Castleberry ISD
- NCES district ID
- 4813170
- Math proficiency
- 21% ▼ -17.00%
- Reading proficiency
- 32% ▼ -5.00%
- Median HH income
- $39,060
- Composite
- 22.22/100
- National rank
- #8152
- State rank
- #701 of 826 in TX
Livability — Sansom Park
- Score
- 69/100
- State rank
- #403
- US rank
- #8368
Category grades
Schools grade is shown separately in the Schools card above.
Census & demographics
- Census place
- Sansom Park, TX
- County
- Tarrant County · 2,033,669 people
- Metro
- Dallas-Fort Worth-Arlington, TX
- Population (ZIP)
- 27,357
- Household income
- $62,073
- Rent vs Own
- Severe rent burden
- 1095.0
Population outlook (Tarrant County) Hauer SSP2
- Today (2025)
- 2,380,417 people
- By 2030
- 2,578,900 · +8.3%
- By 2040
- 2,974,995 · +25.0%
- By 2050
- 3,350,489 · +40.8%
- By 2075
- 4,216,909 · +77.2%
- By 2100
- 4,741,527 · +99.2%
Race, ethnicity, and origin ACS 2023
- Neighborhood character
- Majority Hispanic (61%)
- Race & ethnicity
- Hispanic / Latino 61% White 35% Two or more races 20% Native American 3% Black 2%
- Hispanic origin (detail)
- Mexican 56%
- Common ancestry
- Slovak 2% Italian 1% Serbian 1%
- Foreign-born
- 17% · Canada
- Languages at home
- 54% English-only · Spanish 45%
Political lean MEDSL · Tarrant
- 2024 margin
- Lean R (+5.1) · D 46.7% · R 51.9% · Other 1.4%
- 2008→2024 swing
- +6.6pp toward D · 2008: -11.7pp · 2024: -5.1pp
- All cycles
- 2024: R+5.1 2020: D+0.2 2016: R+8.7 2012: R+15.7 2008: R+11.7
Not yet ingested
- Civics
- —
Market trends
- HPI YoY
- ▼ -117.88%
- Current HPI
- 366.5263
- Rent YoY
- ▲ 1.88%
- Metro
- Dallas-Fort Worth-Arlington, TX
- State GDP YoY
- ▲ 3.95%
- F500 in state
- 110
Industry mix (Fortune 500 HQ in TX)
| Industry | F500 HQs | Revenue |
|---|---|---|
| Energy | 16 | $1,198B |
|
||
| Technology | 5 | $198B |
|
||
| Engineering / Construction | 4 | $72B |
|
||
| Energy Services | 3 | $60B |
|
||
| Utilities | 3 | $41B |
|
||
| Healthcare | 2 | $330B |
|
||
Price history
-60.4% since first listed7 events — show timeline
- 2026-06-11 Listed $99,000 NTREIS
- 2025-11-17 Sold (Public Records) — Public Records
- 2025-11-14 Sold (MLS) — NTREIS
- 2025-10-26 Pending — NTREIS
- 2025-08-19 Price Changed $239,000 NTREIS
- 2025-06-24 Listed $250,000 NTREIS
- 1993-07-28 Sold (Public Records) — Public Records
Property tax history
+9.2%/yrLatest (2025): $4,613 · +1.9% YoY. Source: county tax records.
Cash-flow waterfall
monthlySold comps — $/sqft
last 12 mo · ≤1 miLoading sold comps…