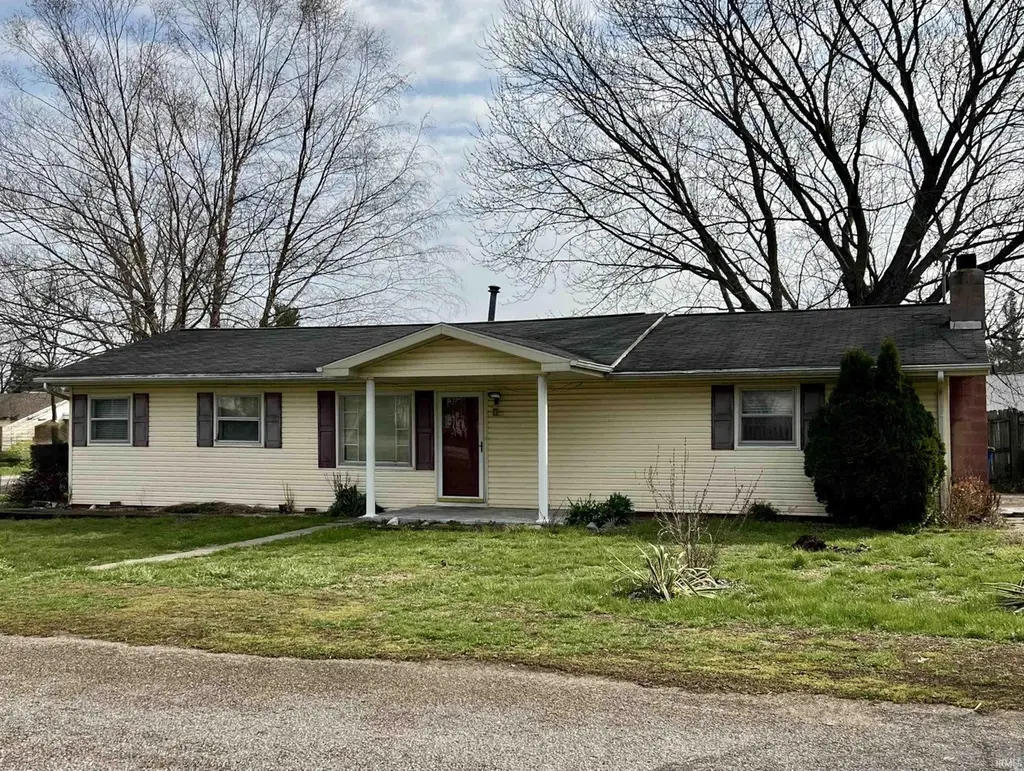
324 W Grissom Ave · Mitchell, IN
Flood risk 1/10 · Minimal
- FEMA flood zone
- X (unshaded)
- Chance of flooding over 30 yrs
- 0.0%
- Est. flood insurance / yr
- $507 – $1,088
Fire risk 1/10 · Minimal
- Est. fire insurance / yr
- $717 – $1,331
Heat risk 4/10 · Minor
- Hot days now (above 105°F)
- 7 days/yr
- Hot days in 30 yrs
- 20 days/yr
Wind risk 2/10 · Minimal
- Chance of severe wind over 30 yrs
- 1.0%
Air-quality risk 2/10 · Minimal
- Unhealthy air days now
- 1 days/yr
- Unhealthy air days in 30 yrs
- 2 days/yr
Risk factors via First Street. Map © Google.
Why this score? — see what drove the A- grade
The composite is a weighted blend of 9 inputs, each scored 0–100. Each bar is that input's sub-score; the figure is the points it added to the 100-point composite (weight × sub-score).
- Cash flow +30.0/30.0
- ARV discount +15.0/15.0
- DSCR +10.0/10.0
- 1% rule +8.6/10.0
- Appreciation +5.3/10.0
- Livability +3.5/5.0
- Schools +2.7/10.0
- Rent growth +2.5/5.0
- Condition / age +2.5/5.0
$99,900
🖨 Deal sheet (PDF) 📄 Offer letter ✓ Due diligence
Listing remarks MLS
Spacious 3 bedroom, 2 bath ranch home on nice corner lot. Open concept living room and dining area. Galley kitchen w/ gas range, refrigerator and microwave. Large family room. Covered front porch. Side patios and rock garden. 24X24 detached garage w/ new OH door. Needs some repairs and updating. Being sold "AS IS"
Key facts
- Covered front porch
- Open concept
- Galley kitchen
Tags
Neighborhood map
What this means for you Summary
Snapshot
- This is a 3-bed/2.0-bath single-family listed at $100k.
Deal economics
- At list price, monthly cash flow is $386 ($5k/yr) — positive.
- The deal already cash-flows at list — no discount required.
- Meets the 1% rule at list price ($1k rent vs $100k).
- Recommended offer: $94k (6.0% below list) — sets the bar for market timing.
- Cap rate 10.9% vs local median 5.0% in Mitchell — top-decile yield for the area; either an underpriced asset or a hidden risk that comps aren't pricing in. Stress-test before assuming the spread holds.
Location & tenants
- Location reads 69/100 on livability (#187 in IN) — a middle-class / working-renter tenant base. Strengths: cost of living A+, housing A+, crime B; Watch: employment D, amenities F, commute F.
- Mitchell Community Schools (town): math 26% / reading 37% proficiency, ranked #230 of 301 in IN (top 76%) — families likely to look elsewhere, expect single-tenant / working-renter base with shorter leases.
- Zoned schools: Hatfield Elementary School (366 students, 66% FRL); Mitchell Jr High School (math 16% / reading 33%, grade F, #251 of 330 statewide, top 77%, 359 students, 61% FRL); Mitchell High School (math 32% / reading 67%, grade D, #123 of 369 statewide, top 36%, 436 students, 51% FRL).
- Market conditions: 62 active listings in the ZIP; 8 units permitted in Lawrence County in 2024 (0 in 5+ unit buildings).
Forward outlook
- In year one you build about $1k of equity ($691 loan paydown + $615 appreciation (0.6% local appreciation)).
- Lawrence County population projected at -14% by 2050 — secular population decline; favor cash flow + early exit over multi-decade hold.
- At projected returns (0.6% appreciation + 3.0% rent growth), your $28k cash investment doubles in ~5 years — after that, you're playing with house money.
Negotiation context
- It's been on market 87 days — a 6% lower offer ($94k) is reasonable based on typical stale-listing flexibility.
Questions for the listing agent
- It's been on market 87 days. Have you received any prior offers? Is the seller open to a 6% concession, seller financing, or rate buy-down credit?
- Built in 1968 — when were the roof, HVAC, electrical panel, plumbing, and water heater last replaced?
- Why hasn't it sold? Are there any deal-killer items the seller is aware of (foundation, flood, title, zoning, code violations)?
- Is there a deadline driving the sale (1031 exchange, divorce, estate, relocation)? That informs how much negotiation room exists.
- Schools are D-rated, which usually means shorter tenancies and higher turnover. Who's the typical renter profile here, and what's been the actual vacancy rate?
- What's the average days-on-market for RENTAL listings here right now (not sales)? A rising rental-DOM trend means longer vacancies and softer asking-rent achievability than the comps imply.
- What's the recent tenant-quality profile in this submarket — average credit score on applications, eviction rate, late-payment / NSF rate, and stable-employment percentage? A property-management company in the area should have these aggregated.
- How much new for-sale + rental construction is in the pipeline within 1–3 miles? Heavy new supply typically softens prices + rents 12–24 months out; constrained supply supports both.
Investment metrics
- 1% rule
- 1.36% ✓
- Cap rate
- 10.93%
- Cash-on-cash
- 16.58%
- DSCR
- 1.74
- GRM
- 6.1
CMA / ARV
- ARV (median comp)
- $156,529
- List price
- $99,900
- Delta
- -36.18%
- Verdict
- UNDERPRICED
- Comps
- 20 within 1.0 mi
Show comp detail 12 sales within ~0.75 mi
| Address | Dist | Beds/Ba | Sqft | Sold | Price | $/sf | Match |
|---|---|---|---|---|---|---|---|
| 503 College Ave | 0.16mi | 3/2.0 | 1,200 (0%) | 2mo | $220,000 | $183 | 90 |
| 507 College Ave | 0.16mi | 3/2.0 | 1,200 (0%) | 12mo | $212,000 | $177 | 82 |
| 610 W Frank St | 0.19mi | 2/1.5 (-1) | 1,200 (0%) | 4mo | $174,000 | $145 | 81 |
| 515 W Vine St | 0.11mi | 3/1.0 | 1,111 (-7%) | 11mo | $80,000 | $72 | 69 |
| 714 W Curry St | 0.48mi | 3/1.0 | 1,164 (-3%) | 10mo | $90,000 | $77 | 60 |
| 11 South 1st St | 0.24mi | 3/2.0 | 1,380 (+15%) | 10mo | $275,000 | $199 | 56 |
| 533 E State Hwy 60 | 0.49mi | 2/1.0 (-1) | 1,320 (+10%) | 1mo | $152,000 | $115 | 51 |
| 1016 Orchard St St | 0.52mi | 2/2.0 (-1) | 1,068 (-11%) | 6mo | $169,000 | $158 | 47 |
| 818 W Oak St | 0.53mi | 3/1.0 | 1,065 (-11%) | 8mo | $162,900 | $153 | 46 |
| 817 W Brook St | 0.50mi | 3/1.5 | 1,340 (+12%) | 12mo | $105,000 | $78 | 45 |
| 910 W Oak St | 0.56mi | 2/1.0 (-1) | 1,024 (-15%) | 1mo | $149,000 | $146 | 40 |
| 104 Rabbitsville Rd | 0.74mi | 3/1.5 | 1,040 (-13%) | 6mo | $163,000 | $157 | 36 |
Match score weights: distance 35% · size 25% · config 20% · recency 20%. Top-matched comps best support the ARV.
Projected returns pro-forma
0.62% appreciation · 3.0% rent growth · sell at horizon
- IRR
- 17.6%
- Equity multiple
- 1.88×
- Total profit
- $24,634
- Equity at exit
- $32,121
- IRR
- 21.3%
- Equity multiple
- 3.49×
- Total profit
- $69,725
- Equity at exit
- $41,193
Cash invested: $27,972 (down + closing). Projections, not guarantees.
Landlord ↔ Tenant lean methodology
- Overall (STATE)
- 90 Strongly Landlord-Friendly
- State Indiana
- 90 Strongly Landlord-Friendly · R+11
- County
- — inherits STATE
- City
- — inherits STATE
ZIP-level market 47446
- Home prices YoY
- 0.2%
- Active inventory
- 62
- Price-to-rent
- 6.1×
Monthly cashflow live
- Estimated rent
- $1,363 medium interval (Pro) →
- Mortgage (P&I)
- −$524
- Tax est. 1.5%
- −$125 /mo · $1,498/yr
- Insurance
- −$42
- HOA
- −$0
- Vacancy / Maint / Mgmt
- −$286
- Net cashflow
- $386
Break-even live
Sensitivity live
| Price | -10% $455 | -5% $421 | +0% $386 | +5% $352 | +10% $317 |
|---|---|---|---|---|---|
| Rent | -10% $279 | -5% $333 | +0% $386 | +5% $440 | +10% $494 |
| Rate | -1.0pp $437 | -0.5pp $412 | base $386 | +0.5pp $361 | +1.0pp $334 |
UW: 25.0% down · 7.5% · 30yr · 1.5% tax · 5.0% vac · 8.0% maint · 8.0% mgmt
Financing live
Cash to close
- Down payment
- $24,975
- Closing costs
- $2,997
- Reserves months
- —
- Total cash needed
- —
Loan-product check · same deal, 3 products live
Conventional
25% down · 7.5% · 30yr
- Down + closing
- —
- Monthly P&I
- —
- Monthly cashflow
- —
- DSCR
- —
- Eligible?
- —
Personal DTI + credit; lowest rate.
DSCR
20% down · 8.5% · 30yr
- Down + closing
- —
- Monthly P&I
- —
- Monthly cashflow
- —
- DSCR
- —
- Eligible?
- —
No personal income docs; deal must DSCR.
Hard money
10% down · 12.0% · 12mo
- Down + closing
- —
- Monthly P&I
- —
- Monthly cashflow
- —
- DSCR
- —
- Eligible?
- —
Short-term bridge; refi at stabilization.
Listing history 20 events
-
2026-06-22days on market $99,900 Active 87 DOM
-
2026-06-21days on market $99,900 Active 86 DOM
-
2026-06-19days on market $99,900 Active 84 DOM
-
2026-06-18days on market $99,900 Active 83 DOM
-
2026-06-17days on market $99,900 Active 82 DOM
-
2026-06-16days on market $99,900 Active 81 DOM
-
2026-06-15days on market $99,900 Active 80 DOM
-
2026-06-14days on market $99,900 Active 78 DOM
-
2026-06-12pricestatusdays on market $99,900 Active 77 DOM
-
2026-06-09days on market $104,900 Active Under Contract 74 DOM
-
2026-06-08days on market $104,900 Active Under Contract 73 DOM
-
2026-06-07days on market $104,900 Active Under Contract 72 DOM
-
2026-06-05days on market $104,900 Active Under Contract 70 DOM
-
2026-06-03days on market $104,900 Active Under Contract 68 DOM
-
2026-06-02days on market $104,900 Active Under Contract 67 DOM
-
2026-06-01days on market $104,900 Active Under Contract 66 DOM
-
2026-05-31days on market $104,900 Active Under Contract 65 DOM
-
2026-05-30days on market $104,900 Active Under Contract 64 DOM
-
2026-04-30price $114,900 325-char remark
Show marketing remark (325 chars)
Spacious 3 bedroom, 2 bath ranch home on nice corner lot. Open concept living room and dining area. Galley kitchen w/ gas range, refrigerator and microwave. Large family room. Covered front porch. Side patios and rock garden. 24X24 detached garage w/ new OH door. Needs some repairs and updating. Being sold "AS IS"
-
2026-03-25$122,900 Active 325-char remark
Show marketing remark (325 chars)
Spacious 3 bedroom, 2 bath ranch home on nice corner lot. Open concept living room and dining area. Galley kitchen w/ gas range, refrigerator and microwave. Large family room. Covered front porch. Side patios and rock garden. 24X24 detached garage w/ new OH door. Needs some repairs and updating. Being sold "AS IS"
ⓘ Source: listings_history table (triggers on properties + properties_extension) + one-shot
backfill from property_details.listing_events for pre-trigger history.
Climate risk First Street
- Flood 1/10 Low FEMA zone X (unshaded) · 0% chance over 30 yrs
- Wildfire 1/10 Low
- Heat 4/10 Moderate 7 d/yr ≥105°F today · 20 d/yr by 30 yrs out
- Wind 2/10 Low 100% chance of damaging wind over 30 yrs
- Air quality 2/10 Low 1 unhealthy d/yr today · 2 by 30 yrs out
Nearby sold comps map
Loading sold comps map…
Walkable amenities ~0.75 mi
Loading nearby amenities…
Taxation est. · year 1
- Rental income
- $16,356
- − Mortgage interest
- −$5,596
- − Property taxes
- −$1,498
- − Insurance
- −$500
- − Repairs & maintenance
- −$1,308
- − Management
- −$1,308
- − Depreciation
- −$2,906
- Taxable income
- $3,239
- Est. tax owed @ 24.0%
- −$777
- After-tax cash flow
- $3,859/yr
For passive investors: Depreciation is non-cash, so a rental often shows a tax loss while cash-flowing — sheltering income. Rental losses are passive: they offset passive income freely, and up to $25,000/yr can offset ordinary (W-2) income if you actively participate and your MAGI is under $100k (phasing out to $0 by $150k); unused losses carry forward. On sale, claimed depreciation is recaptured at up to 25%, and gains may owe capital-gains tax (a 1031 exchange can defer both). Figures are a year-1 estimate at your 24.0% rate — not tax advice; consult a CPA.
Schools (NCES district)
- District
- Mitchell Community Schools
- NCES district ID
- 1806900
- Math proficiency
- 26% ▼ -16.00%
- Reading proficiency
- 37% ▼ -10.00%
- Median HH income
- $43,994
- Composite
- 26.83/100
- National rank
- #7113
- State rank
- #230 of 301 in IN
Livability — Mitchell
- Score
- 69/100
- State rank
- #187
- US rank
- #8606
Category grades
Schools grade is shown separately in the Schools card above.
Census & demographics
- Census place
- Mitchell, IN
- Population (ZIP)
- 9,259
Population outlook (Lawrence County) Hauer SSP2
- Today (2025)
- 44,347 people
- By 2030
- 43,331 · -2.3%
- By 2040
- 40,887 · -7.8%
- By 2050
- 38,297 · -13.6%
- By 2075
- 32,479 · -26.8%
- By 2100
- 26,051 · -41.3%
Race, ethnicity, and origin ACS 2023
- Neighborhood character
- Predominantly White (93%)
- Race & ethnicity
- White 93% Two or more races 4% Asian 2% Hispanic / Latino 1%
- Common ancestry
- Italian 3% Slovak 2% Serbian 1%
- Foreign-born
- 3% · Canada
- Languages at home
- 96% English-only · Other Indo-European 2% Spanish 1%
Political lean MEDSL · Lawrence
- 2024 margin
- Solid R (+51.0) · D 23.6% · R 74.6% · Other 1.7%
- 2008→2024 swing
- -30.5pp toward R · 2008: -20.6pp · 2024: -51.0pp
- All cycles
- 2024: R+51.0 2020: R+50.6 2016: R+51.5 2012: R+32.8 2008: R+20.6
Not yet ingested
- Civics
- —
Market trends
- HPI YoY
- ▲ 0.62%
- Current HPI
- 248.9604
- Rent YoY
- —
- Metro
- —
- State GDP YoY
- ▲ 2.90%
- F500 in state
- 18
Industry mix (Fortune 500 HQ in IN)
| Industry | F500 HQs | Revenue |
|---|---|---|
| Industrial Machinery | 2 | $37B |
|
||
| Healthcare | 1 | $177B |
|
||
| Pharmaceuticals | 1 | $45B |
|
||
| Metals / Steel | 1 | $18B |
|
||
| Agriculture | 1 | $17B |
|
||
| Packaging | 1 | $12B |
|
||
Price history
-6.5% since first listed2 events — show timeline
- 2026-04-30 Price Changed $114,900 IRMLS
- 2026-03-25 Listed $122,900 IRMLS
Property tax history
+0.0%/yrLatest (2025): $60 · +0.0% YoY. Source: county tax records.
Cash-flow waterfall
monthlySold comps — $/sqft
last 12 mo · ≤1 miLoading sold comps…