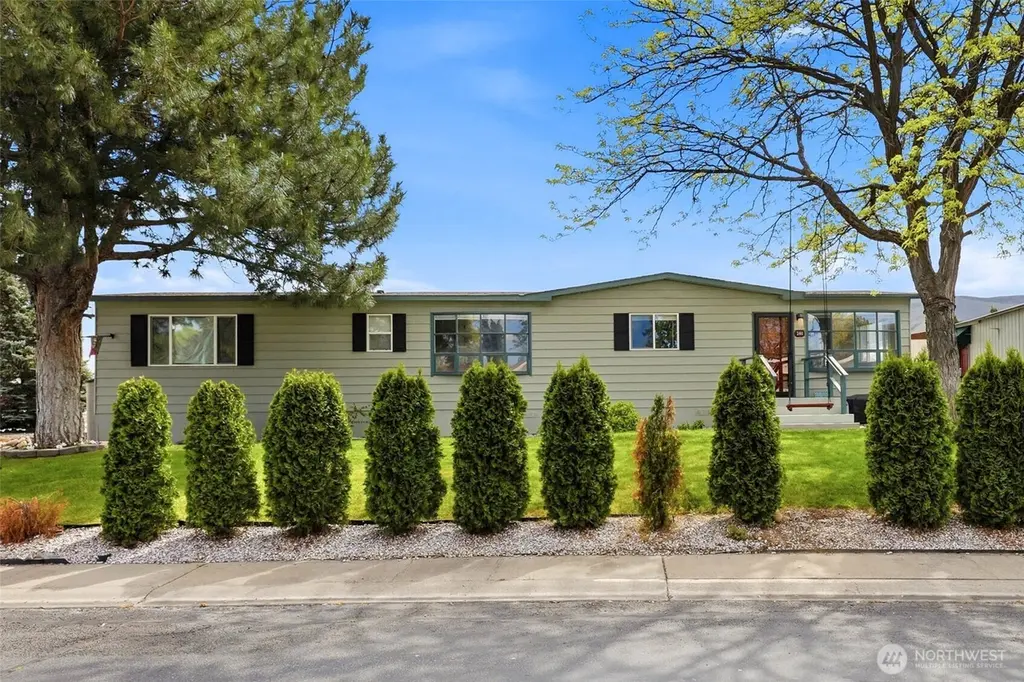
240 Skyline Dr · Richland, WA
Flood risk 1/10 · Minimal
- FEMA flood zone
- X
- Chance of flooding over 30 yrs
- 0.0%
- Est. flood insurance / yr
- $473 – $860
Fire risk 5/10 · Moderate
- Est. fire insurance / yr
- $604 – $1,122
Heat risk 5/10 · Moderate
- Hot days now (above 99°F)
- 7 days/yr
- Hot days in 30 yrs
- 15 days/yr
Wind risk 1/10 · Minimal
- Chance of severe wind over 30 yrs
- —
Air-quality risk 7/10 · Major
- Unhealthy air days now
- 11 days/yr
- Unhealthy air days in 30 yrs
- 12 days/yr
Risk factors via First Street. Map © Google.
Why this score? — see what drove the C+ grade
The composite is a weighted blend of 9 inputs, each scored 0–100. Each bar is that input's sub-score; the figure is the points it added to the 100-point composite (weight × sub-score).
- Cash flow +29.0/30.0
- DSCR +10.0/10.0
- 1% rule +8.1/10.0
- Schools +5.3/10.0
- Livability +4.0/5.0
- ARV discount +2.9/15.0
- Rent growth +2.9/5.0
- Condition / age +2.5/5.0
- Appreciation +0.0/10.0
$165,900
🖨 Deal sheet 📄 Offer letter ✓ Due diligence
Listing remarks MLS
MLS# 292221 Beautifully updated and ideally located near the Queensgate area, this home offers space, comfort, and convenience. Open kitchen features an island, pantry, updated cabinets and counters, cabinet-height backsplash, and all the appliances, including the washer and dryer, are included in the sale. Both bathrooms have been tastefully remodeled, and new paint, updated lighting, plumbing fixtures, LVP flooring, vinyl windows, and a new hot water tank add to the home’s fresh feel. Enjoy both a living room and large family room, plus a covered deck, shed, off-street parking, mature trees, and an established garden area. Includes access to the playground, clubhouse, and swimming pool, making this an appealing package in a great Richland location.
Key facts
- Pantry
- Updated cabinets
- Updated counters
Tags
Property features AI
Finance
- Other: Calculated building area: 1536; Green feature: Double pane windows
- Financial info: Listing terms: Cash
- HOA & community: Located in The Hills park; Park amenities: Clubhouse, Playground, Pool; Land lease: $775
Exterior
- Parking: Uncovered parking
- Utilities: Electric energy source; Public water
- Home design: Manufactured double-wide home; One level; Residential property
- Construction: Metal/vinyl construction; Composition roof; Manufactured house; Foundation: See remarks
- Exterior features: Metal/vinyl exterior; Corner lot; Patio/porch/deck
Interior
- Kitchen: Dishwasher; Garbage disposal; Refrigerator
- Bedrooms: 3 bedrooms
- Flooring: Laminate; Vinyl; Carpet
- Bathrooms: 1 full bath; 1 three-quarter bath; 1 bathtub; 2 showers
- Heating & cooling: Forced air heating; Heat pump; Forced air cooling; Heat pump cooling
- Interior features: Bath off primary; Double pane windows; Patio/porch/deck; Dishwasher; Garbage disposal
- Laundry & utility: Washer; Dryer
Neighborhood map
What this means for you Summary
Snapshot
- This is a 3-bed/2.0-bath manufactured listed at $166k.
Deal economics
- At list price, monthly cash flow is $567 ($7k/yr) — positive.
- The deal already cash-flows at list — no discount required.
- Meets the 1% rule at list price ($2k rent vs $166k).
- Recommended offer: $161k (3.0% below list) — sets the bar for market timing.
- Cap rate 10.4% vs local median 2.8% in Richland — top-decile yield for the area; either an underpriced asset or a hidden risk that comps aren't pricing in. Stress-test before assuming the spread holds.
Location & tenants
- Location reads 79/100 on livability (#112 in WA, #2,258 nationally) — a middle-class / working-renter tenant base. Strengths: commute A+, housing A+, health & safety A+; Watch: cost of living C-, amenities F.
- Richland School District (urban): math 52% / reading 64% proficiency, ranked #61 of 291 in WA (top 21%) — acceptable for families but not a draw, mixed tenant base, ~2y average lease.
- Market conditions: Rents rising (+1.6%/yr); 544 active listings in the ZIP; 11 comparable units currently listed for rent nearby; rentals at typical pace (median 21d on market — plan ~3-4 weeks tenant-placement turnaround); 40% of comp listings sitting > 30 days — soft ceiling on asking rent; solid renter incomes; 1,532 units permitted in Benton County in 2024 (389 in 5+ unit buildings).
Forward outlook
- Local home prices are declining (-3.0%/yr); year-one equity from $1k of loan paydown is wiped out by about $5k of value loss. Plan a longer hold.
- Benton County population projected at +32% by 2050 — long-run rental-demand tailwind backs the buy-and-hold thesis.
- At projected returns (-3.0% appreciation + 1.6% rent growth), your $46k cash investment doubles in ~10 years — after that, you're playing with house money.
Negotiation context
- It's been on market 51 days — a 3% lower offer ($161k) is reasonable based on typical stale-listing flexibility.
- 4 sale attempts since 23y ago with the ask held roughly flat each time — persistent listings suggest the price (not the market) is what's stuck; bring a comps-based counter.
- Current owner paid $32k; list at $166k implies a 427% gain — meaningful room to come down on a strong offer.
Risks & watch-outs
- Climate carrying-cost: moderate wildfire risk; extreme-heat days projected 7→15/yr by 2055 (HVAC capex compounding) — expect insurance premiums to compound above CPI over the hold.
Questions for the listing agent
- It's been on market 51 days. Have you received any prior offers? Is the seller open to a 3% concession, seller financing, or rate buy-down credit?
- Built in 1977 — when were the roof, HVAC, electrical panel, plumbing, and water heater last replaced?
- Is there a deadline driving the sale (1031 exchange, divorce, estate, relocation)? That informs how much negotiation room exists.
- Schools are A-rated — typically a magnet for longer-tenancy family renters. What's the average tenant stay here, and is there a school-zone premium baked into asking?
- What's the average days-on-market for RENTAL listings here right now (not sales)? A rising rental-DOM trend means longer vacancies and softer asking-rent achievability than the comps imply.
- What's the recent tenant-quality profile in this submarket — average credit score on applications, eviction rate, late-payment / NSF rate, and stable-employment percentage? A property-management company in the area should have these aggregated.
- How much new for-sale + rental construction is in the pipeline within 1–3 miles? Heavy new supply typically softens prices + rents 12–24 months out; constrained supply supports both.
Investment metrics
- 1% rule
- 1.31% ✓
- Cap rate
- 10.39%
- Cash-on-cash
- 14.65%
- DSCR
- 1.65
- GRM
- 6.4
CMA / ARV
- ARV (median comp)
- $150,575
- List price
- $165,900
- Delta
- 10.18%
- Verdict
- OVERPRICED
- Comps
- 12 within 1.0 mi
Show comp detail 12 sales within ~0.75 mi
| Address | Dist | Beds/Ba | Sqft | Sold | Price | $/sf | Match |
|---|---|---|---|---|---|---|---|
| 208 Crestwood Dr | 0.12mi | 3/2.0 | 1,536 (0%) | 4mo | $100,000 | $65 | 92 |
| 16 Valley View Circle Dr | 0.04mi | 3/2.0 | 1,536 (0%) | 13mo | $106,000 | $69 | 88 |
| 103 Skyline Dr #103 | 0.14mi | 3/2.0 | 1,536 (0%) | 16mo | $122,750 | $80 | 81 |
| 93 Ridgecliff Dr | 0.15mi | 3/3.0 | 1,560 (+2%) | 8mo | $185,000 | $119 | 80 |
| 212 Crestwood Dr | 0.08mi | 3/2.0 | 1,680 (+9%) | 1mo | $148,900 | $89 | 80 |
| 165 Cedarwood Ct | 0.07mi | 3/2.0 | 1,536 (0%) | 23mo | $170,000 | $111 | 78 |
| 77 Ridgecliff Dr | 0.27mi | 3/2.0 | 1,484 (-3%) | 14mo | $166,000 | $112 | 70 |
| 83 Ridgecliff Dr | 0.22mi | 3/2.0 | 1,404 (-9%) | 8mo | $99,900 | $71 | 68 |
| 2492 Horizon View Ln | 0.42mi | 3/1.5 | 1,512 (-2%) | 12mo | $227,500 | $150 | 66 |
| 647 Lonetree Ln | 0.33mi | 4/2.0 (+1) | 1,716 (+12%) | 14mo | $155,000 | $90 | 48 |
| 71 Ridgecliff Dr | 0.30mi | 3/2.0 | 1,760 (+15%) | 18mo | $216,500 | $123 | 47 |
| 69 Ridgecliff Dr | 0.28mi | 3/2.0 | 1,323 (-14%) | 20mo | $132,000 | $100 | 47 |
Match score weights: distance 35% · size 25% · config 20% · recency 20%. Top-matched comps best support the ARV.
Projected returns pro-forma
-3.0% appreciation · 1.6% rent growth · sell at horizon
- IRR
- 3.5%
- Equity multiple
- 1.13×
- Total profit
- $6,251
- Equity at exit
- $24,736
- IRR
- 11.7%
- Equity multiple
- 1.86×
- Total profit
- $40,058
- Equity at exit
- $14,344
Cash invested: $46,452 (down + closing). Projections, not guarantees.
Landlord ↔ Tenant lean methodology
- Overall (STATE)
- 28 Tenant-Leaning
- State Washington
- 28 Tenant-Leaning · D+8
- County
- — inherits STATE
- City
- — inherits STATE
ZIP-level market 99352
- Rents YoY
- 1.6%
- Active inventory
- 544
- Price-to-rent
- 6.4×
Monthly cashflow live
- Estimated rent
- $2,169 high interval (Pro) →
- Mortgage (P&I)
- −$870
- Tax est. 1.5%
- −$207 /mo · $2,488/yr
- Insurance
- −$69
- HOA
- −$0
- Vacancy / Maint / Mgmt
- −$455
- Net cashflow
- $567
Break-even live
UW: 25.0% down · 7.5% · 30yr · 1.5% tax · 5.0% vac · 8.0% maint · 8.0% mgmt
Financing live
Cash to close
- Down payment
- $41,475
- Closing costs
- $4,977
- Reserves months
- —
- Total cash needed
- —
Loan-product check · same deal, 3 products live
Conventional
25% down · 7.5% · 30yr
- Down + closing
- —
- Monthly P&I
- —
- Monthly cashflow
- —
- DSCR
- —
- Eligible?
- —
Personal DTI + credit; lowest rate.
DSCR
20% down · 8.5% · 30yr
- Down + closing
- —
- Monthly P&I
- —
- Monthly cashflow
- —
- DSCR
- —
- Eligible?
- —
No personal income docs; deal must DSCR.
Hard money
10% down · 12.0% · 12mo
- Down + closing
- —
- Monthly P&I
- —
- Monthly cashflow
- —
- DSCR
- —
- Eligible?
- —
Short-term bridge; refi at stabilization.
Rent comps 11 comps
| Address | Beds | Baths | Sqft | Rent | $/sqft | DOM | Units | Dist |
|---|---|---|---|---|---|---|---|---|
| 731 Rio Vista Loop Richland, WA | 3.0 | 2.5 | 1500 | $2,195 | $1.46 | 43d | 1 | 0.13mi |
| 723 Rio Vista Loop heuristic Richland, WA | 3.0 | 2.5 | 1500 | $2,195 | $1.46 | 25d | 1 | 0.14mi |
| 782 Rio Vista Loop Richland, WA | 3.0 | 3.0 | 1500 | $2,195 | $1.46 | 43d | 1 | 0.17mi |
| 790 Rio Vista LOOP Richland, WA | 3.0 | 3.0 | 1500 | $2,195 | $1.46 | 43d | 1 | 0.18mi |
| 3003 Queensgate Dr Richland, WA | 3.0 | 1.0–2.5 | 931 | $2,030 | $2.18 | 13d | 21 | 0.60mi |
| 2550 Duportail St Richland, WA | 1.0–3.0 | 1.0–2.0 | 980 | $1,985 | $2.03 | 13d | 15 | 0.64mi |
| 1043 Tartarian Ave Richland, WA | 2.0–3.0 | 2.0 | 1147 | $2,299 | $2.00 | 13d | 20 | 0.88mi |
| 501 Wright Ave Apt 1 Richland, WA | 2.0 | 2.5 | 1114 | $1,450 | $1.30 | 21d | 1 | 1.04mi |
| 215 Casey Ave Richland, WA | 2.0 | 1.0 | 1400 | $1,800 | $1.29 | 43d | 1 | 1.37mi |
| 414 Douglass Ave Richland, WA | 3.0 | 2.0 | 1800 | $1,795 | $1.00 | 13d | 1 | 1.38mi |
| 902 Birch Ave Richland, WA | 3.0 | 2.0 | 1600 | $1,900 | $1.19 | 13d | 1 | 1.44mi |
Listing history 22 events
-
2026-06-18days on market $165,900 Active 51 DOM
-
2026-06-17days on market $165,900 Active 50 DOM
-
2026-06-16days on market $165,900 Active 49 DOM
-
2026-06-15days on market $165,900 Active 48 DOM
-
2026-06-14days on market $165,900 Active 46 DOM
-
2026-06-13days on market $165,900 Active 45 DOM
-
2026-06-10days on market $165,900 Active 43 DOM
-
2026-06-09days on market $165,900 Active 42 DOM
-
2026-06-08days on market $165,900 Active 41 DOM
-
2026-06-07days on market $165,900 Active 40 DOM
-
2026-06-05days on market $165,900 Active 37 DOM
-
2026-06-03days on market $165,900 Active 36 DOM
-
2026-06-02days on market $165,900 Active 35 DOM
-
2026-06-01days on market $165,900 Active 34 DOM
-
2026-05-31days on market $165,900 Active 33 DOM
-
2026-05-30days on market $165,900 Active 32 DOM
-
2026-04-17$165,900 Active 766-char remark
Show marketing remark (766 chars)
MLS# 292221 Beautifully updated and ideally located near the Queensgate area, this home offers space, comfort, and convenience. Open kitchen features an island, pantry, updated cabinets and counters, cabinet-height backsplash, and all the appliances, including the washer and dryer, are included in the sale. Both bathrooms have been tastefully remodeled, and new paint, updated lighting, plumbing fixtures, LVP flooring, vinyl windows, and a new hot water tank add to the home’s fresh feel. Enjoy both a living room and large family room, plus a covered deck, shed, off-street parking, mature trees, and an established garden area. Includes access to the playground, clubhouse, and swimming pool, making this an appealing package in a great Richland location.
-
2026-04-17$165,900 Active
Show marketing remark (766 chars)
MLS# 292221 Beautifully updated and ideally located near the Queensgate area, this home offers space, comfort, and convenience. Open kitchen features an island, pantry, updated cabinets and counters, cabinet-height backsplash, and all the appliances, including the washer and dryer, are included in the sale. Both bathrooms have been tastefully remodeled, and new paint, updated lighting, plumbing fixtures, LVP flooring, vinyl windows, and a new hot water tank add to the home’s fresh feel. Enjoy both a living room and large family room, plus a covered deck, shed, off-street parking, mature trees, and an established garden area. Includes access to the playground, clubhouse, and swimming pool, making this an appealing package in a great Richland location.
-
2011-10-03soldstatus $31,500 401-char remark
Show marketing remark (401 chars)
You will fall in love with this home. Nicely updated with warm paints colors and window treatments plus newer flooring and fixtures. Roomy and comfortable floor plan. Perfect corner lot which allows for room and enjoyable landscaping. There is a fenced area too! Newer heat pump, roof and windows. 2 entrances to the park. .. 1 is Queensgate/right on Duportail to Lonestar/ right Bitteroot to Skyline.
-
2011-08-18$32,000 401-char remark
Show marketing remark (401 chars)
You will fall in love with this home. Nicely updated with warm paints colors and window treatments plus newer flooring and fixtures. Roomy and comfortable floor plan. Perfect corner lot which allows for room and enjoyable landscaping. There is a fenced area too! Newer heat pump, roof and windows. 2 entrances to the park. .. 1 is Queensgate/right on Duportail to Lonestar/ right Bitteroot to Skyline.
-
2004-02-10soldstatus $18,000
-
2003-12-12$24,000
ⓘ Source: listings_history table (triggers on properties + properties_extension) + one-shot
backfill from property_details.listing_events for pre-trigger history.
Climate risk First Street
- Flood 1/10 Low FEMA zone X · 0% chance over 30 yrs
- Wildfire 5/10 Major
- Heat 5/10 Major 7 d/yr ≥99°F today · 15 d/yr by 30 yrs out
- Wind 1/10 Low
- Air quality 7/10 Severe 11 unhealthy d/yr today · 12 by 30 yrs out
Nearby sold comps map
Loading sold comps map…
Walkable amenities ~0.75 mi
Loading nearby amenities…
Taxation est. · year 1
- Rental income
- $26,028
- − Mortgage interest
- −$9,293
- − Property taxes
- −$2,488
- − Insurance
- −$830
- − Repairs & maintenance
- −$2,082
- − Management
- −$2,082
- − Depreciation
- −$4,826
- Taxable income
- $4,427
- Est. tax owed @ 24.0%
- −$1,062
- After-tax cash flow
- $5,742/yr
For passive investors: Depreciation is non-cash, so a rental often shows a tax loss while cash-flowing — sheltering income. Rental losses are passive: they offset passive income freely, and up to $25,000/yr can offset ordinary (W-2) income if you actively participate and your MAGI is under $100k (phasing out to $0 by $150k); unused losses carry forward. On sale, claimed depreciation is recaptured at up to 25%, and gains may owe capital-gains tax (a 1031 exchange can defer both). Figures are a year-1 estimate at your 24.0% rate — not tax advice; consult a CPA.
Schools (NCES district)
- District
- Richland School District
- NCES district ID
- 5307320
- Math proficiency
- 52% ▬ 0.00%
- Reading proficiency
- 64% ▼ -1.00%
- Median HH income
- $70,475
- Composite
- 53.04/100
- National rank
- #3244
- State rank
- #61 of 291 in WA
Livability — Richland
- Score
- 79/100
- State rank
- #112
- US rank
- #2258
Category grades
Schools grade is shown separately in the Schools card above.
Census & demographics
- Census place
- Richland, WA
- County
- Benton County · 186,895 people
- City population
- 62,989
- Metro
- Kennewick-Richland, WA
- Population (ZIP)
- 37,430
- Household income
- $100,108
- Rent vs Own
- Severe rent burden
- 983.0
Population outlook (Benton County) Hauer SSP2
- Today (2025)
- 219,421 people
- By 2030
- 233,813 · +6.6%
- By 2040
- 262,134 · +19.5%
- By 2050
- 290,100 · +32.2%
- By 2075
- 363,525 · +65.7%
- By 2100
- 418,667 · +90.8%
Race, ethnicity, and origin ACS 2023
- Neighborhood character
- Predominantly White (73%)
- Race & ethnicity
- White 73% Hispanic / Latino 14% Two or more races 10% Asian 7% Black 2%
- Hispanic origin (detail)
- Mexican 11%
- Common ancestry
- Italian 4% Portuguese 4% Slovak 3%
- Foreign-born
- 9% · Canada, South Korea, China
- Languages at home
- 88% English-only · Spanish 4% Other Indo-European 3% Korean 1%
Political lean MEDSL · Benton
- 2024 margin
- Strong R (+21.9) · D 37.7% · R 59.6% · Other 2.7%
- 2008→2024 swing
- +4.2pp toward D · 2008: -26.1pp · 2024: -21.9pp
- All cycles
- 2024: R+21.9 2020: R+21.0 2016: R+26.6 2012: R+27.0 2008: R+26.1
Not yet ingested
- Civics
- —
Market trends
- HPI YoY
- ▼ -323.81%
- Current HPI
- 217.3435
- Rent YoY
- ▲ 1.60%
- Metro
- Kennewick-Richland, WA
- State GDP YoY
- ▲ 4.65%
- F500 in state
- 22
Industry mix (Fortune 500 HQ in WA)
| Industry | F500 HQs | Revenue |
|---|---|---|
| Retail | 2 | $269B |
|
||
| Technology / Retail | 1 | $638B |
|
||
| Technology | 1 | $245B |
|
||
| Telecommunications | 1 | $38B |
|
||
| Food / Beverage | 1 | $36B |
|
||
| Automotive / Trucks | 1 | $34B |
|
||
Price history
+591.2% since first listed6 events — show timeline
- 2026-04-17 Listed $165,900 NWMLS as Distributed by MLS Grid
- 2026-04-17 Listed $165,900 PACMLS
- 2011-10-03 Sold (MLS) $31,500 PACMLS
- 2011-08-18 Listed $32,000 PACMLS
- 2004-02-10 Sold (MLS) $18,000 PACMLS
- 2003-12-12 Listed $24,000 PACMLS
Property tax history
+0.9%/yrLatest (2026): $273 · +25.0% YoY. Source: county tax records.
Cash-flow waterfall
monthlySold comps — $/sqft
last 12 mo · ≤1 miLoading sold comps…