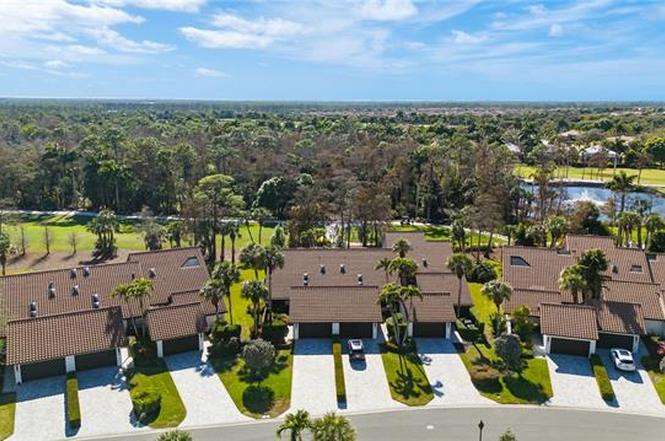
105 Cypress View Dr #105 · Lely Resort, FL
Flood risk 9/10 · Severe
- FEMA flood zone
- AE
- Chance of flooding over 30 yrs
- 0.99%
- Est. flood insurance / yr
- $1,737 – $8,500
Fire risk 3/10 · Minor
- Est. fire insurance / yr
- $947 – $1,759
Heat risk 10/10 · Severe
- Hot days now (above 108°F)
- 7 days/yr
- Hot days in 30 yrs
- 29 days/yr
Wind risk 10/10 · Severe
- Chance of severe wind over 30 yrs
- 99.0%
Air-quality risk 2/10 · Minimal
- Unhealthy air days now
- 2 days/yr
- Unhealthy air days in 30 yrs
- 2 days/yr
Risk factors via First Street. Map © Google.
Why this score? — see what drove the D+ grade
The composite is a weighted blend of 9 inputs, each scored 0–100. Each bar is that input's sub-score; the figure is the points it added to the 100-point composite (weight × sub-score).
- Cash flow +13.4/30.0
- 1% rule +9.8/10.0
- ARV discount +7.5/15.0
- Schools +5.0/10.0
- DSCR +4.0/10.0
- Rent growth +3.9/5.0
- Livability +3.1/5.0
- Condition / age +2.5/5.0
- Appreciation +0.0/10.0
$319,000
🖨 Deal sheet 📄 Offer letter ✓ Due diligence
Listing remarks
TIER TWO GOLF AVAILABLE, PLAY ALL YEAR LONG. .. This highly desirable 2Bed+Den, 2 Bath villa offers the perfect blend of comfort, functionality, and serene golf course views. Thoughtfully designed, the open floorplan with skylights provides spacious living areas ideal for both everyday living and entertaining. The interior features neutral tones throughout, creating a light and inviting atmosphere that complements any décor style. Tile flooring flows through the main living areas, while the bedrooms offer the warmth and comfort of carpet. The newly painted kitchen provides a fresh, updated feel and serves as the heart of the home, seamlessly connecting to the dining and living spaces
Key facts
- Ample outdoor space
- Open floorplan
- Great location
Tags
Property features AI
Finance
- Financial info: Total annual recurring fees $22,980; Total one-time fees $40,300
- HOA & community: Mandatory HOA; HOA fee $339 monthly; Master HOA fee $350 monthly; One-time mandatory club fee $40,000; Mandatory club fee $822 monthly; On-site management; Maintenance covers cable, internet/WiFi, irrigation water, lawn/land maintenance, manager, exterior pest control, repairs, reserves; Community amenities include clubhouse, community pool and spa, exercise room, tennis, pickleball, bocce, basketball, putting green, golf course (golf equity), restaurant, library, community room, hobby room, underground utilities, sidewalks and streetlights, private membership, shopping access
Exterior
- Parking: 2 assigned parking spaces; Detached 2-car garage; Paved driveway and paved parking
- Security: Gated community with guard at gate and patrol; Entry keypad; Completely fenced
- Utilities: Central water with filter; Central sewer; Cable available; Electric service for heat and cooling
- Home design: Residential property; Villa attached (end-unit); Built in 1986; Single-story; Rear exposure facing southwest
- Construction: Wood frame construction
- Exterior features: Room for pool; Completely fenced; Entry keypad; Gated community with gate guard and patrol; Single-hung and sliding windows; Stucco exterior; Tile roof
Interior
- Kitchen: Cooktop; Range; Self-cleaning oven; Microwave; Dishwasher; Garbage disposal; Refrigerator / Refrigerator-Freezer
- Bedrooms: 2 bedrooms; First-floor bedroom; Split bedroom floor plan
- Flooring: Carpet; Tile
- Bathrooms: 2 full bathrooms; Master bath with separate tub and shower
- Heating & cooling: Central electric heat; Central electric cooling
- Interior features: Cable prewire; Foyer; High-speed internet available; Smoke detectors; Walk-in closet; Intercom; 3 ceiling fans; Screened lanai/porch; 7 total rooms; Negotiable furnishings
- Laundry & utility: Washer; Dryer
Neighborhood map
What this means for you Summary
Snapshot
- This is a 2-bed/2.0-bath condo listed at $319k.
Deal economics
- At list price, monthly cash flow is $-420 ($-5k/yr) — negative.
- To cash-flow at today's rent, offer at most $258k (19.1% below list).
- Meets the 1% rule at list price ($5k rent vs $319k).
- Recommended offer: $258k (19.1% below list) — sets the bar for cash-flow.
Location & tenants
- Location reads 61/100 on livability (#786 in FL) — a middle-class / working-renter tenant base. Strengths: crime A+, employment A-; Watch: health & safety D, amenities F, commute F.
- Collier (suburban): math 60% / reading 56% proficiency, ranked #16 of 73 in FL (top 22%) — acceptable for families but not a draw, mixed tenant base, ~2y average lease.
- Zoned schools: Manatee Elementary School (math 58% / reading 51%, grade C, #892 of 2,144 statewide, top 44%, 584 students, 73% FRL) — zoned schools average 73% FRL vs 55% district-wide (18 pts higher); higher-poverty schools than district average — tighter screening recommended.
- Market conditions: Rents rising fast (+5.6%/yr); 597 active listings in the ZIP; 40 comparable units currently listed for rent nearby; rentals at typical pace (median 24d on market — plan ~3-4 weeks tenant-placement turnaround); solid renter incomes; 3,520 units permitted in Collier County in 2024 (959 in 5+ unit buildings).
- At $4,711/mo this rent would consume 69% of the median local household income ($82k/yr) (locally 954% of renters already pay >50% of income on rent) — very limited rent-growth headroom before tenants either downsize or default.
Forward outlook
- Local home prices are declining (-3.0%/yr); year-one equity from $2k of loan paydown is wiped out by about $10k of value loss. Plan a longer hold.
- Collier County population projected at +30% by 2050 — long-run rental-demand tailwind backs the buy-and-hold thesis.
Negotiation context
- It's been on market 127 days — a 12% lower offer ($281k) is reasonable based on typical stale-listing flexibility.
Risks & watch-outs
- Watch-outs: flood insurance adds $427/mo; HOA is 32% of rent.
- Climate carrying-cost: in FEMA flood zone AE (mandatory federal flood insurance); severe wind risk, 99% chance of damaging wind over 30y; extreme-heat days projected 7→29/yr by 2055 (HVAC capex compounding) — expect insurance premiums to compound above CPI over the hold.
Questions for the listing agent
- What do current leases actually rent for vs. the listed asking? Can we see a recent rent roll and the last 12 months of T-12 income?
- It's been on market 127 days. Have you received any prior offers? Is the seller open to a 19% concession, seller financing, or rate buy-down credit?
- What's the actual annual flood-insurance premium (NFIP or private), and is the property in a SFHA with mandatory coverage?
- What does the HOA fee cover, when was the last increase, and are there any pending special assessments or reserve-fund shortfalls?
- Any open or pending special assessments — roof, HVAC, plumbing, elevator, façade? What's the per-unit balance and payoff schedule, and is the seller paying it off at close or rolling it to the buyer?
- Why hasn't it sold? Are there any deal-killer items the seller is aware of (foundation, flood, title, zoning, code violations)?
- Is there a deadline driving the sale (1031 exchange, divorce, estate, relocation)? That informs how much negotiation room exists.
- Schools are F-rated, which usually means shorter tenancies and higher turnover. Who's the typical renter profile here, and what's been the actual vacancy rate?
- The area grade is low — what's the realistic commute time and amenity access for the typical tenant pool here? Any planned neighborhood developments (good or bad) we should know about?
- What's the average days-on-market for RENTAL listings here right now (not sales)? A rising rental-DOM trend means longer vacancies and softer asking-rent achievability than the comps imply.
- What's the recent tenant-quality profile in this submarket — average credit score on applications, eviction rate, late-payment / NSF rate, and stable-employment percentage? A property-management company in the area should have these aggregated.
- How much new apartment / multifamily construction is in the pipeline within 1–3 miles? Heavy new supply (>2% of stock underway) typically softens rents 12–24 months out; light construction supports rent growth.
Investment metrics
- 1% rule
- 1.48% ✓
- Cap rate
- 6.32%
- Cash-on-cash
- 0.08%
- DSCR
- 1.00
- GRM
- 5.6
CMA / ARV
No comps found within radius.
Projected returns pro-forma
-3.0% appreciation · 5.59% rent growth · sell at horizon
- IRR
- -19.8%
- Equity multiple
- 0.28×
- Total profit
- $-64,606
- Equity at exit
- $47,564
- IRR
- -4.3%
- Equity multiple
- 0.65×
- Total profit
- $-31,103
- Equity at exit
- $27,581
Cash invested: $89,320 (down + closing). Projections, not guarantees.
Landlord ↔ Tenant lean methodology
- Overall (STATE)
- 87 Strongly Landlord-Friendly
- State Florida
- 87 Strongly Landlord-Friendly · R+3
- County
- — inherits STATE
- City
- — inherits STATE
ZIP-level market 34113
- Rents YoY
- 5.6%
- Active inventory
- 597
- Price-to-rent
- 5.6×
Monthly cashflow live
- Estimated rent
- $4,711 high interval (Pro) →
- Mortgage (P&I)
- −$1,673
- Tax est. 1.5%
- −$399 /mo · $4,785/yr
- Insurance
- −$133
- Flood insurance flood zone
- −$427 /mo · $5,118/yr
- HOA
- −$1,511
- Vacancy / Maint / Mgmt
- −$989
- Net cashflow
- $-420
Break-even live
UW: 25.0% down · 7.5% · 30yr · 1.5% tax · 5.0% vac · 8.0% maint · 8.0% mgmt
Financing live
Cash to close
- Down payment
- $79,750
- Closing costs
- $9,570
- Reserves months
- —
- Total cash needed
- —
Loan-product check · same deal, 3 products live
Conventional
25% down · 7.5% · 30yr
- Down + closing
- —
- Monthly P&I
- —
- Monthly cashflow
- —
- DSCR
- —
- Eligible?
- —
Personal DTI + credit; lowest rate.
DSCR
20% down · 8.5% · 30yr
- Down + closing
- —
- Monthly P&I
- —
- Monthly cashflow
- —
- DSCR
- —
- Eligible?
- —
No personal income docs; deal must DSCR.
Hard money
10% down · 12.0% · 12mo
- Down + closing
- —
- Monthly P&I
- —
- Monthly cashflow
- —
- DSCR
- —
- Eligible?
- —
Short-term bridge; refi at stabilization.
Rent comps 40 comps
| Address | Beds | Baths | Sqft | Rent | $/sqft | DOM | Units | Dist |
|---|---|---|---|---|---|---|---|---|
| 22 Cypress View Dr Unit B22 Naples, FL | 2.0 | 2.0 | 1534 | $7,000 | $4.56 | 23d | 1 | 0.20mi |
| 1330 Oceania Dr N #2 Naples, FL | 3.0 | 2.5 | 2022 | $7,000 | $3.46 | 23d | 1 | 0.45mi |
| 1414 Oceania Dr S Naples, FL | 3.0 | 2.0 | 1572 | $5,000 | $3.18 | 23d | 1 | 0.50mi |
| 1439 Oceania Dr S Naples, FL | 3.0 | 2.0 | 1897 | $7,000 | $3.69 | 23d | 1 | 0.54mi |
| 1367 Artesia Dr E #302 Naples, FL | 2.0 | 2.5 | 1583 | $2,800 | $1.77 | 23d | 1 | 0.54mi |
| 1292 Kendari Ter Naples, FL | 3.0 | 3.5 | 2150 | $3,300 | $1.53 | 23d | 1 | 0.63mi |
| 1308 Kendari Ter Naples, FL | 3.0 | 3.5 | 2115 | $4,000 | $1.89 | 21d | 1 | 0.66mi |
| 158 Rookery Rd Naples, FL | 3.0 | 2.0 | 1456 | $2,450 | $1.68 | 23d | 1 | 0.69mi |
| 1320 Kendari Ter Naples, FL | 3.0 | 2.5 | 2122 | $3,100 | $1.46 | 23d | 1 | 0.69mi |
| 1326 Kendari Ter Naples, FL | 3.0 | 3.5 | 2100 | $6,500 | $3.10 | 13d | 1 | 0.70mi |
| 1342 Kendari Ter Naples, FL | 3.0 | 2.5 | 2122 | $2,995 | $1.41 | 21d | 1 | 0.73mi |
| 1423 Santiago Cir #1702 Naples, FL | 2.0 | 2.5 | 1583 | $6,500 | $4.11 | 23d | 1 | 0.75mi |
| 6590 Beach Resort Dr Unit 305 Naples, FL | 2.0 | 2.0 | 1351 | $4,500 | $3.33 | 13d | 1 | 0.76mi |
| 6750 Beach Resort Dr #7 Naples, FL | 2.0 | 2.0 | 1351 | $3,900 | $2.89 | 23d | 1 | 0.79mi |
| 6750 Beach Resort Dr Naples, FL | 2.0 | 2.0 | 1351 | $3,200 | $2.37 | 13d | 2 | 0.79mi |
| 1435 Santiago Cir #2003 Naples, FL | 3.0 | 2.5 | 1315 | $2,600 | $1.98 | 23d | 1 | 0.81mi |
| 6650 Beach Resort Dr Unit 908 Naples, FL | 2.0 | 2.0 | 1351 | $4,600 | $3.40 | 13d | 1 | 0.84mi |
| 274 Riverwood Rd Unit 1546056P Naples, FL | 2.0 | 2.0 | 1496 | $4,451 | $2.98 | 13d | 1 | 0.86mi |
| 6680 Beach Resort Dr Unit 1214 Naples, FL | 2.0 | 2.0 | 1351 | $4,500 | $3.33 | 13d | 1 | 0.91mi |
| 1171 Tranquil Brook Dr Naples, FL | 2.0 | 2.0 | 1503 | $4,500 | $2.99 | 13d | 1 | 0.95mi |
| 9187 Celeste Dr Unit 1073494P Naples, FL | 2.0 | 2.0 | 1399 | $2,979 | $2.13 | 13d | 1 | 1.00mi |
| 1276 Enbrook Loop Naples, FL | 2.0 | 2.0 | 1503 | $5,000 | $3.33 | 23d | 1 | 1.02mi |
| 9175 Michael Cir #4 Naples, FL | 3.0 | 2.0 | 1639 | $3,195 | $1.95 | 13d | 1 | 1.03mi |
| 1078 Rolling Brook Ln Naples, FL | 2.0 | 2.0 | 1503 | $2,750 | $1.83 | 21d | 1 | 1.03mi |
| 6767 Pennyroyal Dr Naples, FL | 3.0 | 2.0 | 2185 | $10,500 | $4.81 | 23d | 1 | 1.03mi |
| 8540 Mystic Greens Way #305 Naples, FL | 2.0 | 2.0 | 1710 | $4,995 | $2.92 | 13d | 1 | 1.05mi |
| 1212 Enbrook Loop Naples, FL | 2.0 | 2.0 | 1496 | $2,850 | $1.91 | 23d | 1 | 1.08mi |
| 1555 Marton Ct Naples, FL | 3.0 | 2.0 | 1908 | $6,720 | $3.52 | 23d | 1 | 1.09mi |
| 8500 Mystic Greens Way Unit 5-505 Naples, FL | 3.0 | 2.5 | 2396 | $5,000 | $2.09 | 23d | 1 | 1.10mi |
| 9159 Delano St #9905 Naples, FL | 3.0 | 2.0 | 1770 | $4,995 | $2.82 | 23d | 1 | 1.11mi |
| 9022 Michael Cir Unit 2-205 Naples, FL | 2.0 | 2.0 | 1450 | $3,500 | $2.41 | 23d | 1 | 1.11mi |
| 9155 Delano St Unit 1545913P Naples, FL | 3.0 | 2.0 | 1797 | $3,871 | $2.15 | 13d | 1 | 1.12mi |
| 9151 Delano St #9702 Naples, FL | 3.0 | 2.5 | 1733 | $2,650 | $1.53 | 13d | 1 | 1.14mi |
| 1157 Enbrook Loop Naples, FL | 2.0 | 2.0 | 1503 | $3,000 | $2.00 | 23d | 1 | 1.14mi |
| 842 Enbrook Loop Naples, FL | 2.0 | 2.0 | 1503 | $2,800 | $1.86 | 23d | 1 | 1.15mi |
| 1599 Marton Ct Naples, FL | 2.0 | 2.0 | 1900 | $3,000 | $1.58 | 23d | 1 | 1.16mi |
| 847 Enbrook Loop Naples, FL | 2.0 | 2.0 | 1503 | $2,950 | $1.96 | 23d | 1 | 1.16mi |
| 8845 Lely Island Cir Naples, FL | 3.0 | 2.0 | 2373 | $12,500 | $5.27 | 23d | 1 | 1.18mi |
| 8340 Mystic Greens Way #1501 Naples, FL | 2.0 | 2.0 | 1880 | $4,995 | $2.66 | 23d | 1 | 1.20mi |
| 9118 Chula Vista St #12002 Naples, FL | 2.0 | 2.5 | 1531 | $4,200 | $2.74 | 23d | 1 | 1.23mi |
HOA detail condo
- Monthly dues
- $1,511 · $18,132/yr
- Assessments
- None detected in remarks — confirm with the listing agent.
Listing history 16 events
-
2026-06-18days on market $319,000 Active 127 DOM
-
2026-06-17days on market $319,000 Active 126 DOM
-
2026-06-16days on market $319,000 Active 125 DOM
-
2026-06-15days on market $319,000 Active 124 DOM
-
2026-06-14days on market $319,000 Active 122 DOM
-
2026-06-10days on market $319,000 Active 119 DOM
-
2026-06-09days on market $319,000 Active 118 DOM
-
2026-06-08days on market $319,000 Active 117 DOM
-
2026-06-07days on market $319,000 Active 116 DOM
-
2026-06-03days on market $319,000 Active 112 DOM
-
2026-06-02days on market $319,000 Active 111 DOM
-
2026-06-01days on market $319,000 Active 110 DOM
-
2026-05-31days on market $319,000 Active 109 DOM
-
2026-05-30days on market $319,000 Active 108 DOM
-
2026-04-02price $319,000
-
2026-02-11$339,000 Active
ⓘ Source: listings_history table (triggers on properties + properties_extension) + one-shot
backfill from property_details.listing_events for pre-trigger history.
Climate risk First Street
- Flood 9/10 Extreme FEMA zone AE · 99% chance over 30 yrs
- Wildfire 3/10 Moderate
- Heat 10/10 Extreme 7 d/yr ≥108°F today · 29 d/yr by 30 yrs out
- Wind 10/10 Extreme 99% chance of damaging wind over 30 yrs
- Air quality 2/10 Low 2 unhealthy d/yr today · 2 by 30 yrs out
Nearby sold comps map
Loading sold comps map…
Walkable amenities ~0.75 mi
Loading nearby amenities…
Taxation est. · year 1
- Rental income
- $56,533
- − Mortgage interest
- −$17,869
- − Property taxes
- −$4,785
- − Insurance
- −$6,714
- − Repairs & maintenance
- −$4,523
- − Management
- −$4,523
- − HOA
- −$18,132
- − Depreciation
- −$9,280
- Taxable loss
- −$9,292
- Est. tax savings @ 24.0%
- +$2,230
- After-tax cash flow
- $-2,814/yr
For passive investors: Depreciation is non-cash, so a rental often shows a tax loss while cash-flowing — sheltering income. Rental losses are passive: they offset passive income freely, and up to $25,000/yr can offset ordinary (W-2) income if you actively participate and your MAGI is under $100k (phasing out to $0 by $150k); unused losses carry forward. On sale, claimed depreciation is recaptured at up to 25%, and gains may owe capital-gains tax (a 1031 exchange can defer both). Figures are a year-1 estimate at your 24.0% rate — not tax advice; consult a CPA.
Schools (NCES district)
- District
- Collier
- NCES district ID
- 1200330
- Math proficiency
- 60% ▼ -4.00%
- Reading proficiency
- 56% ▼ -2.00%
- Median HH income
- $58,275
- Composite
- 50.23/100
- National rank
- #1892
- State rank
- #16 of 73 in FL
Livability — Lely Resort
- Score
- 61/100
- State rank
- #786
- US rank
- #17981
Category grades
Schools grade is shown separately in the Schools card above.
Census & demographics
- County
- Collier County · 396,295 people
- Metro
- Naples-Marco Island, FL
- Population (ZIP)
- 26,056
- Household income
- $81,674
- Rent vs Own
- Severe rent burden
- 954.0
Population outlook (Collier County) Hauer SSP2
- Today (2025)
- 420,858 people
- By 2030
- 450,054 · +6.9%
- By 2040
- 502,232 · +19.3%
- By 2050
- 544,932 · +29.5%
- By 2075
- 627,203 · +49.0%
- By 2100
- 659,015 · +56.6%
Race, ethnicity, and origin ACS 2023
- Neighborhood character
- Diverse neighborhood (Simpson 0.59)
- Race & ethnicity
- White 56% Hispanic / Latino 28% Black 12% Two or more races 11% Asian 2%
- Hispanic origin (detail)
- Mexican 17% Puerto Rican 3% Cuban 2%
- Common ancestry
- Hispanic 10% Romanian 3% Lithuanian 2%
- Foreign-born
- 26% · Canada, Jamaica, Vietnam
- Languages at home
- 63% English-only · Spanish 24% French/Haitian/Cajun 9% Other Indo-European 2%
Political lean MEDSL · Collier
- 2024 margin
- Solid R (+33.1) · D 33.1% · R 66.2%
- 2008→2024 swing
- -10.6pp toward R · 2008: -22.5pp · 2024: -33.1pp
- All cycles
- 2024: R+33.1 2020: R+24.7 2016: R+26.0 2012: R+30.1 2008: R+22.5
Not yet ingested
- Civics
- —
Market trends
- HPI YoY
- ▼ -194.86%
- Current HPI
- 279.4232
- Rent YoY
- ▲ 5.59%
- Metro
- Naples-Marco Island, FL
- State GDP YoY
- ▲ 3.28%
- F500 in state
- 36
Industry mix (Fortune 500 HQ in FL)
| Industry | F500 HQs | Revenue |
|---|---|---|
| Industrial Technology | 2 | $29B |
|
||
| Insurance | 2 | $17B |
|
||
| Retail | 1 | $60B |
|
||
| Technology Distribution | 1 | $58B |
|
||
| Homebuilding | 1 | $35B |
|
||
| Technology Manufacturing | 1 | $35B |
|
||
Price history
-5.9% since first listed2 events — show timeline
- 2026-04-02 Price Changed $319,000 NAPLESMLS
- 2026-02-11 Listed $339,000 NAPLESMLS
Cash-flow waterfall
monthlySold comps — $/sqft
last 12 mo · ≤1 miLoading sold comps…