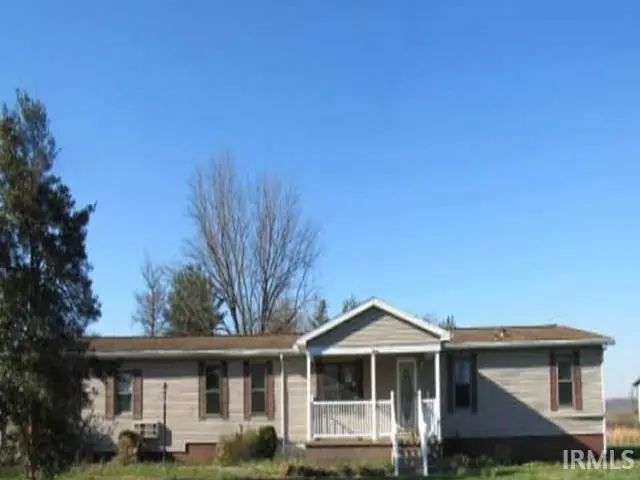
570 E Tennyson Rd · Boonville, IN
Flood risk 1/10 · Minimal
- FEMA flood zone
- X (unshaded)
- Chance of flooding over 30 yrs
- 0.0%
- Est. flood insurance / yr
- $507 – $1,088
Fire risk 1/10 · Minimal
- Est. fire insurance / yr
- $717 – $1,331
Heat risk 4/10 · Minor
- Hot days now (above 106°F)
- 7 days/yr
- Hot days in 30 yrs
- 18 days/yr
Wind risk 3/10 · Minor
- Chance of severe wind over 30 yrs
- 5.0%
Air-quality risk 3/10 · Minor
- Unhealthy air days now
- 2 days/yr
- Unhealthy air days in 30 yrs
- 3 days/yr
Risk factors via First Street. Map © Google.
Why this score? — see what drove the D grade
The composite is a weighted blend of 9 inputs, each scored 0–100. Each bar is that input's sub-score; the figure is the points it added to the 100-point composite (weight × sub-score).
- ARV discount +14.3/15.0
- Cash flow +10.0/30.0
- Schools +4.9/10.0
- Livability +3.3/5.0
- DSCR +2.8/10.0
- 1% rule +2.5/10.0
- Rent growth +2.5/5.0
- Condition / age +2.5/5.0
- Appreciation +0.0/10.0
$149,900
🖨 Deal sheet (PDF) 📄 Offer letter ✓ Due diligence
Listing remarks
Great opportunity to buy this ranch style manufactured home on a block foundation with a crawlspace, built in 1987, located in Boone Township near Boonville, IN with a 2 car detached garage and coming with 2 parcels totaling 2 acres. The interior has 1620 sq. ft. with 4 bedrooms and 2.5 bathrooms, living room, family room with fireplace plus a screened in back porch and covered front porch.
Key facts
- Covered front porch
- Crawlspace
- 1.5 acre lot
Tags
Property features AI
Exterior
- Parking: Detached 2-car garage
- Utilities: Private well water; Septic tank sewer
- Home design: Manufactured residential home; Single-story
- Construction: Vinyl siding; Block foundation; Built as a manufactured home
- Exterior features: Shingle roof; Lot includes approximately 2 acres; Lot listed with other/unspecified features
Interior
- Bathrooms: Two full bathrooms and one half bathroom (all on the main level)
- Heating & cooling: Electric heating; No central cooling listed
- Interior features: One fireplace located in the family room; Crawl space basement
Neighborhood map
What this means for you Summary
Snapshot
- This is a 4-bed/1.0-bath manufactured listed at $150k.
Deal economics
- At list price, monthly cash flow is $-91 ($-1k/yr) — negative.
- To cash-flow at today's rent, offer at most $134k (10.7% below list).
- To meet the 1% rule (rent ≥ 1% of price), the offer needs to be $113k (24.6% below list).
- Recommended offer: $113k (24.6% below list) — sets the bar for 1% rule.
- Cap rate 5.6% vs local median 3.5% in Boonville — top-decile yield for the area; either an underpriced asset or a hidden risk that comps aren't pricing in. Stress-test before assuming the spread holds.
Location & tenants
- Location reads 66/100 on livability (#278 in IN) — a middle-class / working-renter tenant base. Strengths: cost of living A+, housing A+; Watch: crime D+, amenities F, commute F.
- Warrick County School Corporation (suburban): math 54% / reading 59% proficiency, ranked #24 of 301 in IN (top 8%) — acceptable for families but not a draw, mixed tenant base, ~2y average lease.
- Zoned schools: Loge Elementary School (math 67% / reading 62%, grade B, #78 of 994 statewide, top 9%, 404 students, 54% FRL); Boonville Middle School (math 37% / reading 47%, grade D-, #102 of 330 statewide, top 32%, 700 students, 51% FRL); Boonville High School (math 32% / reading 60%, grade D-, #163 of 369 statewide, top 44%, 881 students, 44% FRL) — zoned schools average 49% FRL vs 24% district-wide (26 pts higher); higher-poverty schools than district average — tighter screening recommended.
- Market conditions: 160 active listings in the ZIP; 249 units permitted in Warrick County in 2024 (0 in 5+ unit buildings).
Forward outlook
- Local home prices are declining (-3.0%/yr); year-one equity from $1k of loan paydown is wiped out by about $4k of value loss. Plan a longer hold.
- Warrick County population projected at +9% by 2050 — modest demand growth; plan on rents tracking national, not racing it.
Negotiation context
- It's been on market 37 days — a 3% lower offer ($145k) is reasonable based on typical stale-listing flexibility.
Questions for the listing agent
- What do current leases actually rent for vs. the listed asking? Can we see a recent rent roll and the last 12 months of T-12 income?
- It's been on market 37 days. Have you received any prior offers? Is the seller open to a 25% concession, seller financing, or rate buy-down credit?
- Is there a deadline driving the sale (1031 exchange, divorce, estate, relocation)? That informs how much negotiation room exists.
- Crime grade is D in this area — have there been break-ins, vandalism, or insurance claims at this property in the last 3 years? What carrier currently insures it and at what premium?
- The area grade is low — what's the realistic commute time and amenity access for the typical tenant pool here? Any planned neighborhood developments (good or bad) we should know about?
- What's the average days-on-market for RENTAL listings here right now (not sales)? A rising rental-DOM trend means longer vacancies and softer asking-rent achievability than the comps imply.
- What's the recent tenant-quality profile in this submarket — average credit score on applications, eviction rate, late-payment / NSF rate, and stable-employment percentage? A property-management company in the area should have these aggregated.
- How much new for-sale + rental construction is in the pipeline within 1–3 miles? Heavy new supply typically softens prices + rents 12–24 months out; constrained supply supports both.
Investment metrics
- 1% rule
- 0.75% ✗
- Cap rate
- 5.57%
- Cash-on-cash
- -2.59%
- DSCR
- 0.88
- GRM
- 11.1
CMA / ARV
- ARV (median comp)
- $176,359
- List price
- $149,900
- Delta
- -15.00%
- Verdict
- UNDERPRICED
- Comps
- 1 within 2.0 mi
Projected returns pro-forma
-3.0% appreciation · 3.0% rent growth · sell at horizon
- IRR
- -20.6%
- Equity multiple
- 0.28×
- Total profit
- $-30,080
- Equity at exit
- $22,351
- IRR
- -13.9%
- Equity multiple
- 0.20×
- Total profit
- $-33,692
- Equity at exit
- $12,961
Cash invested: $41,972 (down + closing). Projections, not guarantees.
Landlord ↔ Tenant lean methodology
- Overall (STATE)
- 90 Strongly Landlord-Friendly
- State Indiana
- 90 Strongly Landlord-Friendly · R+11
- County
- — inherits STATE
- City
- — inherits STATE
ZIP-level market 47601
- Active inventory
- 160
- Price-to-rent
- 11.1×
Monthly cashflow live
- Estimated rent
- $1,130 medium interval (Pro) →
- Mortgage (P&I)
- −$786
- Tax from tax record
- −$135 /mo · $1,614/yr
- Insurance
- −$62
- HOA
- −$0
- Lot rent leased land?
- −$0
- Vacancy / Maint / Mgmt
- −$237
- Net cashflow
- $-91
Break-even live
Sensitivity live
| Price | -10% $-6 | -5% $-48 | +0% $-91 | +5% $-133 | +10% $-176 |
|---|---|---|---|---|---|
| Rent | -10% $-180 | -5% $-135 | +0% $-91 | +5% $-46 | +10% $-1 |
| Rate | -1.0pp $-15 | -0.5pp $-53 | base $-91 | +0.5pp $-130 | +1.0pp $-169 |
UW: 25.0% down · 7.5% · 30yr · 1.5% tax · 5.0% vac · 8.0% maint · 8.0% mgmt
Financing live
Cash to close
- Down payment
- $37,475
- Closing costs
- $4,497
- Reserves months
- —
- Total cash needed
- —
Loan-product check · same deal, 3 products live
Conventional
25% down · 7.5% · 30yr
- Down + closing
- —
- Monthly P&I
- —
- Monthly cashflow
- —
- DSCR
- —
- Eligible?
- —
Personal DTI + credit; lowest rate.
DSCR
20% down · 8.5% · 30yr
- Down + closing
- —
- Monthly P&I
- —
- Monthly cashflow
- —
- DSCR
- —
- Eligible?
- —
No personal income docs; deal must DSCR.
Hard money
10% down · 12.0% · 12mo
- Down + closing
- —
- Monthly P&I
- —
- Monthly cashflow
- —
- DSCR
- —
- Eligible?
- —
Short-term bridge; refi at stabilization.
Listing history 18 events
-
2026-06-22days on market $149,900 Active 37 DOM
-
2026-06-18days on market $149,900 Active 34 DOM
-
2026-06-17days on market $149,900 Active 33 DOM
-
2026-06-16remarks 393-char remark
-
2026-06-16days on market $149,900 Active 32 DOM
-
2026-06-15days on market $149,900 Active 31 DOM
-
2026-06-14days on market $149,900 Active 29 DOM
-
2026-06-13days on market $149,900 Active 28 DOM
-
2026-06-10days on market $149,900 Active 26 DOM
-
2026-06-09days on market $149,900 Active 25 DOM
-
2026-06-08days on market $149,900 Active 24 DOM
-
2026-06-07pricedays on market $149,900 Active 23 DOM
-
2026-06-02days on market $159,900 Active 18 DOM
-
2026-06-01days on market $159,900 Active 17 DOM
-
2026-05-31days on market $159,900 Active 16 DOM
-
2026-05-30days on market $159,900 Active 15 DOM
-
2026-05-15$159,900 Active 380-char remark
-
2026-02-19soldstatus $136,421
ⓘ Source: listings_history table (triggers on properties + properties_extension) + one-shot
backfill from property_details.listing_events for pre-trigger history.
Tax reassessment forecast IN · Partial reset (capped growth)
- Current annual tax
- $1,614 · $135/mo
- Projected year-2 tax
- $1,614 · $135/mo
- Expected delta
- $0/yr ($0/mo · 0.0%)
ⓘ Screening estimate from a state-policy table — verify with the county assessor before closing.
Climate risk First Street
- Flood 1/10 Low FEMA zone X (unshaded) · 0% chance over 30 yrs
- Wildfire 1/10 Low
- Heat 4/10 Moderate 7 d/yr ≥106°F today · 18 d/yr by 30 yrs out
- Wind 3/10 Moderate 5% chance of damaging wind over 30 yrs
- Air quality 3/10 Moderate 2 unhealthy d/yr today · 3 by 30 yrs out
Nearby sold comps map
Loading sold comps map…
Walkable amenities ~0.75 mi
Loading nearby amenities…
Taxation est. · year 1
- Rental income
- $13,555
- − Mortgage interest
- −$8,397
- − Property taxes
- −$1,614
- − Insurance
- −$750
- − Repairs & maintenance
- −$1,084
- − Management
- −$1,084
- − Depreciation
- −$4,361
- Taxable loss
- −$3,735
- Est. tax savings @ 24.0%
- +$896
- After-tax cash flow
- $-192/yr
For passive investors: Depreciation is non-cash, so a rental often shows a tax loss while cash-flowing — sheltering income. Rental losses are passive: they offset passive income freely, and up to $25,000/yr can offset ordinary (W-2) income if you actively participate and your MAGI is under $100k (phasing out to $0 by $150k); unused losses carry forward. On sale, claimed depreciation is recaptured at up to 25%, and gains may owe capital-gains tax (a 1031 exchange can defer both). Figures are a year-1 estimate at your 24.0% rate — not tax advice; consult a CPA.
Schools (NCES district)
- District
- Warrick County School Corporation
- NCES district ID
- 1812390
- Math proficiency
- 54% ▼ -8.00%
- Reading proficiency
- 59% ▼ -6.00%
- Median HH income
- $62,801
- Composite
- 49.38/100
- National rank
- #2014
- State rank
- #24 of 301 in IN
Livability — Boonville
- Score
- 66/100
- State rank
- #278
- US rank
- #11520
Category grades
Schools grade is shown separately in the Schools card above.
Census & demographics
- Population (ZIP)
- 13,119
Population outlook (Warrick County) Hauer SSP2
- Today (2025)
- 66,569 people
- By 2030
- 68,404 · +2.8%
- By 2040
- 71,131 · +6.9%
- By 2050
- 72,743 · +9.3%
- By 2075
- 76,088 · +14.3%
- By 2100
- 72,261 · +8.6%
Race, ethnicity, and origin ACS 2023
- Neighborhood character
- Predominantly White (95%)
- Race & ethnicity
- White 95% Two or more races 3% Hispanic / Latino 2%
- Common ancestry
- Slovak 2% Italian 1% Lithuanian 1%
- Foreign-born
- 0% · Canada
- Languages at home
- 99% English-only · Spanish 1%
Political lean MEDSL · Warrick
- 2024 margin
- Solid R (+30.2) · D 34.1% · R 64.3% · Other 1.5%
- 2008→2024 swing
- -17.4pp toward R · 2008: -12.8pp · 2024: -30.2pp
- All cycles
- 2024: R+30.2 2020: R+27.8 2016: R+33.9 2012: R+26.6 2008: R+12.8
Not yet ingested
- Civics
- —
Market trends
- HPI YoY
- ▼ -119.46%
- Current HPI
- 207.7817
- Rent YoY
- —
- Metro
- —
- State GDP YoY
- ▲ 2.90%
- F500 in state
- 18
Industry mix (Fortune 500 HQ in IN)
| Industry | F500 HQs | Revenue |
|---|---|---|
| Industrial Machinery | 2 | $37B |
|
||
| Healthcare | 1 | $177B |
|
||
| Pharmaceuticals | 1 | $45B |
|
||
| Metals / Steel | 1 | $18B |
|
||
| Agriculture | 1 | $17B |
|
||
| Packaging | 1 | $12B |
|
||
Price history
+9.9% since first listed3 events — show timeline
- 2026-06-05 Price Changed $149,900 IRMLS
- 2026-05-15 Listed $159,900 IRMLS
- 2026-02-19 Sold (Public Records) $136,421 Public Records
Property tax history
+11.8%/yrLatest (2024): $1,614 · +132.3% YoY. Source: county tax records.
Cash-flow waterfall
monthlySold comps — $/sqft
last 12 mo · ≤1 miLoading sold comps…