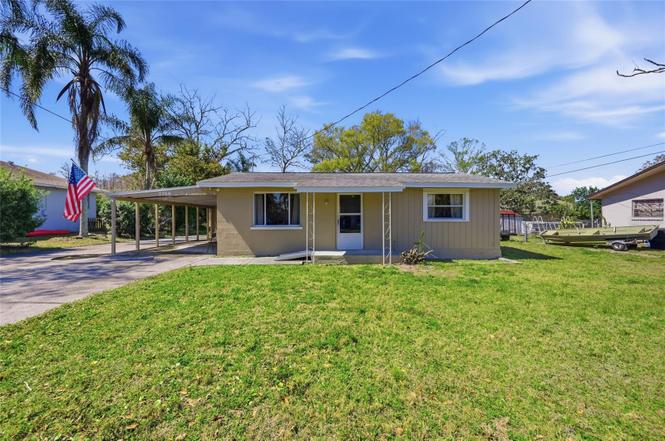
2768 Belle Haven Dr · Dunedin, FL
Flood risk 1/10 · Minimal
- FEMA flood zone
- X (unshaded)
- Chance of flooding over 30 yrs
- 0.0%
- Est. flood insurance / yr
- $507 – $1,088
Fire risk 1/10 · Minimal
- Est. fire insurance / yr
- $947 – $1,759
Heat risk 10/10 · Severe
- Hot days now (above 107°F)
- 7 days/yr
- Hot days in 30 yrs
- 26 days/yr
Wind risk 10/10 · Severe
- Chance of severe wind over 30 yrs
- 99.0%
Air-quality risk 3/10 · Minor
- Unhealthy air days now
- 3 days/yr
- Unhealthy air days in 30 yrs
- 3 days/yr
Risk factors via First Street. Map © Google.
Why this score? — see what drove the D+ grade
The composite is a weighted blend of 9 inputs, each scored 0–100. Each bar is that input's sub-score; the figure is the points it added to the 100-point composite (weight × sub-score).
- ARV discount +15.0/15.0
- Cash flow +14.1/30.0
- DSCR +4.3/10.0
- Schools +4.3/10.0
- Livability +4.3/5.0
- 1% rule +3.6/10.0
- Condition / age +2.5/5.0
- Rent growth +1.8/5.0
- Appreciation +0.0/10.0
$220,000
🖨 Deal sheet (PDF) 📄 Offer letter ✓ Due diligence
Listing remarks
INVESTOR SPECIAL, Prime Clearwater Location - sitting on a generous . 27-acre lot with a large backyard and serious upside potential. This property needs TLC and offers the perfect opportunity to rework the layout into a highly desirable 3-bedroom, 2-bathroom home. Located just 6 minutes from Downtown Dunedin, 1 minute from US-19 for easy access north and south, and approximately 15 minutes to the Gulf beaches, this is a value-add opportunity in a strong resale area. Bring your vision and contractor — the location, lot size, and potential make this one worth the effort. According to property records, the roof was replaced in 2009 and the HVAC in 2010.
Key facts
- Generous lot
- Large backyard
- Strong resale area
Tags
Neighborhood map
What this means for you Summary
Snapshot
- This is a 2-bed/1.0-bath single-family listed at $220k.
Deal economics
- At list price, monthly cash flow is $32 ($388/yr) — positive.
- The deal already cash-flows at list — no discount required.
- To meet the 1% rule (rent ≥ 1% of price), the offer needs to be $189k (14.3% below list).
- Recommended offer: $189k (14.3% below list) — sets the bar for 1% rule.
- Cap rate 6.5% vs local median 2.9% in Dunedin — top-decile yield for the area; either an underpriced asset or a hidden risk that comps aren't pricing in. Stress-test before assuming the spread holds.
Location & tenants
- Location reads 86/100 on livability (#15 in FL, #411 nationally) — a professional / high-income tenant draw. Strengths: crime A+, commute A+, housing A+; Watch: employment C-, amenities D.
- Pinellas (suburban): math 51% / reading 51% proficiency, ranked #31 of 73 in FL (top 42%) — acceptable for families but not a draw, mixed tenant base, ~2y average lease.
- Zoned schools: Garrison-Jones Elementary School (math 66% / reading 58%, grade B, #608 of 2,144 statewide, top 29%, 593 students, 46% FRL); Palm Harbor Middle School (math 59% / reading 57%, grade B, #151 of 571 statewide, top 27%, 1,080 students, 37% FRL); Dunedin High School (math 36% / reading 45%, grade F, #294 of 667 statewide, top 44%, 1,203 students, 48% FRL) — zoned schools at 44% FRL track the district average.
- Market conditions: Rents soft (-2.6%/yr); 293 active listings in the ZIP; 38 comparable units currently listed for rent nearby; rentals at typical pace (median 20d on market — plan ~3-4 weeks tenant-placement turnaround); 2,676 units permitted in Pinellas County in 2024 (1,422 in 5+ unit buildings).
- This rent runs 41% of the median local income ($55k/yr) — at the standard rent-burdened threshold; future hikes will face affordability resistance.
Forward outlook
- Local home prices are declining (-3.0%/yr); year-one equity from $2k of loan paydown is wiped out by about $7k of value loss. Plan a longer hold.
- Pinellas County population projected at +14% by 2050 — modest demand growth; plan on rents tracking national, not racing it.
Negotiation context
- Only 2 days on market — expect competitive offers; lowballing is unlikely to land.
- Current owner paid $58k; list at $220k implies a 276% gain — meaningful room to come down on a strong offer.
Risks & watch-outs
- Watch-outs: built in 1952 — expect roof / HVAC / electrical / plumbing capex.
- Climate carrying-cost: severe wind risk, 99% chance of damaging wind over 30y; extreme-heat days projected 7→26/yr by 2055 (HVAC capex compounding) — expect insurance premiums to compound above CPI over the hold.
Questions for the listing agent
- Built in 1952 — when were the roof, HVAC, electrical panel, plumbing, and water heater last replaced?
- Is there a deadline driving the sale (1031 exchange, divorce, estate, relocation)? That informs how much negotiation room exists.
- Schools are A-rated — typically a magnet for longer-tenancy family renters. What's the average tenant stay here, and is there a school-zone premium baked into asking?
- The area grade is low — what's the realistic commute time and amenity access for the typical tenant pool here? Any planned neighborhood developments (good or bad) we should know about?
- What's the average days-on-market for RENTAL listings here right now (not sales)? A rising rental-DOM trend means longer vacancies and softer asking-rent achievability than the comps imply.
- What's the recent tenant-quality profile in this submarket — average credit score on applications, eviction rate, late-payment / NSF rate, and stable-employment percentage? A property-management company in the area should have these aggregated.
- How much new for-sale + rental construction is in the pipeline within 1–3 miles? Heavy new supply typically softens prices + rents 12–24 months out; constrained supply supports both.
Investment metrics
- 1% rule
- 0.86% ✗
- Cap rate
- 6.47%
- Cash-on-cash
- 0.63%
- DSCR
- 1.03
- GRM
- 9.7
CMA / ARV
- ARV (on-the-fly)
- $276,930
- Comps found
- 12
Show comp detail 12 sales within ~0.75 mi
| Address | Dist | Beds/Ba | Sqft | Sold | Price | $/sf | Match |
|---|---|---|---|---|---|---|---|
| 2502 Laurelwood Dr Unit 3B | 0.68mi | 2/2.0 | 1,058 (-3%) | 6mo | $148,500 | $140 | 55 |
| 2584 Laurelwood Dr Unit 15C | 0.48mi | 2/2.0 | 980 (-10%) | 3mo | $257,000 | $262 | 55 |
| 2545 Laurelwood Dr Unit 9C | 0.55mi | 2/2.0 | 1,030 (-5%) | 16mo | $243,000 | $236 | 49 |
| 2589 Redwood Cir | 0.65mi | 2/1.5 | 1,198 (+10%) | 3mo | $379,900 | $317 | 48 |
| 2585 Bay Berry Dr Unit 43D | 0.50mi | 2/2.0 | 940 (-13%) | 6mo | $244,000 | $260 | 46 |
| 2573 Oakleaf Ln Unit 39A | 0.56mi | 2/2.0 | 940 (-13%) | 3mo | $229,900 | $245 | 45 |
| 2612 Sycamore Dr | 0.40mi | 2/2.0 | 1,215 (+12%) | 16mo | $285,000 | $235 | 44 |
| 27466 US Highway 19 N #109 | 0.18mi | 3/2.0 (+1) | 1,248 (+15%) | 23mo | $85,000 | $68 | 38 |
| 2513 Oakleaf Ln Unit 26C | 0.69mi | 2/2.0 | 980 (-10%) | 12mo | $250,000 | $255 | 38 |
| 2489 Oakleaf Ln Unit 21C | 0.71mi | 2/2.0 | 960 (-12%) | 13mo | $240,000 | $250 | 33 |
| 2577 Blackwood Cir | 0.65mi | 2/2.0 | 1,220 (+12%) | 20mo | $355,000 | $291 | 28 |
| 2586 Blackwood Cir | 0.67mi | 2/2.0 | 1,220 (+12%) | 22mo | $370,000 | $303 | 26 |
Match score weights: distance 35% · size 25% · config 20% · recency 20%. Top-matched comps best support the ARV.
Projected returns pro-forma
-3.0% appreciation · 0.0% rent growth · sell at horizon
- IRR
- -18.6%
- Equity multiple
- 0.36×
- Total profit
- $-39,126
- Equity at exit
- $32,803
- IRR
- -18.2%
- Equity multiple
- 0.14×
- Total profit
- $-52,814
- Equity at exit
- $19,022
Cash invested: $61,600 (down + closing). Projections, not guarantees.
Landlord ↔ Tenant lean methodology
- Overall (STATE)
- 87 Strongly Landlord-Friendly
- State Florida
- 87 Strongly Landlord-Friendly · R+3
- County
- — inherits STATE
- City
- — inherits STATE
ZIP-level market 33763
- Rents YoY
- -2.6%
- Active inventory
- 293
- Price-to-rent
- 9.7×
Monthly cashflow live
- Estimated rent
- $1,885 high interval (Pro) →
- Mortgage (P&I)
- −$1,154
- Tax from tax record
- −$212 /mo · $2,540/yr
- Insurance
- −$92
- HOA
- −$0
- Vacancy / Maint / Mgmt
- −$396
- Net cashflow
- $32
Break-even live
Sensitivity live
| Price | -10% $157 | -5% $95 | +0% $32 | +5% $-30 | +10% $-92 |
|---|---|---|---|---|---|
| Rent | -10% $-117 | -5% $-42 | +0% $32 | +5% $107 | +10% $181 |
| Rate | -1.0pp $143 | -0.5pp $88 | base $32 | +0.5pp $-25 | +1.0pp $-83 |
UW: 25.0% down · 7.5% · 30yr · 1.5% tax · 5.0% vac · 8.0% maint · 8.0% mgmt
Financing live
Cash to close
- Down payment
- $55,000
- Closing costs
- $6,600
- Reserves months
- —
- Total cash needed
- —
Loan-product check · same deal, 3 products live
Conventional
25% down · 7.5% · 30yr
- Down + closing
- —
- Monthly P&I
- —
- Monthly cashflow
- —
- DSCR
- —
- Eligible?
- —
Personal DTI + credit; lowest rate.
DSCR
20% down · 8.5% · 30yr
- Down + closing
- —
- Monthly P&I
- —
- Monthly cashflow
- —
- DSCR
- —
- Eligible?
- —
No personal income docs; deal must DSCR.
Hard money
10% down · 12.0% · 12mo
- Down + closing
- —
- Monthly P&I
- —
- Monthly cashflow
- —
- DSCR
- —
- Eligible?
- —
Short-term bridge; refi at stabilization.
Rent comps 38 comps
| Address | Beds | Baths | Sqft | Rent | $/sqft | DOM | Units | Dist |
|---|---|---|---|---|---|---|---|---|
| 2780 Cypress Dr Unit A Clearwater, FL | 2.0 | 1.0 | 900 | $1,749 | $1.94 | 23d | 1 | 0.07mi |
| 2780 Park Dr Unit D 4 Clearwater, FL | 2.0 | 1.5 | 900 | $1,625 | $1.81 | 26d | 1 | 0.07mi |
| 2307 Cumberland Cir Clearwater, FL | 1.0–2.0 | 1.0–2.0 | 873 | $2,099 | $2.40 | 5d | 15 | 0.15mi |
| 1430 Heather Ridge Blvd #304 Dunedin, FL | 1.0 | 1.0 | 915 | $1,500 | $1.64 | 26d | 1 | 0.44mi |
| 2257 Palmwood Dr Dunedin, FL | 3.0 | 2.0 | 1150 | $2,475 | $2.15 | 6d | 1 | 0.49mi |
| 2524 Alexander Pl Clearwater, FL | 1.0–2.0 | 1.0–2.0 | 948 | $2,410 | $2.54 | 0d | 20 | 0.65mi |
| 28488 U.S. 19 Unit 150 Clearwater, FL | 3.0 | 1.5 | 990 | $1,500 | $1.52 | 13d | 1 | 0.66mi |
| 305 Hammock Pine Blvd #305 Clearwater, FL | 1.0 | 1.5 | 760 | $1,500 | $1.97 | 26d | 1 | 0.68mi |
| 2971 Estancia Blvd #321 Clearwater, FL | 2.0 | 2.0 | 995 | $1,975 | $1.98 | 6d | 1 | 0.74mi |
| 3052 Park Ln Unit B Dunedin, FL | 2.0 | 1.0 | 821 | $1,625 | $1.98 | 0d | 1 | 0.75mi |
| 3055 Belcher Rd Dunedin, FL | 2.0 | 1.0 | 750 | $1,345 | $1.79 | 23d | 1 | 0.75mi |
| 2581 Countryside Blvd Unit 304 Clearwater, FL | 2.0 | 2.0 | 1200 | $2,100 | $1.75 | 26d | 1 | 0.87mi |
| 2999 Fieldbrook Pl Clearwater, FL | 2.0 | 2.0 | 1164 | $2,300 | $1.98 | 26d | 1 | 0.90mi |
| 2500 Winding Creek Blvd Clearwater, FL | 2.0 | 2.0 | 946 | $1,675 | $1.77 | 5d | 2 | 0.92mi |
| 2500 Winding Creek Blvd Clearwater, FL | 1.0–2.0 | 1.0–2.0 | 812 | $1,700 | $2.09 | 4d | 3 | 0.92mi |
| 2500 Winding Creek Blvd Unit C205 Clearwater, FL | 2.0 | 2.0 | 946 | $1,700 | $1.80 | 6d | 1 | 0.93mi |
| 2228 Richter St Unit A Dunedin, FL | 2.0 | 2.0 | 1225 | $1,900 | $1.55 | 26d | 1 | 1.02mi |
| 2138 Timber Ln Clearwater, FL | 2.0 | 2.0 | 1348 | $2,800 | $2.08 | 26d | 1 | 1.02mi |
| 2673 Sabal Springs Cir #201 Clearwater, FL | 1.0 | 1.5 | 805 | $2,675 | $3.32 | 9d | 1 | 1.02mi |
| 2384 Tahitian Ln #28 Clearwater, FL | 2.0 | 2.0 | 1400 | $1,700 | $1.21 | 26d | 1 | 1.04mi |
| 2386 Sumatran Way #14 Clearwater, FL | 2.0 | 2.0 | 1100 | $1,600 | $1.45 | 19d | 1 | 1.06mi |
| 1602 Amberlea Dr S Dunedin, FL | 1.0 | 1.0 | 725 | $2,400 | $3.31 | 0d | 1 | 1.07mi |
| 1580 Andover Dr Unit House Dunedin, FL | 2.0 | 1.0 | 1241 | $2,200 | $1.77 | 26d | 1 | 1.10mi |
| 2323 Surrey Ln Clearwater, FL | 2.0 | 2.0 | 1280 | $2,250 | $1.76 | 23d | 1 | 1.12mi |
| 2471 Sumatran Way Clearwater, FL | 2.0 | 2.0 | 1400 | $1,500 | $1.07 | 19d | 2 | 1.13mi |
| 1515 County Road 1 Dunedin, FL | 1.0–2.0 | 1.0 | 719 | $1,750 | $2.43 | 9d | 1 | 1.14mi |
| 2713 Countryside Blvd #108 Clearwater, FL | 2.0 | 2.0 | 1100 | $1,850 | $1.68 | 4d | 1 | 1.15mi |
| 2561 Forest Run Ct Clearwater, FL | 3.0 | 2.0 | 1145 | $2,000 | $1.75 | 4d | 1 | 1.21mi |
| 2460 Persian Dr #44 Clearwater, FL | 2.0 | 2.0 | 1100 | $1,800 | $1.64 | 6d | 1 | 1.21mi |
| 373 Majesty Dr Unit 373 Clearwater, FL | 2.0 | 2.0 | 1200 | $1,600 | $1.33 | 26d | 1 | 1.24mi |
| 2363 Israeli Dr #67 Clearwater, FL | 2.0 | 2.0 | 1100 | $1,600 | $1.45 | 26d | 1 | 1.25mi |
| 2690 Enterprise Rd E Clearwater, FL | 1.0–2.0 | 1.0–2.0 | 1051 | $2,463 | $2.34 | 0d | 11 | 1.29mi |
| 3216 Pine Haven Dr Clearwater, FL | 3.0 | 2.5 | 1316 | $3,500 | $2.66 | 0d | 1 | 1.31mi |
| 2262 Swedish Dr #10 Clearwater, FL | 2.0 | 2.0 | 1115 | $2,000 | $1.79 | 26d | 1 | 1.32mi |
| 2005 Greenbriar Blvd #1 Clearwater, FL | 2.0 | 2.0 | 930 | $1,500 | $1.61 | 6d | 1 | 1.34mi |
| 2405 Franciscan Dr #23 Clearwater, FL | 2.0 | 2.0 | 1400 | $1,875 | $1.34 | 22d | 1 | 1.43mi |
| 2400 Franciscan Dr #44 Clearwater, FL | 1.0 | 1.0 | 735 | $1,200 | $1.63 | 26d | 1 | 1.43mi |
| 25350 US Highway 19 N Clearwater, FL | 3.0 | 1.0–2.0 | 875 | $1,732 | $1.98 | 0d | 34 | 1.48mi |
Listing history 3 events
-
2026-03-04status Pending
-
2026-03-02$220,000 Active
-
1993-09-01soldstatus $58,500
ⓘ Source: listings_history table (triggers on properties + properties_extension) + one-shot
backfill from property_details.listing_events for pre-trigger history.
Tax reassessment forecast FL · Resets to sale price
- Current annual tax
- $2,540 · $212/mo
- Projected year-2 tax
- $2,540 · $212/mo
- Expected delta
- $0/yr ($0/mo · 0.0%)
ⓘ Screening estimate from a state-policy table — verify with the county assessor before closing.
Climate risk First Street
- Flood 1/10 Low FEMA zone X (unshaded) · 0% chance over 30 yrs
- Wildfire 1/10 Low
- Heat 10/10 Extreme 7 d/yr ≥107°F today · 26 d/yr by 30 yrs out
- Wind 10/10 Extreme 99% chance of damaging wind over 30 yrs
- Air quality 3/10 Moderate 3 unhealthy d/yr today · 3 by 30 yrs out
Nearby sold comps map
Loading sold comps map…
Walkable amenities ~0.75 mi
Loading nearby amenities…
Taxation est. · year 1
- Rental income
- $22,624
- − Mortgage interest
- −$12,323
- − Property taxes
- −$2,540
- − Insurance
- −$1,100
- − Repairs & maintenance
- −$1,810
- − Management
- −$1,810
- − Depreciation
- −$6,400
- Taxable loss
- −$3,360
- Est. tax savings @ 24.0%
- +$806
- After-tax cash flow
- $1,194/yr
For passive investors: Depreciation is non-cash, so a rental often shows a tax loss while cash-flowing — sheltering income. Rental losses are passive: they offset passive income freely, and up to $25,000/yr can offset ordinary (W-2) income if you actively participate and your MAGI is under $100k (phasing out to $0 by $150k); unused losses carry forward. On sale, claimed depreciation is recaptured at up to 25%, and gains may owe capital-gains tax (a 1031 exchange can defer both). Figures are a year-1 estimate at your 24.0% rate — not tax advice; consult a CPA.
Schools (NCES district)
- District
- Pinellas
- NCES district ID
- 1201560
- Math proficiency
- 51% ▼ -5.00%
- Reading proficiency
- 51% ▼ -3.00%
- Median HH income
- $46,270
- Composite
- 43.27/100
- National rank
- #3046
- State rank
- #31 of 73 in FL
Livability — Dunedin
- Score
- 86/100
- State rank
- #15
- US rank
- #411
Category grades
Schools grade is shown separately in the Schools card above.
Census & demographics
- County
- Pinellas County · 939,478 people
- City population
- 38,171
- Metro
- Tampa-St. Petersburg-Clearwater, FL
- Population (ZIP)
- 21,146
- Household income
- $54,794
- Rent vs Own
- Severe rent burden
- 753.0
Population outlook (Pinellas County) Hauer SSP2
- Today (2025)
- 1,027,532 people
- By 2030
- 1,063,586 · +3.5%
- By 2040
- 1,125,020 · +9.5%
- By 2050
- 1,168,637 · +13.7%
- By 2075
- 1,265,188 · +23.1%
- By 2100
- 1,260,357 · +22.7%
Race, ethnicity, and origin ACS 2023
- Neighborhood character
- Predominantly White (72%)
- Race & ethnicity
- White 72% Hispanic / Latino 17% Two or more races 9% Black 4% Asian 2%
- Hispanic origin (detail)
- Mexican 5% Puerto Rican 3% Cuban 1%
- Common ancestry
- Romanian 3% Lithuanian 2% Slovak 2%
- Foreign-born
- 15% · Canada, Jamaica, Vietnam
- Languages at home
- 81% English-only · Spanish 10% Other Indo-European 3% Russian/Polish/Slavic 1%
Political lean MEDSL · Pinellas
- 2024 margin
- Lean R (+5.2) · D 46.9% · R 52.1%
- 2008→2024 swing
- -13.5pp toward R · 2008: 8.3pp · 2024: -5.2pp
- All cycles
- 2024: R+5.2 2020: D+0.2 2016: R+1.1 2012: D+5.6 2008: D+8.3
Not yet ingested
- Civics
- —
Market trends
- HPI YoY
- ▼ -439.90%
- Current HPI
- 265.3099
- Rent YoY
- ▼ -2.63%
- Metro
- Tampa-St. Petersburg-Clearwater, FL
- State GDP YoY
- ▲ 3.28%
- F500 in state
- 36
Industry mix (Fortune 500 HQ in FL)
| Industry | F500 HQs | Revenue |
|---|---|---|
| Industrial Technology | 2 | $29B |
|
||
| Insurance | 2 | $17B |
|
||
| Retail | 1 | $60B |
|
||
| Technology Distribution | 1 | $58B |
|
||
| Homebuilding | 1 | $35B |
|
||
| Technology Manufacturing | 1 | $35B |
|
||
Price history
+276.1% since first listed3 events — show timeline
- 2026-03-04 Pending — Stellar MLS as Distributed by MLS Grid
- 2026-03-02 Listed $220,000 Stellar MLS as Distributed by MLS Grid
- 1993-09-01 Sold (Public Records) $58,500 Public Records
Property tax history
+3.6%/yrLatest (2025): $2,540 · +13.0% YoY. Source: county tax records.
Cash-flow waterfall
monthlySold comps — $/sqft
last 12 mo · ≤1 miLoading sold comps…