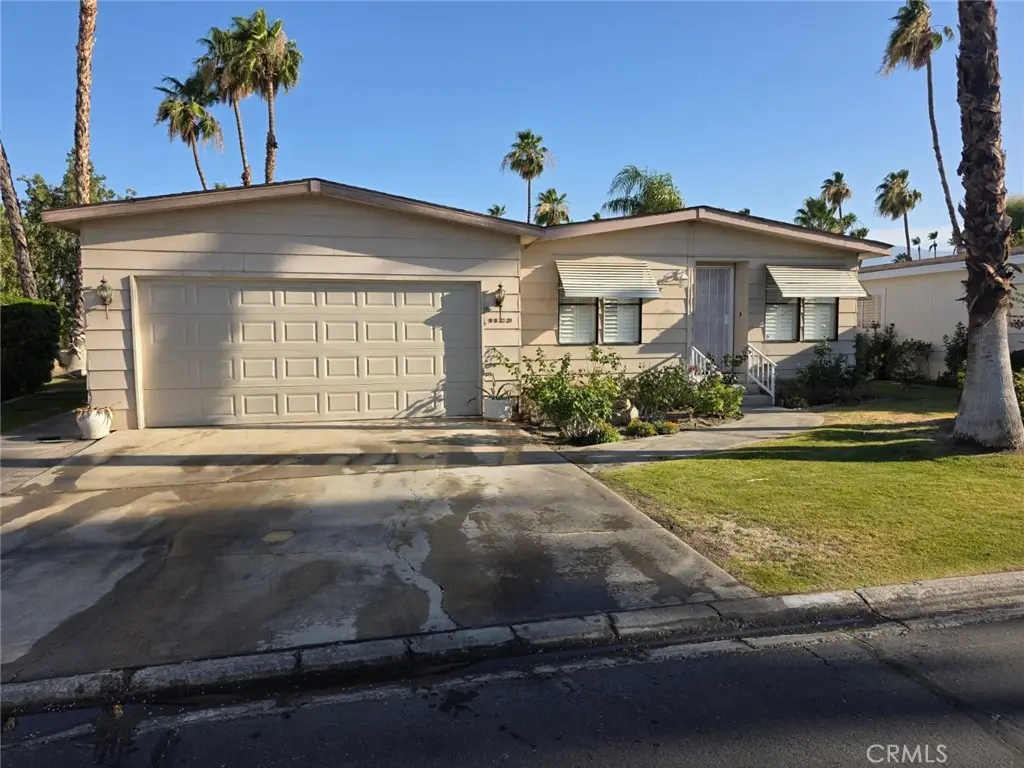
1123 Via Grande · Cathedral City, CA
Flood risk 1/10 · Minimal
- FEMA flood zone
- X (unshaded)
- Chance of flooding over 30 yrs
- 0.0%
- Est. flood insurance / yr
- $507 – $1,088
Fire risk 1/10 · Minimal
- Est. fire insurance / yr
- $659 – $1,223
Heat risk 9/10 · Severe
- Hot days now (above 113°F)
- 7 days/yr
- Hot days in 30 yrs
- 20 days/yr
Wind risk 1/10 · Minimal
- Chance of severe wind over 30 yrs
- —
Air-quality risk 5/10 · Moderate
- Unhealthy air days now
- 6 days/yr
- Unhealthy air days in 30 yrs
- 8 days/yr
Risk factors via First Street. Map © Google.
Why this score? — see what drove the B+ grade
The composite is a weighted blend of 9 inputs, each scored 0–100. Each bar is that input's sub-score; the figure is the points it added to the 100-point composite (weight × sub-score).
- Cash flow +30.0/30.0
- ARV discount +15.0/15.0
- 1% rule +10.0/10.0
- DSCR +10.0/10.0
- Rent growth +3.3/5.0
- Livability +3.3/5.0
- Schools +2.7/10.0
- Condition / age +2.5/5.0
- Appreciation +0.0/10.0
$99,999
🖨 Deal sheet (PDF) 📄 Offer letter ✓ Due diligence
Listing remarks
Welcome home to this charming and lovingly cared-for mobile home, where comfort and convenience come together beautifully. Filled with natural light, the bright and open floor plan creates a warm, inviting atmosphere that feels welcoming from the moment you step inside. Thoughtful updates include fresh paint, new carpet, a newer HVAC system, newer roof, and a new gas meter, offering both style and peace of mind. With all Whirlpool appliances included and every detail well maintained, this delightful home is ready for its next owner to move in and enjoy. Professional photos coming soon.
Key facts
- Garage
- Community pool
- Built 1981
Property features AI
Finance
- Other: Living area source: assessor's data; Builder: Robert's Home
- Financial info: Land lease approximately $925 per month (park-reported)
- HOA & community: Senior community; Land lease through the park
Exterior
- Parking: Attached garage (1 garage space, 1 total parking space); Located in Desert Sands Mobile Home park
- Security: Gated community
- Utilities: Public sewer; District/public water
- Home design: Single-story mobile home; Mobile dimensions approximately 12 ft by 44 ft; Entry level is the first floor
- Construction: Mobile home remains on site; Single-story (1 total story); Year built per public records
- Exterior features: Community pool; Mountainous neighborhood setting; Has a view
Interior
- Bedrooms: All bedrooms located on the main level
- Bathrooms: 2 full bathrooms
- Heating & cooling: Central furnace heating; Central air conditioning
- Interior features: One-level home with front-door entry; Gated community; All bedrooms on main level; Central heating (furnace); Central cooling
- Laundry & utility: Inside laundry with washer and dryer included
Neighborhood map
What this means for you Summary
Snapshot
- This is a 2-bed/2.0-bath manufactured listed at $100k.
Deal economics
- At list price, monthly cash flow is $1k ($16k/yr) — positive.
- The deal already cash-flows at list — no discount required.
- Meets the 1% rule at list price ($2k rent vs $100k).
- Cap rate 21.9% vs local median 5.1% in Cathedral City — top-decile yield for the area; either an underpriced asset or a hidden risk that comps aren't pricing in. Stress-test before assuming the spread holds.
Location & tenants
- Location reads 66/100 on livability (#344 in CA) — a middle-class / working-renter tenant base. Strengths: commute A+, housing B+; Watch: employment D+, schools F, amenities D-.
- Palm Springs Unified (suburban): math 21% / reading 42% proficiency, ranked #328 of 517 in CA (top 63%) — families likely to look elsewhere, expect single-tenant / working-renter base with shorter leases; 73% free/reduced lunch — lower-income household profile, screen leases tightly.
- Market conditions: Rents rising (+3.2%/yr); 530 active listings in the ZIP; 40 comparable units currently listed for rent nearby; rentals at typical pace (median 25d on market — plan ~3-4 weeks tenant-placement turnaround); 9,195 units permitted in Riverside County in 2024 (1,512 in 5+ unit buildings).
- This rent runs 39% of the median local income ($74k/yr) — at the standard rent-burdened threshold; future hikes will face affordability resistance.
Forward outlook
- Local home prices are declining (-3.0%/yr); year-one equity from $691 of loan paydown is wiped out by about $3k of value loss. Plan a longer hold.
- Riverside County population projected at +22% by 2050 — long-run rental-demand tailwind backs the buy-and-hold thesis.
- At projected returns (-3.0% appreciation + 3.2% rent growth), your $28k cash investment doubles in ~3 years — after that, you're playing with house money.
Negotiation context
- Only 3 days on market — expect competitive offers; lowballing is unlikely to land.
Risks & watch-outs
- Climate carrying-cost: extreme-heat days projected 7→20/yr by 2055 (HVAC capex compounding) — expect insurance premiums to compound above CPI over the hold.
Questions for the listing agent
- Is there a deadline driving the sale (1031 exchange, divorce, estate, relocation)? That informs how much negotiation room exists.
- Schools are F-rated, which usually means shorter tenancies and higher turnover. Who's the typical renter profile here, and what's been the actual vacancy rate?
- What's the average days-on-market for RENTAL listings here right now (not sales)? A rising rental-DOM trend means longer vacancies and softer asking-rent achievability than the comps imply.
- What's the recent tenant-quality profile in this submarket — average credit score on applications, eviction rate, late-payment / NSF rate, and stable-employment percentage? A property-management company in the area should have these aggregated.
- How much new for-sale + rental construction is in the pipeline within 1–3 miles? Heavy new supply typically softens prices + rents 12–24 months out; constrained supply supports both.
Investment metrics
- 1% rule
- 2.41% ✓
- Cap rate
- 21.94%
- Cash-on-cash
- 55.87%
- DSCR
- 3.49
- GRM
- 3.5
CMA / ARV
- ARV (on-the-fly)
- $127,776
- Comps found
- 11
Show comp detail 11 sales within ~0.75 mi
| Address | Dist | Beds/Ba | Sqft | Sold | Price | $/sf | Match |
|---|---|---|---|---|---|---|---|
| 1128 Via Grande | 0.06mi | 2/2.0 | 1,056 (0%) | 10mo | $145,000 | $137 | 89 |
| 1215 Via Yolo | 0.17mi | 2/2.0 | 1,056 (0%) | 11mo | $172,000 | $163 | 83 |
| 1139 Via Feliz | 0.08mi | 2/2.0 | 960 (-9%) | 4mo | $75,000 | $78 | 78 |
| 1051 Via Grande | 0.13mi | 2/2.0 | 1,152 (+9%) | 2mo | $99,000 | $86 | 77 |
| 1035 Via Grande | 0.22mi | 2/2.0 | 1,056 (0%) | 16mo | $128,200 | $121 | 77 |
| 1048 Via Grande | 0.15mi | 2/2.0 | 1,152 (+9%) | 2mo | $132,000 | $115 | 77 |
| 1142 Via Feliz | 0.03mi | 2/1.0 | 960 (-9%) | 4mo | $65,000 | $68 | 76 |
| 1226 Via Grande #147 | 0.22mi | 2/2.0 | 1,056 (0%) | 17mo | $135,000 | $128 | 76 |
| 1024 VíA Grande | 0.22mi | 2/2.0 | 1,056 (0%) | 22mo | $150,000 | $142 | 71 |
| 1223 Via Yolo | 0.21mi | 2/2.0 | 960 (-9%) | 10mo | $175,000 | $182 | 66 |
| 1228 Via Grande | 0.21mi | 2/1.5 | 1,100 (+4%) | 22mo | $105,000 | $95 | 63 |
Match score weights: distance 35% · size 25% · config 20% · recency 20%. Top-matched comps best support the ARV.
Projected returns pro-forma
-3.0% appreciation · 3.22% rent growth · sell at horizon
- IRR
- 54.4%
- Equity multiple
- 3.41×
- Total profit
- $67,340
- Equity at exit
- $14,910
- IRR
- 59.6%
- Equity multiple
- 6.99×
- Total profit
- $167,669
- Equity at exit
- $8,646
Cash invested: $28,000 (down + closing). Projections, not guarantees.
Landlord ↔ Tenant lean methodology
- Overall (STATE)
- 18 Strongly Tenant-Friendly
- State California
- 18 Strongly Tenant-Friendly · D+13
- County
- — inherits STATE
- City
- — inherits STATE
ZIP-level market 92234
- Home prices YoY
- -27.7%
- Rents YoY
- 3.2%
- Active inventory
- 530
- Price-to-rent
- 3.5×
Monthly cashflow live
- Estimated rent
- $2,407 high interval (Pro) →
- Mortgage (P&I)
- −$524
- Tax from tax record
- −$32 /mo · $378/yr
- Insurance
- −$42
- HOA
- −$0
- Vacancy / Maint / Mgmt
- −$505
- Net cashflow
- $1,304
Break-even live
Sensitivity live
| Price | -10% $1,360 | -5% $1,332 | +0% $1,304 | +5% $1,275 | +10% $1,247 |
|---|---|---|---|---|---|
| Rent | -10% $1,114 | -5% $1,209 | +0% $1,304 | +5% $1,399 | +10% $1,494 |
| Rate | -1.0pp $1,354 | -0.5pp $1,329 | base $1,304 | +0.5pp $1,278 | +1.0pp $1,251 |
UW: 25.0% down · 7.5% · 30yr · 1.5% tax · 5.0% vac · 8.0% maint · 8.0% mgmt
Financing live
Cash to close
- Down payment
- $25,000
- Closing costs
- $3,000
- Reserves months
- —
- Total cash needed
- —
Loan-product check · same deal, 3 products live
Conventional
25% down · 7.5% · 30yr
- Down + closing
- —
- Monthly P&I
- —
- Monthly cashflow
- —
- DSCR
- —
- Eligible?
- —
Personal DTI + credit; lowest rate.
DSCR
20% down · 8.5% · 30yr
- Down + closing
- —
- Monthly P&I
- —
- Monthly cashflow
- —
- DSCR
- —
- Eligible?
- —
No personal income docs; deal must DSCR.
Hard money
10% down · 12.0% · 12mo
- Down + closing
- —
- Monthly P&I
- —
- Monthly cashflow
- —
- DSCR
- —
- Eligible?
- —
Short-term bridge; refi at stabilization.
Rent comps 40 comps
| Address | Beds | Baths | Sqft | Rent | $/sqft | DOM | Units | Dist |
|---|---|---|---|---|---|---|---|---|
| 32425 Rancho Vista Dr Unit A Cathedral City, CA | 2.0 | 1.0 | 754 | $1,950 | $2.59 | 8d | 1 | 0.23mi |
| 32585 Cielo Vista Rd Cathedral City, CA | 2.0 | 2.0 | 840 | $2,000 | $2.38 | 25d | 1 | 0.29mi |
| 69150 San Susanna Ave Cathedral City, CA | 3.0 | 2.0 | 1290 | $2,700 | $2.09 | 0d | 1 | 0.39mi |
| 32150 Aurora Vista Rd Unit C Cathedral City, CA | 2.0 | 1.0 | 1100 | $2,395 | $2.18 | 44d | 1 | 0.41mi |
| 32150 Aurora Vista Rd Cathedral City, CA | 2.0 | 1.0 | 1100 | $2,195 | $2.00 | 44d | 1 | 0.41mi |
| 33255 Date Palm Dr Cathedral City, CA | 2.0 | 2.0 | 1050 | $1,795 | $1.71 | 44d | 1 | 0.43mi |
| 32200 Cathedral Canyon Dr #31 Cathedral City, CA | 1.0 | 1.0 | 740 | $1,550 | $2.09 | 25d | 1 | 0.58mi |
| 69155 Dinah Shore Dr Apt 20 Cathedral City, CA | 2.0 | 2.0 | 1200 | $2,050 | $1.71 | 44d | 1 | 0.79mi |
| 33495 Cathedral Canyon Dr Cathedral City, CA | 2.0 | 1.0 | 1100 | $2,200 | $2.00 | 44d | 1 | 0.79mi |
| 33495 Cathedral Canyon Dr Unit B Cathedral City, CA | 2.0 | 1.0 | 1100 | $2,100 | $1.91 | 44d | 1 | 0.79mi |
| 69155 Dinah Shore Dr Cathedral City, CA | 2.0 | 2.0 | 1100 | $1,795 | $1.63 | 44d | 1 | 0.80mi |
| 69275 Kemper Ct Cathedral City, CA | 3.0 | 2.0 | 1386 | $3,850 | $2.78 | 44d | 1 | 0.89mi |
| 34073 Emily Way Rancho Mirage, CA | 2.0 | 2.0 | 966 | $2,100 | $2.17 | 22d | 1 | 0.91mi |
| 34073 Emily Way Rancho Mirage, CA | 2.0 | 2.0 | 966 | $2,100 | $2.17 | 19d | 1 | 0.91mi |
| 34071 Denise Way Rancho Mirage, CA | 3.0 | 2.0 | 1218 | $2,599 | $2.13 | 25d | 1 | 0.94mi |
| 69180 Victoria Dr #8 Cathedral City, CA | 3.0 | 2.0 | 1230 | $1,995 | $1.62 | 3d | 1 | 0.94mi |
| 33030 Shifting Sands Trl Apt 4 Cathedral City, CA | 2.0 | 1.0 | 821 | $1,599 | $1.95 | 25d | 1 | 0.95mi |
| 69603 Heather Way Rancho Mirage, CA | 3.0 | 2.0 | 1218 | $2,300 | $1.89 | 44d | 1 | 1.02mi |
| 33892 Sky Blue Water Trl Cathedral City, CA | 3.0 | 2.0 | 1352 | $2,800 | $2.07 | 5d | 1 | 1.04mi |
| 34361 Denise Way Rancho Mirage, CA | 3.0 | 2.0 | 1400 | $2,800 | $2.00 | 44d | 1 | 1.04mi |
| 33387 Shifting Sands Trl Unit 2 Cathedral City, CA | 2.0 | 2.0 | 1300 | $1,999 | $1.54 | 25d | 1 | 1.05mi |
| 68153 Lakeland Dr Cathedral City, CA | 2.0 | 2.0 | 1255 | $2,500 | $1.99 | 25d | 1 | 1.05mi |
| 31121 Avenida El Mundo Cathedral City, CA | 3.0 | 2.0 | 1302 | $3,000 | $2.30 | 44d | 1 | 1.05mi |
| 69646 Antonia Way Rancho Mirage, CA | 2.0 | 2.0 | 966 | $2,450 | $2.54 | 19d | 1 | 1.08mi |
| 68615 Paseo Soria Cathedral City, CA | 2.0 | 2.0 | 1462 | $3,500 | $2.39 | 8d | 1 | 1.12mi |
| 34197 Calle Mora Cathedral City, CA | 2.0 | 2.0 | 1171 | $2,300 | $1.96 | 22d | 1 | 1.12mi |
| 34197 Calle Mora Cathedral City, CA | 2.0 | 2.0 | 1171 | $2,300 | $1.96 | 11d | 1 | 1.12mi |
| 34197 Calle Mora Cathedral City, CA | 2.0 | 2.0 | 1171 | $2,300 | $1.96 | 14d | 1 | 1.12mi |
| 34750 Marcia Rd Unit 02 Cathedral City, CA | 3.0 | 2.0 | 1325 | $2,000 | $1.51 | 19d | 1 | 1.13mi |
| 68368 Calle Leon Cathedral City, CA | 2.0 | 2.0 | 1406 | $3,790 | $2.70 | 15d | 1 | 1.16mi |
| 68368 Calle Leon Cathedral City, CA | 2.0 | 2.0 | 1406 | $3,790 | $2.70 | 44d | 1 | 1.16mi |
| 31520 Landau Blvd Unit 3 Cathedral City, CA | 1.0 | 1.0 | 800 | $1,650 | $2.06 | 0d | 1 | 1.22mi |
| 31200 Landau Blvd Cathedral City, CA | 2.0–3.0 | 2.0 | 1016 | $2,300 | $2.26 | 44d | 3 | 1.23mi |
| 31200 Landau Blvd Cathedral City, CA | 2.0–3.0 | 2.0 | 1016 | $2,195 | $2.16 | 13d | 4 | 1.23mi |
| 68185 Alcita Rd Cathedral City, CA | 2.0 | 2.0 | 975 | $1,895 | $1.94 | 2d | 1 | 1.23mi |
| 68145 Alcita Rd Cathedral City, CA | 3.0 | 2.0 | 1347 | $2,600 | $1.93 | 6d | 1 | 1.27mi |
| 30125 Avenida Juarez Unit 30127 Cathedral City, CA | 3.0 | 2.0 | 1000 | $2,499 | $2.50 | 15d | 1 | 1.28mi |
| 69200 Nilda Dr Cathedral City, CA | 3.0 | 2.0 | 1330 | $2,495 | $1.88 | 22d | 1 | 1.31mi |
| 68859 Paseo Real Cathedral City, CA | 2.0 | 2.0 | 1406 | $3,960 | $2.82 | 44d | 1 | 1.41mi |
| 68859 Paseo Real Cathedral City, CA | 2.0 | 2.0 | 1406 | $3,960 | $2.82 | 15d | 1 | 1.41mi |
Listing history 13 events
-
2026-06-21statusdays on market $99,999 Active 3 DOM
-
2026-06-18days on market $99,999 Coming Soon 16 DOM
-
2026-06-17days on market $99,999 Coming Soon 15 DOM
-
2026-06-16days on market $99,999 Coming Soon 14 DOM
-
2026-06-15days on market $99,999 Coming Soon 13 DOM
-
2026-06-13days on market $99,999 Coming Soon 11 DOM
-
2026-06-13days on market $99,999 Coming Soon 10 DOM
-
2026-06-09days on market $99,999 Coming Soon 7 DOM
-
2026-06-08days on market $99,999 Coming Soon 6 DOM
-
2026-06-07days on market $99,999 Coming Soon 5 DOM
-
2026-06-04days on market $99,999 Coming Soon 2 DOM
-
2026-06-03remarks 592-char remark
-
2026-06-03$99,999 Coming Soon 1 DOM
ⓘ Source: listings_history table (triggers on properties + properties_extension) + one-shot
backfill from property_details.listing_events for pre-trigger history.
Tax reassessment forecast CA · Resets to sale price
- Current annual tax
- $378 · $32/mo
- Projected year-2 tax
- $760 · $63/mo
- Expected delta
- +$382/yr (+$32/mo · 100.9%)
ⓘ Screening estimate from a state-policy table — verify with the county assessor before closing.
Climate risk First Street
- Flood 1/10 Low FEMA zone X (unshaded) · 0% chance over 30 yrs
- Wildfire 1/10 Low
- Heat 9/10 Extreme 7 d/yr ≥113°F today · 20 d/yr by 30 yrs out
- Wind 1/10 Low
- Air quality 5/10 Major 6 unhealthy d/yr today · 8 by 30 yrs out
Nearby sold comps map
Loading sold comps map…
Walkable amenities ~0.75 mi
Loading nearby amenities…
Taxation est. · year 1
- Rental income
- $28,880
- − Mortgage interest
- −$5,601
- − Property taxes
- −$378
- − Insurance
- −$500
- − Repairs & maintenance
- −$2,310
- − Management
- −$2,310
- − Depreciation
- −$2,909
- Taxable income
- $14,870
- Est. tax owed @ 24.0%
- −$3,569
- After-tax cash flow
- $12,075/yr
For passive investors: Depreciation is non-cash, so a rental often shows a tax loss while cash-flowing — sheltering income. Rental losses are passive: they offset passive income freely, and up to $25,000/yr can offset ordinary (W-2) income if you actively participate and your MAGI is under $100k (phasing out to $0 by $150k); unused losses carry forward. On sale, claimed depreciation is recaptured at up to 25%, and gains may owe capital-gains tax (a 1031 exchange can defer both). Figures are a year-1 estimate at your 24.0% rate — not tax advice; consult a CPA.
Schools (NCES district)
- District
- Palm Springs Unified
- NCES district ID
- 0629550
- Math proficiency
- 21% ▼ -7.00%
- Reading proficiency
- 42% ▬ 0.00%
- Median HH income
- $43,638
- Composite
- 26.76/100
- National rank
- #7131
- State rank
- #328 of 517 in CA
Livability — Cathedral City
- Score
- 66/100
- State rank
- #344
- US rank
- #11749
Category grades
Schools grade is shown separately in the Schools card above.
Census & demographics
- Census place
- Cathedral City, CA
- County
- Riverside County · 2,287,001 people
- City population
- 52,267
- Metro
- Riverside-San Bernardino-Ontario, CA
- Population (ZIP)
- 52,267
- Household income
- $73,572
- Rent vs Own
- Severe rent burden
- 1682.0
Population outlook (Riverside County) Hauer SSP2
- Today (2025)
- 2,664,475 people
- By 2030
- 2,802,692 · +5.2%
- By 2040
- 3,050,904 · +14.5%
- By 2050
- 3,256,783 · +22.2%
- By 2075
- 3,655,058 · +37.2%
- By 2100
- 3,766,594 · +41.4%
Race, ethnicity, and origin ACS 2023
- Neighborhood character
- Diverse neighborhood (Simpson 0.56)
- Race & ethnicity
- Hispanic / Latino 59% White 30% Two or more races 27% Asian 6% Native American 2% Black 2%
- Hispanic origin (detail)
- Mexican 51%
- Common ancestry
- Lithuanian 2% Romanian 1% Italian 1%
- Foreign-born
- 28% · Canada, Vietnam
- Languages at home
- 48% English-only · Spanish 46% Tagalog/Filipino 3% Other Asian/Pacific 1%
Political lean MEDSL · Riverside
- 2024 margin
- Toss-up / Even · D 48.0% · R 49.3% · Other 2.6%
- 2008→2024 swing
- -3.6pp toward R · 2008: 2.3pp · 2024: -1.3pp
- All cycles
- 2024: R+1.3 2020: D+8.0 2016: D+4.3 2012: R+0.4 2008: D+2.3
Not yet ingested
- Civics
- —
Market trends
- HPI YoY
- ▼ -136.57%
- Current HPI
- 356.9845
- Rent YoY
- ▲ 3.22%
- Metro
- Riverside-San Bernardino-Ontario, CA
- State GDP YoY
- ▲ 3.21%
- F500 in state
- 116
Industry mix (Fortune 500 HQ in CA)
| Industry | F500 HQs | Revenue |
|---|---|---|
| Technology | 27 | $1,492B |
|
||
| Financial Services | 3 | $174B |
|
||
| Retail | 3 | $44B |
|
||
| Insurance | 3 | $26B |
|
||
| Media / Entertainment | 2 | $115B |
|
||
| Pharmaceuticals / Biotech | 2 | $62B |
|
||
Price history
1 event — show timeline
- 2026-06-03 Coming Soon $99,999 CRMLS
Property tax history
+0.8%/yrLatest (2025): $378 · +0.8% YoY. Source: county tax records.
Cash-flow waterfall
monthlySold comps — $/sqft
last 12 mo · ≤1 miLoading sold comps…