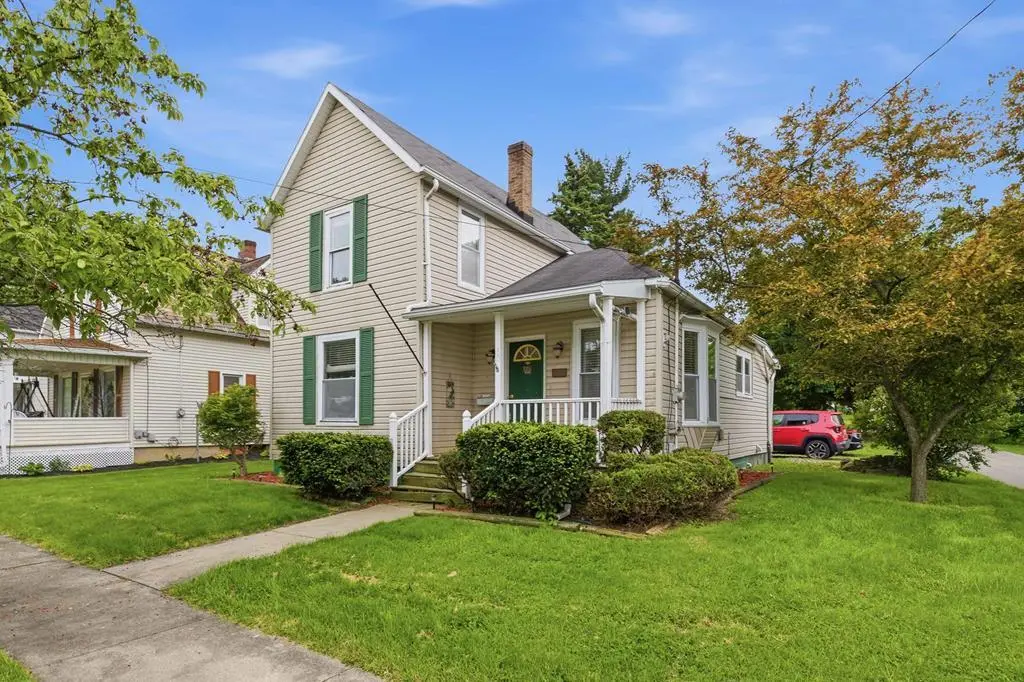
50 E Whitney Ave · Shelby, OH
Flood risk 6/10 · Moderate
- FEMA flood zone
- X (unshaded)
- Chance of flooding over 30 yrs
- 0.75%
- Est. flood insurance / yr
- $473 – $860
Fire risk 1/10 · Minimal
- Est. fire insurance / yr
- $713 – $1,323
Heat risk 3/10 · Minor
- Hot days now (above 98°F)
- 7 days/yr
- Hot days in 30 yrs
- 17 days/yr
Wind risk 2/10 · Minimal
- Chance of severe wind over 30 yrs
- —
Air-quality risk 2/10 · Minimal
- Unhealthy air days now
- 1 days/yr
- Unhealthy air days in 30 yrs
- 2 days/yr
Risk factors via First Street. Map © Google.
Why this score? — see what drove the C- grade
The composite is a weighted blend of 9 inputs, each scored 0–100. Each bar is that input's sub-score; the figure is the points it added to the 100-point composite (weight × sub-score).
- Cash flow +20.1/30.0
- ARV discount +8.9/15.0
- DSCR +6.4/10.0
- Schools +5.2/10.0
- 1% rule +4.6/10.0
- Livability +3.7/5.0
- Rent growth +2.5/5.0
- Condition / age +2.5/5.0
- Appreciation +0.0/10.0
$125,000
🖨 Deal sheet 📄 Offer letter ✓ Due diligence
Listing remarks MLS
Wonderfully cared for home --two bedrooms and half bath up --large bedroom with bath and small room thats great for computer or reading room down. Equipped kitchen- large dining room- basement with newer furnace --air cond --replacement windows--nice patio with goldfish pond--one car garage and storage shed. All window blinds stay. Wardrobe in downstairs bedroom stays. Outside water tap and elect on garage used for motor home. Lots of parking area--drive-way is an alley--great location --close to downtown--walking distance to grocery, drug store and Dr. office.
Key facts
- Garage
- Built 1920
Neighborhood map
What this means for you Summary
Snapshot
- This is a 3-bed/1.5-bath single-family listed at $125k.
Deal economics
- At list price, monthly cash flow is $156 ($2k/yr) — positive.
- The deal already cash-flows at list — no discount required.
- To meet the 1% rule (rent ≥ 1% of price), the offer needs to be $120k (4.2% below list).
- Recommended offer: $120k (4.2% below list) — sets the bar for 1% rule.
- Cap rate 7.8% vs local median 4.7% in Shelby — top-decile yield for the area; either an underpriced asset or a hidden risk that comps aren't pricing in. Stress-test before assuming the spread holds.
Location & tenants
- Location reads 74/100 on livability (#301 in OH, #4,837 nationally) — a middle-class / working-renter tenant base. Strengths: cost of living A+, housing A+, schools B+; Watch: commute D+, employment D, amenities F.
- Shelby City (town): math 62% / reading 62% proficiency, ranked #269 of 656 in OH (top 41%) — acceptable for families but not a draw, mixed tenant base, ~2y average lease.
- Market conditions: 58 active listings in the ZIP; 1 comparable units currently listed for rent nearby; 145 units permitted in Richland County in 2024 (0 in 5+ unit buildings).
Forward outlook
- Local home prices are declining (-3.0%/yr); year-one equity from $864 of loan paydown is wiped out by about $4k of value loss. Plan a longer hold.
- Richland County population projected at -18% by 2050 — secular population decline; favor cash flow + early exit over multi-decade hold.
Negotiation context
- Only 0 days on market — expect competitive offers; lowballing is unlikely to land.
- 3 sale attempts since 21y ago with the ask held roughly flat each time — persistent listings suggest the price (not the market) is what's stuck; bring a comps-based counter.
- Current owner paid $45k; list at $125k implies a 178% gain — meaningful room to come down on a strong offer.
Risks & watch-outs
- Watch-outs: built in 1920 — expect roof / HVAC / electrical / plumbing capex.
- Climate carrying-cost: major flood risk — expect insurance premiums to compound above CPI over the hold.
Questions for the listing agent
- Built in 1920 — when were the roof, HVAC, electrical panel, plumbing, and water heater last replaced?
- Is there a deadline driving the sale (1031 exchange, divorce, estate, relocation)? That informs how much negotiation room exists.
- Schools are B-rated — typically a magnet for longer-tenancy family renters. What's the average tenant stay here, and is there a school-zone premium baked into asking?
- What's the average days-on-market for RENTAL listings here right now (not sales)? A rising rental-DOM trend means longer vacancies and softer asking-rent achievability than the comps imply.
- What's the recent tenant-quality profile in this submarket — average credit score on applications, eviction rate, late-payment / NSF rate, and stable-employment percentage? A property-management company in the area should have these aggregated.
- How much new for-sale + rental construction is in the pipeline within 1–3 miles? Heavy new supply typically softens prices + rents 12–24 months out; constrained supply supports both.
Investment metrics
- 1% rule
- 0.96% ✗
- Cap rate
- 7.79%
- Cash-on-cash
- 5.35%
- DSCR
- 1.24
- GRM
- 8.7
CMA / ARV
- ARV (on-the-fly)
- $128,940
- Comps found
- 12
Show comp detail 12 sales within ~0.75 mi
| Address | Dist | Beds/Ba | Sqft | Sold | Price | $/sf | Match |
|---|---|---|---|---|---|---|---|
| 75 E Whitney Ave | 0.13mi | 3/1.0 | 1,344 (+9%) | 6mo | $140,000 | $104 | 71 |
| 14 Wilson Ave | 0.20mi | 2/1.5 (-1) | 1,096 (-11%) | 5mo | $135,000 | $123 | 63 |
| 81 N 3rd St | 0.31mi | 3/1.0 | 1,103 (-10%) | 4mo | $55,000 | $50 | 63 |
| 84 Broadway St | 0.34mi | 3/1.5 | 1,374 (+12%) | 2mo | $107,000 | $78 | 62 |
| 28 Mack Ave | 0.44mi | 2/1.0 (-1) | 1,134 (-8%) | 0mo | $105,000 | $93 | 59 |
| 23 W Maxwell Dr | 0.61mi | 3/1.0 | 1,288 (+5%) | 4mo | $169,000 | $131 | 58 |
| 33 W Gaylord Ave | 0.58mi | 3/1.5 | 1,302 (+6%) | 5mo | $175,000 | $134 | 58 |
| 47 Roberts Dr | 0.53mi | 3/2.0 | 1,350 (+10%) | 2mo | $174,000 | $129 | 55 |
| 45 Walnut St | 0.61mi | 3/1.0 | 1,128 (-8%) | 6mo | $70,000 | $62 | 50 |
| 32 Sharon St | 0.63mi | 2/1.5 (-1) | 1,147 (-7%) | 5mo | $123,000 | $107 | 50 |
| 14 Maxwell | 0.62mi | 2/1.0 (-1) | 1,389 (+13%) | 1mo | $146,000 | $105 | 41 |
| 75 Walnut St | 0.71mi | 2/1.0 (-1) | 1,056 (-14%) | 8mo | $47,000 | $45 | 30 |
Match score weights: distance 35% · size 25% · config 20% · recency 20%. Top-matched comps best support the ARV.
Projected returns pro-forma
-3.0% appreciation · 3.0% rent growth · sell at horizon
- IRR
- -8.0%
- Equity multiple
- 0.70×
- Total profit
- $-10,339
- Equity at exit
- $18,638
- IRR
- 1.5%
- Equity multiple
- 1.11×
- Total profit
- $3,690
- Equity at exit
- $10,808
Cash invested: $35,000 (down + closing). Projections, not guarantees.
Landlord ↔ Tenant lean methodology
- Overall (STATE)
- 73 Landlord-Friendly
- State Ohio
- 73 Landlord-Friendly · R+6
- County
- — inherits STATE
- City
- — inherits STATE
ZIP-level market 44875
- Home prices YoY
- -26.2%
- Active inventory
- 58
- Price-to-rent
- 8.7×
Monthly cashflow live
- Estimated rent
- $1,197 medium interval (Pro) →
- Mortgage (P&I)
- −$656
- Tax from tax record
- −$82 /mo · $985/yr
- Insurance
- −$52
- HOA
- −$0
- Vacancy / Maint / Mgmt
- −$251
- Net cashflow
- $156
Break-even live
UW: 25.0% down · 7.5% · 30yr · 1.5% tax · 5.0% vac · 8.0% maint · 8.0% mgmt
Financing live
Cash to close
- Down payment
- $31,250
- Closing costs
- $3,750
- Reserves months
- —
- Total cash needed
- —
Loan-product check · same deal, 3 products live
Conventional
25% down · 7.5% · 30yr
- Down + closing
- —
- Monthly P&I
- —
- Monthly cashflow
- —
- DSCR
- —
- Eligible?
- —
Personal DTI + credit; lowest rate.
DSCR
20% down · 8.5% · 30yr
- Down + closing
- —
- Monthly P&I
- —
- Monthly cashflow
- —
- DSCR
- —
- Eligible?
- —
No personal income docs; deal must DSCR.
Hard money
10% down · 12.0% · 12mo
- Down + closing
- —
- Monthly P&I
- —
- Monthly cashflow
- —
- DSCR
- —
- Eligible?
- —
Short-term bridge; refi at stabilization.
Rent comps 1 comps
| Address | Beds | Baths | Sqft | Rent | $/sqft | DOM | Units | Dist |
|---|---|---|---|---|---|---|---|---|
| 187 S Gamble St Shelby, OH | 3.0 | 1.5 | 1482 | $1,400 | $0.94 | 44d | 1 | 0.94mi |
Listing history 8 events
-
2026-05-20$125,000
-
2026-05-20historical
-
2016-10-10soldstatus $45,000
-
2016-10-07soldstatus $45,000 567-char remark
Show marketing remark (567 chars)
Wonderfully cared for home --two bedrooms and half bath up --large bedroom with bath and small room thats great for computer or reading room down. Equipped kitchen- large dining room- basement with newer furnace --air cond --replacement windows--nice patio with goldfish pond--one car garage and storage shed. All window blinds stay. Wardrobe in downstairs bedroom stays. Outside water tap and elect on garage used for motor home. Lots of parking area--drive-way is an alley--great location --close to downtown--walking distance to grocery, drug store and Dr. office.
-
2016-04-18$59,900 567-char remark
Show marketing remark (567 chars)
Wonderfully cared for home --two bedrooms and half bath up --large bedroom with bath and small room thats great for computer or reading room down. Equipped kitchen- large dining room- basement with newer furnace --air cond --replacement windows--nice patio with goldfish pond--one car garage and storage shed. All window blinds stay. Wardrobe in downstairs bedroom stays. Outside water tap and elect on garage used for motor home. Lots of parking area--drive-way is an alley--great location --close to downtown--walking distance to grocery, drug store and Dr. office.
-
2005-09-02soldstatus $45,500 246-char remark
Show marketing remark (246 chars)
Hud Owned. Case #412-389524. Being Sold As-is. No Disclosures. Hud Will Not Make Repairs. McB Makes No Warranty As To The Existence Of Mold In This Property And Is Not Liable For The Potential Harmful Existence Thereof. Cash Or Conventional Only.
-
2005-07-29$45,500 246-char remark
Show marketing remark (246 chars)
Hud Owned. Case #412-389524. Being Sold As-is. No Disclosures. Hud Will Not Make Repairs. McB Makes No Warranty As To The Existence Of Mold In This Property And Is Not Liable For The Potential Harmful Existence Thereof. Cash Or Conventional Only.
-
1997-03-03soldstatus $46,500
ⓘ Source: listings_history table (triggers on properties + properties_extension) + one-shot
backfill from property_details.listing_events for pre-trigger history.
Tax reassessment forecast OH · Partial reset (capped growth)
- Current annual tax
- $985 · $82/mo
- Projected year-2 tax
- $1,467 · $122/mo
- Expected delta
- +$483/yr (+$40/mo · 49.0%)
ⓘ Screening estimate from a state-policy table — verify with the county assessor before closing.
Climate risk First Street
- Flood 6/10 Major FEMA zone X (unshaded) · 75% chance over 30 yrs
- Wildfire 1/10 Low
- Heat 3/10 Moderate 7 d/yr ≥98°F today · 17 d/yr by 30 yrs out
- Wind 2/10 Low
- Air quality 2/10 Low 1 unhealthy d/yr today · 2 by 30 yrs out
Nearby sold comps map
Loading sold comps map…
Walkable amenities ~0.75 mi
Loading nearby amenities…
Taxation est. · year 1
- Rental income
- $14,366
- − Mortgage interest
- −$7,002
- − Property taxes
- −$985
- − Insurance
- −$625
- − Repairs & maintenance
- −$1,149
- − Management
- −$1,149
- − Depreciation
- −$3,636
- Taxable loss
- −$180
- Est. tax savings @ 24.0%
- +$43
- After-tax cash flow
- $1,917/yr
For passive investors: Depreciation is non-cash, so a rental often shows a tax loss while cash-flowing — sheltering income. Rental losses are passive: they offset passive income freely, and up to $25,000/yr can offset ordinary (W-2) income if you actively participate and your MAGI is under $100k (phasing out to $0 by $150k); unused losses carry forward. On sale, claimed depreciation is recaptured at up to 25%, and gains may owe capital-gains tax (a 1031 exchange can defer both). Figures are a year-1 estimate at your 24.0% rate — not tax advice; consult a CPA.
Schools (NCES district)
- District
- Shelby City
- NCES district ID
- 3910009
- Math proficiency
- 62% ▼ -12.00%
- Reading proficiency
- 62% ▼ -8.00%
- Median HH income
- $44,197
- Composite
- 52.19/100
- National rank
- #1609
- State rank
- #269 of 656 in OH
Livability — Shelby
- Score
- 74/100
- State rank
- #301
- US rank
- #4837
Category grades
Schools grade is shown separately in the Schools card above.
Census & demographics
- Census place
- Shelby, OH
- County
- Richland County · 43,943 people
- City population
- 14,144
- Metro
- Mansfield, OH
- Population (ZIP)
- 14,144
- Household income
- $61,276
- Rent vs Own
- Severe rent burden
- 284.0
Population outlook (Richland County) Hauer SSP2
- Today (2025)
- 115,577 people
- By 2030
- 111,669 · -3.4%
- By 2040
- 103,323 · -10.6%
- By 2050
- 95,135 · -17.7%
- By 2075
- 76,719 · -33.6%
- By 2100
- 57,188 · -50.5%
Race, ethnicity, and origin ACS 2023
- Neighborhood character
- Predominantly White (95%)
- Race & ethnicity
- White 95% Hispanic / Latino 2% Two or more races 2% Asian 1%
- Common ancestry
- Lithuanian 2% Romanian 2% Slovak 1%
- Foreign-born
- 1% · Canada
- Languages at home
- 97% English-only · Spanish 2% German/W. Germanic 1%
Political lean MEDSL · Richland
- 2024 margin
- Solid R (+42.3) · D 28.4% · R 70.8%
- 2008→2024 swing
- -28.8pp toward R · 2008: -13.6pp · 2024: -42.3pp
- All cycles
- 2024: R+42.3 2020: R+39.7 2016: R+37.5 2012: R+20.1 2008: R+13.6
Not yet ingested
- Civics
- —
Market trends
- HPI YoY
- ▼ -78.08%
- Current HPI
- 220.0577
- Rent YoY
- —
- Metro
- Mansfield, OH
- State GDP YoY
- ▲ 1.98%
- F500 in state
- 48
Industry mix (Fortune 500 HQ in OH)
| Industry | F500 HQs | Revenue |
|---|---|---|
| Insurance | 3 | $145B |
|
||
| Industrial Machinery | 3 | $49B |
|
||
| Financial Services | 3 | $24B |
|
||
| Consumer Goods | 2 | $93B |
|
||
| Aerospace / Defense | 2 | $47B |
|
||
| Utilities | 2 | $33B |
|
||
Price history
+168.8% since first listed8 events — show timeline
- 2026-05-20 Delisted — MARMLS
- 2026-05-20 Listed $125,000 MARMLS
- 2016-10-10 Sold (Public Records) $45,000 Public Records
- 2016-10-07 Sold (MLS) $45,000 MARMLS
- 2016-04-18 Listed $59,900 MARMLS
- 2005-09-02 Sold (MLS) $45,500 MLSNOW
- 2005-07-29 Listed $45,500 MLSNOW
- 1997-03-03 Sold (Public Records) $46,500 Public Records
Property tax history
+6.9%/yrLatest (2025): $985 · -2.5% YoY. Source: county tax records.
Cash-flow waterfall
monthlySold comps — $/sqft
last 12 mo · ≤1 miLoading sold comps…