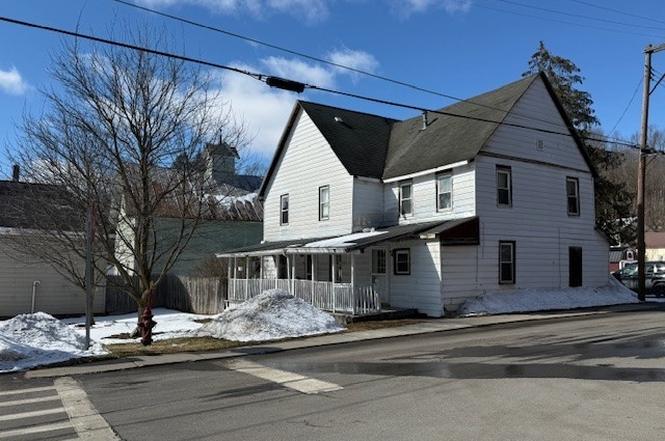
35 Main St · McGraw, NY
Flood risk 9/10 · Severe
- FEMA flood zone
- AE
- Chance of flooding over 30 yrs
- 0.99%
- Est. flood insurance / yr
- $2,026 – $9,024
Fire risk 3/10 · Minor
- Est. fire insurance / yr
- $691 – $1,283
Heat risk 2/10 · Minimal
- Hot days now (above 91°F)
- 8 days/yr
- Hot days in 30 yrs
- 17 days/yr
Wind risk 2/10 · Minimal
- Chance of severe wind over 30 yrs
- 1.0%
Air-quality risk 2/10 · Minimal
- Unhealthy air days now
- 0 days/yr
- Unhealthy air days in 30 yrs
- 1 days/yr
Risk factors via First Street. Map © Google.
Why this score? — see what drove the B+ grade
The composite is a weighted blend of 9 inputs, each scored 0–100. Each bar is that input's sub-score; the figure is the points it added to the 100-point composite (weight × sub-score).
- Cash flow +30.0/30.0
- 1% rule +10.0/10.0
- DSCR +10.0/10.0
- ARV discount +7.5/15.0
- Appreciation +7.4/10.0
- Schools +5.0/10.0
- Livability +3.6/5.0
- Rent growth +2.5/5.0
- Condition / age +2.5/5.0
$74,900
🖨 Deal sheet 📄 Offer letter ✓ Due diligence
Listing remarks
What a sweet deal this duplex is! Although it needs rehabbing, it has the potential to bring in some good income. Right now, the owner lives in one side, with a month-to-month tenant on the other side. There are 3 bedrooms on the left side with hardwood floors in some rooms. The right side has 2 bedrooms and an eat in kitchen. Plenty of parking on the side on North St. Although this is in a flood zone, the owner only pays $400 a year. It has never flooded there in over 20 years. When it did one time it only had a few inches in the basement. The updates completed within the last 1.5 years are: New septic (sewer) line installed from the road to the house, Zero Tech sprayed foam insulation
Key facts
- New breaker boxes
- Eat in kitchen
- Plenty of parking
Tags
Neighborhood map
What this means for you Summary
Snapshot
- This is a 6-bed/2.0-bath townhouse listed at $75k.
Deal economics
- At list price, monthly cash flow is $19 ($231/yr) — positive.
- The deal already cash-flows at list — no discount required.
- Meets the 1% rule at list price ($1k rent vs $75k).
- Recommended offer: $68k (9.0% below list) — sets the bar for market timing.
Location & tenants
- Location reads 71/100 on livability (#411 in NY) — a middle-class / working-renter tenant base. Strengths: cost of living A+, housing A+, crime A-; Watch: schools C-, health & safety D, amenities F.
- Mcgraw Central School District (rural): math 57% / reading 61% proficiency, ranked #252 of 590 in NY (top 43%) — acceptable for families but not a draw, mixed tenant base, ~2y average lease.
- Market conditions: 13 active listings in the ZIP; 45 units permitted in Cortland County in 2024 (12 in 5+ unit buildings).
Forward outlook
- In year one you build about $4k of equity ($518 loan paydown + $4k appreciation (4.9% local appreciation)).
- Cortland County population projected at -15% by 2050 — secular population decline; favor cash flow + early exit over multi-decade hold.
- At projected returns (4.9% appreciation + 3.0% rent growth), your $21k cash investment doubles in ~5 years — after that, you're playing with house money.
- By year 8, paydown + projected appreciation supports a ~$31k cash-out refi (75% LTV) — recoverable capital for the next deal without selling this one.
Negotiation context
- It's been on market 92 days — a 9% lower offer ($68k) is reasonable based on typical stale-listing flexibility.
- 3 sale attempts since 11y ago; this cycle's ask has dropped $11k (13%) from the opening price — seller is motivated, your offer sets the floor, not the list.
- Current owner paid $48k; list at $75k implies a 54% gain — meaningful room to come down on a strong offer.
Risks & watch-outs
- Watch-outs: property tax is 4.0% of price; flood insurance adds $460/mo; built in 1860 — expect roof / HVAC / electrical / plumbing capex.
- Climate carrying-cost: in FEMA flood zone AE (mandatory federal flood insurance) — expect insurance premiums to compound above CPI over the hold.
Questions for the listing agent
- It's been on market 92 days. Have you received any prior offers? Is the seller open to a 9% concession, seller financing, or rate buy-down credit?
- Built in 1860 — when were the roof, HVAC, electrical panel, plumbing, and water heater last replaced?
- Property tax is high relative to price — has the assessment been appealed recently, and will the sale trigger a re-assessment?
- What's the actual annual flood-insurance premium (NFIP or private), and is the property in a SFHA with mandatory coverage?
- Why hasn't it sold? Are there any deal-killer items the seller is aware of (foundation, flood, title, zoning, code violations)?
- Is there a deadline driving the sale (1031 exchange, divorce, estate, relocation)? That informs how much negotiation room exists.
- What's the average days-on-market for RENTAL listings here right now (not sales)? A rising rental-DOM trend means longer vacancies and softer asking-rent achievability than the comps imply.
- What's the recent tenant-quality profile in this submarket — average credit score on applications, eviction rate, late-payment / NSF rate, and stable-employment percentage? A property-management company in the area should have these aggregated.
- How much new for-sale + rental construction is in the pipeline within 1–3 miles? Heavy new supply typically softens prices + rents 12–24 months out; constrained supply supports both.
Investment metrics
- 1% rule
- 1.95% ✓
- Cap rate
- 13.98%
- Cash-on-cash
- 27.45%
- DSCR
- 2.22
- GRM
- 4.3
CMA / ARV
No comps found within radius.
Projected returns pro-forma
4.86% appreciation · 3.0% rent growth · sell at horizon
- IRR
- 13.7%
- Equity multiple
- 1.87×
- Total profit
- $18,283
- Equity at exit
- $41,797
- IRR
- 14.8%
- Equity multiple
- 3.64×
- Total profit
- $55,280
- Equity at exit
- $71,605
Cash invested: $20,972 (down + closing). Projections, not guarantees.
Landlord ↔ Tenant lean methodology
- Overall (STATE)
- 15 Strongly Tenant-Friendly
- State New York
- 15 Strongly Tenant-Friendly · D+10
- County
- — inherits STATE
- City
- — inherits STATE
ZIP-level market 13101
- Home prices YoY
- 1.6%
- Active inventory
- 13
- Price-to-rent
- 4.3×
Monthly cashflow live
- Estimated rent
- $1,460 medium interval (Pro) →
- Mortgage (P&I)
- −$393
- Tax from tax record
- −$250 /mo · $2,997/yr
- Insurance
- −$31
- Flood insurance flood zone
- −$460 /mo · $5,525/yr
- HOA
- −$0
- Vacancy / Maint / Mgmt
- −$307
- Net cashflow
- $19
Break-even live
UW: 25.0% down · 7.5% · 30yr · 1.5% tax · 5.0% vac · 8.0% maint · 8.0% mgmt
Financing live
Cash to close
- Down payment
- $18,725
- Closing costs
- $2,247
- Reserves months
- —
- Total cash needed
- —
Loan-product check · same deal, 3 products live
Conventional
25% down · 7.5% · 30yr
- Down + closing
- —
- Monthly P&I
- —
- Monthly cashflow
- —
- DSCR
- —
- Eligible?
- —
Personal DTI + credit; lowest rate.
DSCR
20% down · 8.5% · 30yr
- Down + closing
- —
- Monthly P&I
- —
- Monthly cashflow
- —
- DSCR
- —
- Eligible?
- —
No personal income docs; deal must DSCR.
Hard money
10% down · 12.0% · 12mo
- Down + closing
- —
- Monthly P&I
- —
- Monthly cashflow
- —
- DSCR
- —
- Eligible?
- —
Short-term bridge; refi at stabilization.
Listing history 14 events
-
2026-06-05statusdays on market $74,900 Pending 92 DOM
-
2026-06-03days on market $74,900 Active Under Contract 91 DOM
-
2026-06-02days on market $74,900 Active Under Contract 90 DOM
-
2026-06-01days on market $74,900 Active Under Contract 89 DOM
-
2026-05-31days on market $74,900 Active Under Contract 88 DOM
-
2026-05-30days on market $74,900 Active Under Contract 87 DOM
-
2026-04-03historical Active Under Contract
-
2026-03-16price $74,900
-
2026-03-04$85,900 Active
-
2023-08-24historical $3,900
-
2023-07-16$3,900
-
2015-08-12historical
-
2015-06-10$60,900
-
2004-09-09soldstatus $48,500
ⓘ Source: listings_history table (triggers on properties + properties_extension) + one-shot
backfill from property_details.listing_events for pre-trigger history.
Tax reassessment forecast NY · Partial reset (capped growth)
- Current annual tax
- $2,997 · $250/mo
- Projected year-2 tax
- $2,997 · $250/mo
- Expected delta
- $0/yr ($0/mo · 0.0%)
ⓘ Screening estimate from a state-policy table — verify with the county assessor before closing.
Climate risk First Street
- Flood 9/10 Extreme FEMA zone AE · 99% chance over 30 yrs
- Wildfire 3/10 Moderate
- Heat 2/10 Low 8 d/yr ≥91°F today · 17 d/yr by 30 yrs out
- Wind 2/10 Low 100% chance of damaging wind over 30 yrs
- Air quality 2/10 Low 0 unhealthy d/yr today · 1 by 30 yrs out
Nearby sold comps map
Loading sold comps map…
Walkable amenities ~0.75 mi
Loading nearby amenities…
Taxation est. · year 1
- Rental income
- $17,521
- − Mortgage interest
- −$4,196
- − Property taxes
- −$2,997
- − Insurance
- −$5,900
- − Repairs & maintenance
- −$1,402
- − Management
- −$1,402
- − Depreciation
- −$2,179
- Taxable loss
- −$554
- Est. tax savings @ 24.0%
- +$133
- After-tax cash flow
- $364/yr
For passive investors: Depreciation is non-cash, so a rental often shows a tax loss while cash-flowing — sheltering income. Rental losses are passive: they offset passive income freely, and up to $25,000/yr can offset ordinary (W-2) income if you actively participate and your MAGI is under $100k (phasing out to $0 by $150k); unused losses carry forward. On sale, claimed depreciation is recaptured at up to 25%, and gains may owe capital-gains tax (a 1031 exchange can defer both). Figures are a year-1 estimate at your 24.0% rate — not tax advice; consult a CPA.
Schools (NCES district)
- District
- Mcgraw Central School District
- NCES district ID
- 3618840
- Math proficiency
- 57% ▲ 7.00%
- Reading proficiency
- 61% ▲ 11.00%
- Median HH income
- $51,404
- Composite
- 50.37/100
- National rank
- #1875
- State rank
- #252 of 590 in NY
Livability — McGraw
- Score
- 71/100
- State rank
- #411
- US rank
- #7091
Category grades
Schools grade is shown separately in the Schools card above.
Census & demographics
- Census place
- McGraw, NY
- Population (ZIP)
- 2,221
Population outlook (Cortland County) Hauer SSP2
- Today (2025)
- 47,543 people
- By 2030
- 46,107 · -3.0%
- By 2040
- 43,122 · -9.3%
- By 2050
- 40,216 · -15.4%
- By 2075
- 34,717 · -27.0%
- By 2100
- 28,953 · -39.1%
Race, ethnicity, and origin ACS 2023
- Neighborhood character
- Predominantly White (94%)
- Race & ethnicity
- White 94% Two or more races 4% Hispanic / Latino 2%
- Common ancestry
- Romanian 3% Iranian 3% Serbian 2%
- Foreign-born
- 0% · Canada
- Languages at home
- 98% English-only · Spanish 1%
Political lean MEDSL · Cortland
- 2024 margin
- Lean R (+6.4) · D 46.8% · R 53.2%
- 2008→2024 swing
- -16.4pp toward R · 2008: 10.0pp · 2024: -6.4pp
- All cycles
- 2024: R+6.4 2020: R+1.9 2016: R+6.7 2012: D+8.8 2008: D+10.0
Not yet ingested
- Civics
- —
Market trends
- HPI YoY
- ▲ 4.86%
- Current HPI
- 305.3272
- Rent YoY
- —
- Metro
- —
- State GDP YoY
- ▲ 2.60%
- F500 in state
- 92
Industry mix (Fortune 500 HQ in NY)
| Industry | F500 HQs | Revenue |
|---|---|---|
| Financial Services | 10 | $950B |
|
||
| Consumer Goods | 9 | $162B |
|
||
| Insurance | 4 | $225B |
|
||
| Telecommunications | 2 | $144B |
|
||
| Pharmaceuticals | 2 | $112B |
|
||
| Media / Entertainment | 2 | $69B |
|
||
Price history
+54.4% since first listed8 events — show timeline
- 2026-04-03 Contingent — CNYIS
- 2026-03-16 Price Changed $74,900 CNYIS
- 2026-03-04 Listed $85,900 CNYIS
- 2023-08-24 Rental Removed $3,900 LEASESTAR
- 2023-07-16 Listed for Rent $3,900 LEASESTAR
- 2015-08-12 Listing Removed — CNYIS
- 2015-06-10 Listed $60,900 CNYIS
- 2004-09-09 Sold (Public Records) $48,500 Public Records
Property tax history
+3.9%/yrLatest (2025): $2,997 · +3.4% YoY. Source: county tax records.
Cash-flow waterfall
monthlySold comps — $/sqft
last 12 mo · ≤1 miLoading sold comps…