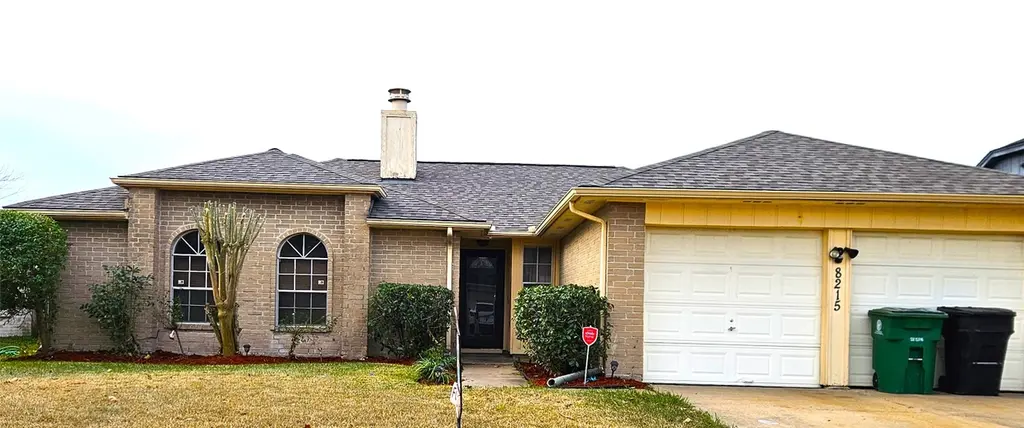
8215 Summer Quail Dr · Houston, TX
Flood risk 6/10 · Moderate
- FEMA flood zone
- X (unshaded)
- Chance of flooding over 30 yrs
- 0.7%
- Est. flood insurance / yr
- $507 – $1,088
Fire risk 3/10 · Minor
- Est. fire insurance / yr
- $1,222 – $2,270
Heat risk 9/10 · Severe
- Hot days now (above 110°F)
- 7 days/yr
- Hot days in 30 yrs
- 24 days/yr
Wind risk 9/10 · Severe
- Chance of severe wind over 30 yrs
- 99.0%
Air-quality risk 3/10 · Minor
- Unhealthy air days now
- 2 days/yr
- Unhealthy air days in 30 yrs
- 3 days/yr
Risk factors via First Street. Map © Google.
Why this score? — see what drove the D+ grade
The composite is a weighted blend of 9 inputs, each scored 0–100. Each bar is that input's sub-score; the figure is the points it added to the 100-point composite (weight × sub-score).
- Cash flow +13.1/30.0
- ARV discount +10.0/15.0
- Appreciation +4.7/10.0
- Schools +4.5/10.0
- 1% rule +4.4/10.0
- DSCR +3.9/10.0
- Livability +3.7/5.0
- Rent growth +2.6/5.0
- Condition / age +2.5/5.0
$215,000
🖨 Deal sheet (PDF) 📄 Offer letter ✓ Due diligence
Listing remarks MLS
4 BR, 2 Full Baths, New roof, New Back side fence, Granite counter tops in Kitchen and baths, Tile flooring , No carpet.
Key facts
- New back side fence
- Tile flooring
- Granite counter tops
Tags
Neighborhood map
What this means for you Summary
Snapshot
- This is a 4-bed/2.0-bath single-family listed at $215k.
Deal economics
- At list price, monthly cash flow is $-7 ($-87/yr) — negative.
- To cash-flow at today's rent, offer at most $214k (0.6% below list).
- To meet the 1% rule (rent ≥ 1% of price), the offer needs to be $202k (6.1% below list).
- Recommended offer: $189k (12.0% below list) — sets the bar for market timing.
- Cap rate 6.3% vs local median 3.2% in Houston — top-decile yield for the area; either an underpriced asset or a hidden risk that comps aren't pricing in. Stress-test before assuming the spread holds.
Location & tenants
- Location reads 74/100 on livability (#184 in TX, #4,771 nationally) — a middle-class / working-renter tenant base. Strengths: amenities A+, cost of living A+, housing A+; Watch: crime F.
- Fort Bend ISD (suburban): math 44% / reading 53% proficiency, ranked #140 of 826 in TX (top 17%) — families likely to look elsewhere, expect single-tenant / working-renter base with shorter leases.
- Zoned schools: Edgar Glover Jr El (math 42% / reading 37%, grade F, #1,545 of 4,322 statewide, top 38%, 380 students, 87% FRL); Missouri City Middle (math 19% / reading 35%, grade F, #1,177 of 1,662 statewide, top 72%, 963 students, 88% FRL); Thurgood Marshall H S (math 11% / reading 30%, grade F, #1,389 of 1,632 statewide, top 86%, 1,542 students, 82% FRL) — zoned schools average 86% FRL vs 35% district-wide (51 pts higher); higher-poverty schools than district average — tighter screening recommended.
- Zoned-school proficiency averages 29% at this address vs 48% district-wide (-20 pts) — the specific schools serving this property underperform the Fort Bend ISD average; the district grade overstates school quality for this exact location.
- Market conditions: Rents flat; 188 active listings in the ZIP; 10 comparable units currently listed for rent nearby; rentals at typical pace (median 23d on market — plan ~3-4 weeks tenant-placement turnaround); 12,093 units permitted in Fort Bend County in 2024 (815 in 5+ unit buildings).
- This rent runs 32% of the median local income ($75k/yr) — at the standard rent-burdened threshold; future hikes will face affordability resistance.
Forward outlook
- In year one you build about $301 of equity ($1k loan paydown + $-1k appreciation (-0.6% local appreciation)).
- Fort Bend County population projected at +75% by 2050 — long-run rental-demand tailwind backs the buy-and-hold thesis.
Negotiation context
- It's been on market 185 days — a 12% lower offer ($189k) is reasonable based on typical stale-listing flexibility.
- 3 sale attempts since 10y ago; this cycle's ask has dropped $20k (8%) from the opening price — seller is motivated, your offer sets the floor, not the list.
Risks & watch-outs
- Climate carrying-cost: major flood risk; severe wind risk, 99% chance of damaging wind over 30y; extreme-heat days projected 7→24/yr by 2055 (HVAC capex compounding) — expect insurance premiums to compound above CPI over the hold.
Questions for the listing agent
- What do current leases actually rent for vs. the listed asking? Can we see a recent rent roll and the last 12 months of T-12 income?
- It's been on market 185 days. Have you received any prior offers? Is the seller open to a 12% concession, seller financing, or rate buy-down credit?
- What does the HOA fee cover, when was the last increase, and are there any pending special assessments or reserve-fund shortfalls?
- Why hasn't it sold? Are there any deal-killer items the seller is aware of (foundation, flood, title, zoning, code violations)?
- Is there a deadline driving the sale (1031 exchange, divorce, estate, relocation)? That informs how much negotiation room exists.
- Schools are D-rated, which usually means shorter tenancies and higher turnover. Who's the typical renter profile here, and what's been the actual vacancy rate?
- Crime grade is F in this area — have there been break-ins, vandalism, or insurance claims at this property in the last 3 years? What carrier currently insures it and at what premium?
- The area grade is low — what's the realistic commute time and amenity access for the typical tenant pool here? Any planned neighborhood developments (good or bad) we should know about?
- What's the average days-on-market for RENTAL listings here right now (not sales)? A rising rental-DOM trend means longer vacancies and softer asking-rent achievability than the comps imply.
- What's the recent tenant-quality profile in this submarket — average credit score on applications, eviction rate, late-payment / NSF rate, and stable-employment percentage? A property-management company in the area should have these aggregated.
- How much new for-sale + rental construction is in the pipeline within 1–3 miles? Heavy new supply typically softens prices + rents 12–24 months out; constrained supply supports both.
Investment metrics
- 1% rule
- 0.94% ✗
- Cap rate
- 6.25%
- Cash-on-cash
- -0.14%
- DSCR
- 0.99
- GRM
- 8.9
CMA / ARV
- ARV (median comp)
- $227,636
- List price
- $215,000
- Delta
- -5.55%
- Verdict
- FAIR
- Comps
- 20 within 1.0 mi
Show comp detail 12 sales within ~0.75 mi
| Address | Dist | Beds/Ba | Sqft | Sold | Price | $/sf | Match |
|---|---|---|---|---|---|---|---|
| 16614 Quiet Quail Dr | 0.11mi | 4/2.0 | 1,505 (0%) | 6mo | $199,999 | $133 | 90 |
| 16711 Running Quail Ct | 0.42mi | 4/2.0 | 1,500 (-0%) | 3mo | $210,000 | $140 | 77 |
| 2507 Rittenmore Dr | 0.47mi | 4/2.0 | 1,568 (+4%) | 1mo | $235,000 | $150 | 70 |
| 8310 Blue Quail Dr | 0.14mi | 3/2.0 (-1) | 1,397 (-7%) | 8mo | $247,770 | $177 | 70 |
| 16610 Quail Prairie Dr | 0.15mi | 3/2.0 (-1) | 1,644 (+9%) | 4mo | $239,500 | $146 | 69 |
| 8434 Quail Crest Dr | 0.39mi | 3/2.0 (-1) | 1,560 (+4%) | 3mo | $239,500 | $154 | 68 |
| 16626 Quail Run Dr | 0.22mi | 3/2.0 (-1) | 1,644 (+9%) | 6mo | $210,000 | $128 | 64 |
| 16331 Hunting Dog Ct | 0.34mi | 3/2.0 (-1) | 1,649 (+10%) | 7mo | $265,000 | $161 | 57 |
| 2435 Buttonhill Dr | 0.56mi | 3/2.0 (-1) | 1,420 (-6%) | 3mo | $195,000 | $137 | 57 |
| 16718 Running Quail Ct | 0.46mi | 3/2.0 (-1) | 1,686 (+12%) | 1mo | $235,000 | $139 | 53 |
| 610 Reedwood Dr | 0.59mi | 3/2.0 (-1) | 1,420 (-6%) | 8mo | $225,000 | $158 | 52 |
| 8402 Bird Meadow Ln | 0.67mi | 3/2.0 (-1) | 1,664 (+11%) | 6mo | $249,900 | $150 | 41 |
Match score weights: distance 35% · size 25% · config 20% · recency 20%. Top-matched comps best support the ARV.
Projected returns pro-forma
-0.55% appreciation · 0.34% rent growth · sell at horizon
- IRR
- -6.6%
- Equity multiple
- 0.71×
- Total profit
- $-17,421
- Equity at exit
- $56,570
- IRR
- -2.5%
- Equity multiple
- 0.77×
- Total profit
- $-13,698
- Equity at exit
- $63,484
Cash invested: $60,200 (down + closing). Projections, not guarantees.
Landlord ↔ Tenant lean methodology
- Overall (STATE)
- 87 Strongly Landlord-Friendly
- State Texas
- 87 Strongly Landlord-Friendly · R+5
- County
- — inherits STATE
- City
- — inherits STATE
ZIP-level market 77489
- Home prices YoY
- -0.2%
- Rents YoY
- 0.3%
- Active inventory
- 188
- Price-to-rent
- 8.9×
Monthly cashflow live
- Estimated rent
- $2,020 high interval (Pro) →
- Mortgage (P&I)
- −$1,127
- Tax from tax record
- −$352 /mo · $4,220/yr
- Insurance
- −$90
- HOA
- −$34
- Vacancy / Maint / Mgmt
- −$424
- Net cashflow
- $-7
Break-even live
Sensitivity live
| Price | -10% $114 | -5% $54 | +0% $-7 | +5% $-68 | +10% $-129 |
|---|---|---|---|---|---|
| Rent | -10% $-167 | -5% $-87 | +0% $-7 | +5% $73 | +10% $152 |
| Rate | -1.0pp $101 | -0.5pp $47 | base $-7 | +0.5pp $-63 | +1.0pp $-120 |
UW: 25.0% down · 7.5% · 30yr · 1.5% tax · 5.0% vac · 8.0% maint · 8.0% mgmt
Financing live
Cash to close
- Down payment
- $53,750
- Closing costs
- $6,450
- Reserves months
- —
- Total cash needed
- —
Loan-product check · same deal, 3 products live
Conventional
25% down · 7.5% · 30yr
- Down + closing
- —
- Monthly P&I
- —
- Monthly cashflow
- —
- DSCR
- —
- Eligible?
- —
Personal DTI + credit; lowest rate.
DSCR
20% down · 8.5% · 30yr
- Down + closing
- —
- Monthly P&I
- —
- Monthly cashflow
- —
- DSCR
- —
- Eligible?
- —
No personal income docs; deal must DSCR.
Hard money
10% down · 12.0% · 12mo
- Down + closing
- —
- Monthly P&I
- —
- Monthly cashflow
- —
- DSCR
- —
- Eligible?
- —
Short-term bridge; refi at stabilization.
Rent comps 10 comps
| Address | Beds | Baths | Sqft | Rent | $/sqft | DOM | Units | Dist |
|---|---|---|---|---|---|---|---|---|
| 16310 Setter Ct Missouri City, TX | 3.0 | 2.0 | 1672 | $1,700 | $1.02 | 45d | 1 | 0.24mi |
| 712 Beechbend Dr Missouri City, TX | 4.0 | 2.5 | 2245 | $2,250 | $1.00 | 22d | 1 | 0.68mi |
| 15823 Baybriar Dr Missouri City, TX | 3.0 | 2.0 | 1335 | $1,641 | $1.23 | 7d | 1 | 0.83mi |
| 1215 New Tree Ln Missouri City, TX | 3.0 | 2.0 | 1323 | $1,725 | $1.30 | 14d | 1 | 0.85mi |
| 15703 Baybriar Dr Missouri City, TX | 3.0 | 2.0 | 1252 | $1,615 | $1.29 | 21d | 1 | 0.99mi |
| 17318 Edgehaven Dr Missouri City, TX | 3.0 | 2.0 | 1448 | $1,695 | $1.17 | 22d | 1 | 1.05mi |
| 1806 Courtside Place Dr Missouri City, TX | 4.0 | 2.5 | 1974 | $1,915 | $0.97 | 14d | 1 | 1.22mi |
| 1919 Doliver Cir Missouri City, TX | 3.0 | 2.0 | 1515 | $2,000 | $1.32 | 45d | 1 | 1.22mi |
| 507 Whippoorwill Dr Missouri City, TX | 3.0 | 2.0 | 1970 | $1,925 | $0.98 | 45d | 1 | 1.32mi |
| 2026 Summer Place Dr Missouri City, TX | 3.0 | 2.0 | 1837 | $1,861 | $1.01 | 22d | 1 | 1.39mi |
HOA detail
- Monthly dues
- $34 · $408/yr
Listing history 26 events
-
2026-06-21days on market $215,000 Pending 185 DOM
-
2026-06-18days on market $215,000 Pending 182 DOM
-
2026-06-17days on market $215,000 Pending 181 DOM
-
2026-06-16days on market $215,000 Pending 180 DOM
-
2026-06-15days on market $215,000 Pending 179 DOM
-
2026-06-13statusdays on market $215,000 Pending 177 DOM
-
2026-06-09days on market $215,000 Active 173 DOM
-
2026-06-07days on market $215,000 Active 171 DOM
-
2026-06-04days on market $215,000 Active 168 DOM
-
2026-06-03days on market $215,000 Active 167 DOM
-
2026-06-02days on market $215,000 Active 166 DOM
-
2026-06-01days on market $215,000 Active 165 DOM
-
2026-05-31days on market $215,000 Active 164 DOM
-
2026-05-11price $219,900 120-char remark
Show marketing remark (120 chars)
4 BR, 2 Full Baths, New roof, New Back side fence, Granite counter tops in Kitchen and baths, Tile flooring , No carpet.
-
2026-02-11historical $1,800
-
2026-02-06price $1,800
-
2026-02-04price $224,900 120-char remark
Show marketing remark (120 chars)
4 BR, 2 Full Baths, New roof, New Back side fence, Granite counter tops in Kitchen and baths, Tile flooring , No carpet.
-
2026-01-04price $1,850
-
2026-01-03price $229,900 120-char remark
Show marketing remark (120 chars)
4 BR, 2 Full Baths, New roof, New Back side fence, Granite counter tops in Kitchen and baths, Tile flooring , No carpet.
-
2025-12-18$234,900 Active 120-char remark
Show marketing remark (120 chars)
4 BR, 2 Full Baths, New roof, New Back side fence, Granite counter tops in Kitchen and baths, Tile flooring , No carpet.
-
2025-12-17$1,925
-
2016-10-04soldstatus
-
2016-10-03soldstatus Sold 198-char remark
Show marketing remark (198 chars)
Wonderful 4 bedroom, 2 bathroom in Quail Run at a GREAT price! Neural colors, vaulted ceilings and fresh carpets. Backyard is fenced in with plenty of room for entertaining! This home is a MUST see!
-
2016-08-15status Pending 198-char remark
Show marketing remark (198 chars)
Wonderful 4 bedroom, 2 bathroom in Quail Run at a GREAT price! Neural colors, vaulted ceilings and fresh carpets. Backyard is fenced in with plenty of room for entertaining! This home is a MUST see!
-
2016-08-06status Option Pending 198-char remark
Show marketing remark (198 chars)
Wonderful 4 bedroom, 2 bathroom in Quail Run at a GREAT price! Neural colors, vaulted ceilings and fresh carpets. Backyard is fenced in with plenty of room for entertaining! This home is a MUST see!
-
2016-08-01$97,500 Active 198-char remark
Show marketing remark (198 chars)
Wonderful 4 bedroom, 2 bathroom in Quail Run at a GREAT price! Neural colors, vaulted ceilings and fresh carpets. Backyard is fenced in with plenty of room for entertaining! This home is a MUST see!
ⓘ Source: listings_history table (triggers on properties + properties_extension) + one-shot
backfill from property_details.listing_events for pre-trigger history.
Tax reassessment forecast TX · Resets to sale price
- Current annual tax
- $4,220 · $352/mo
- Projected year-2 tax
- $4,220 · $352/mo
- Expected delta
- $0/yr ($0/mo · 0.0%)
ⓘ Screening estimate from a state-policy table — verify with the county assessor before closing.
Climate risk First Street
- Flood 6/10 Major FEMA zone X (unshaded) · 70% chance over 30 yrs
- Wildfire 3/10 Moderate
- Heat 9/10 Extreme 7 d/yr ≥110°F today · 24 d/yr by 30 yrs out
- Wind 9/10 Extreme 99% chance of damaging wind over 30 yrs
- Air quality 3/10 Moderate 2 unhealthy d/yr today · 3 by 30 yrs out
Nearby sold comps map
Loading sold comps map…
Walkable amenities ~0.75 mi
Loading nearby amenities…
Taxation est. · year 1
- Rental income
- $24,236
- − Mortgage interest
- −$12,043
- − Property taxes
- −$4,220
- − Insurance
- −$1,075
- − Repairs & maintenance
- −$1,939
- − Management
- −$1,939
- − HOA
- −$408
- − Depreciation
- −$6,255
- Taxable loss
- −$3,643
- Est. tax savings @ 24.0%
- +$874
- After-tax cash flow
- $788/yr
For passive investors: Depreciation is non-cash, so a rental often shows a tax loss while cash-flowing — sheltering income. Rental losses are passive: they offset passive income freely, and up to $25,000/yr can offset ordinary (W-2) income if you actively participate and your MAGI is under $100k (phasing out to $0 by $150k); unused losses carry forward. On sale, claimed depreciation is recaptured at up to 25%, and gains may owe capital-gains tax (a 1031 exchange can defer both). Figures are a year-1 estimate at your 24.0% rate — not tax advice; consult a CPA.
Schools (NCES district)
- District
- Fort Bend ISD
- NCES district ID
- 4819650
- Math proficiency
- 44% ▼ -15.00%
- Reading proficiency
- 53% ▼ -4.00%
- Median HH income
- $82,360
- Composite
- 44.61/100
- National rank
- #2779
- State rank
- #140 of 826 in TX
Livability — Houston
- Score
- 74/100
- State rank
- #184
- US rank
- #4771
Category grades
Schools grade is shown separately in the Schools card above.
Census & demographics
- Census place
- Houston, TX
- County
- Fort Bend County · 836,777 people
- City population
- 3,226,434
- Metro
- Houston-The Woodlands-Sugar Land, TX
- Population (ZIP)
- 39,292
- Household income
- $74,689
- Rent vs Own
- Severe rent burden
- 1121.0
Population outlook (Fort Bend County) Hauer SSP2
- Today (2025)
- 1,004,526 people
- By 2030
- 1,153,104 · +14.8%
- By 2040
- 1,453,718 · +44.7%
- By 2050
- 1,753,781 · +74.6%
- By 2075
- 2,455,772 · +144.5%
- By 2100
- 2,930,528 · +191.7%
Race, ethnicity, and origin ACS 2023
- Neighborhood character
- Majority Black (60%)
- Race & ethnicity
- Black 60% Hispanic / Latino 29% Two or more races 13% White 4% Asian 3%
- Hispanic origin (detail)
- Mexican 17%
- Foreign-born
- 16% · Canada, Vietnam
- Languages at home
- 73% English-only · Spanish 22% Vietnamese 1% Other Asian/Pacific 1%
Political lean MEDSL · Fort Bend
- 2024 margin
- Toss-up / Even · D 49.5% · R 47.9% · Other 2.6%
- 2008→2024 swing
- +4.0pp toward D · 2008: -2.4pp · 2024: 1.6pp
- All cycles
- 2024: D+1.6 2020: D+10.6 2016: D+6.6 2012: R+6.8 2008: R+2.4
Not yet ingested
- Civics
- —
Market trends
- HPI YoY
- ▼ -0.55%
- Current HPI
- 288.1306
- Rent YoY
- ▲ 0.34%
- Metro
- Houston-The Woodlands-Sugar Land, TX
- State GDP YoY
- ▲ 3.95%
- F500 in state
- 110
Industry mix (Fortune 500 HQ in TX)
| Industry | F500 HQs | Revenue |
|---|---|---|
| Energy | 16 | $1,198B |
|
||
| Technology | 5 | $198B |
|
||
| Engineering / Construction | 4 | $72B |
|
||
| Energy Services | 3 | $60B |
|
||
| Utilities | 3 | $41B |
|
||
| Healthcare | 2 | $330B |
|
||
Price history
+125.5% since first listed13 events — show timeline
- 2026-05-11 Price Changed $219,900 HARMLS
- 2026-02-11 Rental Removed $1,800 HARMLS
- 2026-02-06 Price Changed $1,800 HARMLS
- 2026-02-04 Price Changed $224,900 HARMLS
- 2026-01-04 Price Changed $1,850 HARMLS
- 2026-01-03 Price Changed $229,900 HARMLS
- 2025-12-18 Listed $234,900 HARMLS
- 2025-12-17 Listed for Rent $1,925 HARMLS
- 2016-10-04 Sold (Public Records) — Public Records
- 2016-10-03 Sold (MLS) — HARMLS
- 2016-08-15 Pending — HARMLS
- 2016-08-06 Pending — HARMLS
- 2016-08-01 Listed $97,500 HARMLS
Property tax history
+4.1%/yrLatest (2025): $4,220 · +12.3% YoY. Source: county tax records.
Cash-flow waterfall
monthlySold comps — $/sqft
last 12 mo · ≤1 miLoading sold comps…