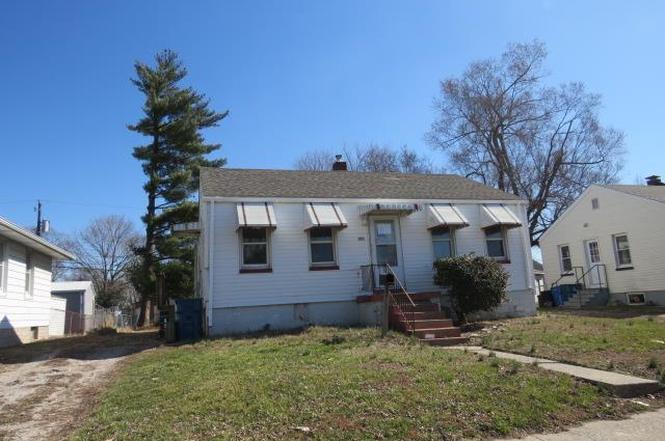
128 Bonds Ave · East Alton, IL
Flood risk 1/10 · Minimal
- FEMA flood zone
- X
- Chance of flooding over 30 yrs
- 0.0%
- Est. flood insurance / yr
- $507 – $1,088
Fire risk 1/10 · Minimal
- Est. fire insurance / yr
- $804 – $1,492
Heat risk 5/10 · Moderate
- Hot days now (above 106°F)
- 7 days/yr
- Hot days in 30 yrs
- 20 days/yr
Wind risk 2/10 · Minimal
- Chance of severe wind over 30 yrs
- 1.0%
Air-quality risk 3/10 · Minor
- Unhealthy air days now
- 2 days/yr
- Unhealthy air days in 30 yrs
- 4 days/yr
Risk factors via First Street. Map © Google.
Why this score? — see what drove the D grade
The composite is a weighted blend of 9 inputs, each scored 0–100. Each bar is that input's sub-score; the figure is the points it added to the 100-point composite (weight × sub-score).
- Cash flow +15.0/30.0
- ARV discount +7.5/15.0
- 1% rule +5.0/10.0
- DSCR +5.0/10.0
- Livability +3.5/5.0
- Rent growth +2.5/5.0
- Condition / age +2.5/5.0
- Schools +1.6/10.0
- Appreciation +0.0/10.0
$24,900
🖨 Deal sheet 📄 Offer letter ✓ Due diligence
Listing remarks
2 bed, 1 bath home with plenty of potential. Perfect project for someone ready to renovate and make it their own.
Key facts
- 6,420 sq ft lot
- Built 1945
- Listed 78 days
Property features AI
Exterior
- Utilities: Public water; Public sewer; Electric service by Ameren
- Home design: Single-family residence; One-story
- Construction: Vinyl siding
- Exterior features: Level lot
Interior
- Bedrooms: Two bedrooms on the main level
- Bathrooms: One full bathroom on the main level
- Heating & cooling: Forced air heating; Central air conditioning
- Interior features: Crawl space basement; Five total rooms
Neighborhood map
What this means for you Summary
Snapshot
- This is a 2-bed/1.0-bath single-family listed at $25k.
Deal economics
- At list price, monthly cash flow is $665 ($8k/yr) — positive.
- The deal already cash-flows at list — no discount required.
- Meets the 1% rule at list price ($1k rent vs $25k).
- Recommended offer: $23k (6.0% below list) — sets the bar for market timing.
Location & tenants
- Location reads 69/100 on livability (#418 in IL) — a middle-class / working-renter tenant base. Strengths: cost of living A+, housing A+; Watch: commute D+, crime D, amenities F.
- East Alton-Wood River Chsd 14 (suburban): math 10% / reading 20% proficiency, ranked #793 of 919 in IL (top 86%) — low school quality limits family demand, transient renter base, plan for 1-2y turnover.
- Zoned schools: East Alton-Wood River High Sch (math 8% / reading 12%, grade F, #567 of 693 statewide, top 83%, 537 students, 0% FRL).
- Market conditions: 38 active listings in the ZIP; 4 comparable units currently listed for rent nearby; rentals leasing fast (median 4d on market — plan ~1-2 weeks tenant-placement turnaround); 336 units permitted in Madison County in 2024 (0 in 5+ unit buildings).
Forward outlook
- Local home prices are declining (-3.0%/yr); year-one equity from $172 of loan paydown is wiped out by about $747 of value loss. Plan a longer hold.
- Madison County population projected at -18% by 2050 — secular population decline; favor cash flow + early exit over multi-decade hold.
- At projected returns (-3.0% appreciation + 3.0% rent growth), your $7k cash investment doubles in ~1 year — after that, you're playing with house money.
Negotiation context
- It's been on market 78 days — a 6% lower offer ($23k) is reasonable based on typical stale-listing flexibility.
- 2 sale attempts; this cycle's ask has dropped $5k (17%) from the opening price — seller is motivated, your offer sets the floor, not the list.
Risks & watch-outs
- Watch-outs: built in 1945 — expect roof / HVAC / electrical / plumbing capex.
- Climate carrying-cost: extreme-heat days projected 7→20/yr by 2055 (HVAC capex compounding) — expect insurance premiums to compound above CPI over the hold.
Questions for the listing agent
- It's been on market 78 days. Have you received any prior offers? Is the seller open to a 6% concession, seller financing, or rate buy-down credit?
- Built in 1945 — when were the roof, HVAC, electrical panel, plumbing, and water heater last replaced?
- Why hasn't it sold? Are there any deal-killer items the seller is aware of (foundation, flood, title, zoning, code violations)?
- Is there a deadline driving the sale (1031 exchange, divorce, estate, relocation)? That informs how much negotiation room exists.
- Schools are F-rated, which usually means shorter tenancies and higher turnover. Who's the typical renter profile here, and what's been the actual vacancy rate?
- Crime grade is D in this area — have there been break-ins, vandalism, or insurance claims at this property in the last 3 years? What carrier currently insures it and at what premium?
- The area grade is low — what's the realistic commute time and amenity access for the typical tenant pool here? Any planned neighborhood developments (good or bad) we should know about?
- What's the average days-on-market for RENTAL listings here right now (not sales)? A rising rental-DOM trend means longer vacancies and softer asking-rent achievability than the comps imply.
- What's the recent tenant-quality profile in this submarket — average credit score on applications, eviction rate, late-payment / NSF rate, and stable-employment percentage? A property-management company in the area should have these aggregated.
- How much new for-sale + rental construction is in the pipeline within 1–3 miles? Heavy new supply typically softens prices + rents 12–24 months out; constrained supply supports both.
Investment metrics
- 1% rule
- 4.26% ✓
- Cap rate
- 38.36%
- Cash-on-cash
- 114.54%
- DSCR
- 6.10
- GRM
- 2.0
CMA / ARV
- ARV (on-the-fly)
- $133,056
- Comps found
- 12
Show comp detail 12 sales within ~0.75 mi
| Address | Dist | Beds/Ba | Sqft | Sold | Price | $/sf | Match |
|---|---|---|---|---|---|---|---|
| 220 Victory Dr | 0.12mi | 3/1.0 (+1) | 1,344 (0%) | 1mo | $112,000 | $83 | 88 |
| 101 Bonds Ave | 0.07mi | 2/1.0 | 1,222 (-9%) | 1mo | $132,000 | $108 | 81 |
| 104 Victory Dr | 0.09mi | 2/1.0 | 1,160 (-14%) | 10mo | $99,900 | $86 | 64 |
| 821 Center St | 0.52mi | 2/2.0 | 1,352 (+1%) | 8mo | $75,000 | $55 | 64 |
| 270 Victory Dr | 0.17mi | 3/2.0 (+1) | 1,215 (-10%) | 9mo | $172,900 | $142 | 60 |
| 104 N Pence St | 0.30mi | 3/1.5 (+1) | 1,204 (-10%) | 3mo | $20,000 | $17 | 60 |
| 108 Goulding St | 0.29mi | 3/1.0 (+1) | 1,513 (+13%) | 8mo | $47,500 | $31 | 54 |
| 124 Illinois St | 0.66mi | 3/2.0 (+1) | 1,316 (-2%) | 10mo | $149,900 | $114 | 49 |
| 116 Haller Ave | 0.75mi | 2/1.5 | 1,328 (-1%) | 15mo | $134,900 | $102 | 49 |
| 615 Bowman Ave | 0.65mi | 3/2.0 (+1) | 1,424 (+6%) | 4mo | $139,900 | $98 | 47 |
| 508 Washington Ave | 0.66mi | 3/2.0 (+1) | 1,283 (-4%) | 23mo | $163,000 | $127 | 34 |
| 505 Lincoln Ave | 0.68mi | 2/1.0 | 1,159 (-14%) | 14mo | $115,000 | $99 | 33 |
Match score weights: distance 35% · size 25% · config 20% · recency 20%. Top-matched comps best support the ARV.
Projected returns pro-forma
-3.0% appreciation · 3.0% rent growth · sell at horizon
- IRR
- —
- Equity multiple
- 6.50×
- Total profit
- $38,365
- Equity at exit
- $3,713
- IRR
- —
- Equity multiple
- 13.63×
- Total profit
- $88,049
- Equity at exit
- $2,153
Cash invested: $6,972 (down + closing). Projections, not guarantees.
Landlord ↔ Tenant lean methodology
- Overall (STATE)
- 43 Moderately Tenant-Leaning
- State Illinois
- 43 Moderately Tenant-Leaning · D+7
- County
- — inherits STATE
- City
- — inherits STATE
ZIP-level market 62024
- Home prices YoY
- -18.8%
- Active inventory
- 38
- Price-to-rent
- 2.0×
Monthly cashflow live
- Estimated rent
- $1,060 medium interval (Pro) →
- Mortgage (P&I)
- −$131
- Tax est. 1.5%
- −$31 /mo · $374/yr
- Insurance
- −$10
- HOA
- −$0
- Vacancy / Maint / Mgmt
- −$223
- Net cashflow
- $665
Break-even live
UW: 25.0% down · 7.5% · 30yr · 1.5% tax · 5.0% vac · 8.0% maint · 8.0% mgmt
Financing live
Cash to close
- Down payment
- $6,225
- Closing costs
- $747
- Reserves months
- —
- Total cash needed
- —
Loan-product check · same deal, 3 products live
Conventional
25% down · 7.5% · 30yr
- Down + closing
- —
- Monthly P&I
- —
- Monthly cashflow
- —
- DSCR
- —
- Eligible?
- —
Personal DTI + credit; lowest rate.
DSCR
20% down · 8.5% · 30yr
- Down + closing
- —
- Monthly P&I
- —
- Monthly cashflow
- —
- DSCR
- —
- Eligible?
- —
No personal income docs; deal must DSCR.
Hard money
10% down · 12.0% · 12mo
- Down + closing
- —
- Monthly P&I
- —
- Monthly cashflow
- —
- DSCR
- —
- Eligible?
- —
Short-term bridge; refi at stabilization.
Rent comps 4 comps
| Address | Beds | Baths | Sqft | Rent | $/sqft | DOM | Units | Dist |
|---|---|---|---|---|---|---|---|---|
| 176 S Pence St East Alton, IL | 2.0 | 1.0 | 1000 | $1,100 | $1.10 | 1d | 1 | 0.19mi |
| 140 Illinois St East Alton, IL | 2.0 | 1.0 | 960 | $695 | $0.72 | 1d | 1 | 0.64mi |
| 121 Cardot St East Alton, IL | 3.0 | 1.0 | 937 | $1,200 | $1.28 | 21d | 1 | 1.05mi |
| 3400 Milton Dr Alton, IL | 2.0 | 1.5 | 972 | $1,350 | $1.39 | 4d | 1 | 1.34mi |
Listing history 15 events
-
2026-06-18days on market $24,900 Active 78 DOM
-
2026-06-17days on market $24,900 Active 77 DOM
-
2026-06-16days on market $24,900 Active 76 DOM
-
2026-06-15days on market $24,900 Active 75 DOM
-
2026-06-13days on market $24,900 Active 73 DOM
-
2026-06-12days on market $24,900 Active 72 DOM
-
2026-06-09days on market $24,900 Active 69 DOM
-
2026-06-08days on market $24,900 Active 68 DOM
-
2026-06-07days on market $24,900 Active 67 DOM
-
2026-06-05days on market $24,900 Active 65 DOM
-
2026-05-23price $24,900
-
2026-05-19status Active
-
2026-04-24status Pending
-
2026-02-27$29,900 Active
-
1999-04-12soldstatus $35,000
ⓘ Source: listings_history table (triggers on properties + properties_extension) + one-shot
backfill from property_details.listing_events for pre-trigger history.
Climate risk First Street
- Flood 1/10 Low FEMA zone X · 0% chance over 30 yrs
- Wildfire 1/10 Low
- Heat 5/10 Major 7 d/yr ≥106°F today · 20 d/yr by 30 yrs out
- Wind 2/10 Low 100% chance of damaging wind over 30 yrs
- Air quality 3/10 Moderate 2 unhealthy d/yr today · 4 by 30 yrs out
Nearby sold comps map
Loading sold comps map…
Walkable amenities ~0.75 mi
Loading nearby amenities…
Taxation est. · year 1
- Rental income
- $12,722
- − Mortgage interest
- −$1,395
- − Property taxes
- −$374
- − Insurance
- −$124
- − Repairs & maintenance
- −$1,018
- − Management
- −$1,018
- − Depreciation
- −$724
- Taxable income
- $8,070
- Est. tax owed @ 24.0%
- −$1,937
- After-tax cash flow
- $6,049/yr
For passive investors: Depreciation is non-cash, so a rental often shows a tax loss while cash-flowing — sheltering income. Rental losses are passive: they offset passive income freely, and up to $25,000/yr can offset ordinary (W-2) income if you actively participate and your MAGI is under $100k (phasing out to $0 by $150k); unused losses carry forward. On sale, claimed depreciation is recaptured at up to 25%, and gains may owe capital-gains tax (a 1031 exchange can defer both). Figures are a year-1 estimate at your 24.0% rate — not tax advice; consult a CPA.
Schools (NCES district)
- District
- East Alton-Wood River Chsd 14
- NCES district ID
- 1712990
- Math proficiency
- 10% ▬ 0.00%
- Reading proficiency
- 20% ▬ 0.00%
- Median HH income
- $35,977
- Composite
- 15.86/100
- National rank
- #14315
- State rank
- #793 of 919 in IL
Livability — East Alton
- Score
- 69/100
- State rank
- #418
- US rank
- #8569
Category grades
Schools grade is shown separately in the Schools card above.
Census & demographics
- Census place
- East Alton, IL
- City population
- 9,465
- Population (ZIP)
- 9,465
Population outlook (Madison County) Hauer SSP2
- Today (2025)
- 258,371 people
- By 2030
- 251,523 · -2.7%
- By 2040
- 233,640 · -9.6%
- By 2050
- 213,042 · -17.5%
- By 2075
- 165,255 · -36.0%
- By 2100
- 123,953 · -52.0%
Race, ethnicity, and origin ACS 2023
- Neighborhood character
- Predominantly White (93%)
- Race & ethnicity
- White 93% Two or more races 5% Hispanic / Latino 2% Black 1%
- Common ancestry
- Lithuanian 4% Iranian 2% Italian 1%
- Foreign-born
- 0%
Political lean MEDSL · Madison
- 2024 margin
- R (+13.3) · D 42.5% · R 55.8% · Other 1.8%
- 2008→2024 swing
- -22.5pp toward R · 2008: 9.2pp · 2024: -13.3pp
- All cycles
- 2024: R+13.3 2020: R+13.2 2016: R+15.6 2012: R+1.4 2008: D+9.2
Not yet ingested
- Civics
- —
Market trends
- HPI YoY
- ▼ -50.18%
- Current HPI
- 216.1273
- Rent YoY
- —
- Metro
- —
- State GDP YoY
- ▲ 1.59%
- F500 in state
- 60
Industry mix (Fortune 500 HQ in IL)
| Industry | F500 HQs | Revenue |
|---|---|---|
| Insurance | 4 | $201B |
|
||
| Consumer Goods | 4 | $87B |
|
||
| Industrial Machinery | 3 | $64B |
|
||
| Healthcare | 2 | $55B |
|
||
| Retail / Pharmacy | 1 | $148B |
|
||
| Agriculture / Food | 1 | $86B |
|
||
Price history
-28.9% since first listed5 events — show timeline
- 2026-05-23 Price Changed $24,900 MARIS as Distributed by MLS Grid
- 2026-05-19 Relisted — MARIS as Distributed by MLS Grid
- 2026-04-24 Pending — MARIS as Distributed by MLS Grid
- 2026-02-27 Listed $29,900 MARIS as Distributed by MLS Grid
- 1999-04-12 Sold (Public Records) $35,000 Public Records
Property tax history
+3.9%/yrLatest (2024): $1,617 · +8.3% YoY. Source: county tax records.
Cash-flow waterfall
monthlySold comps — $/sqft
last 12 mo · ≤1 miLoading sold comps…