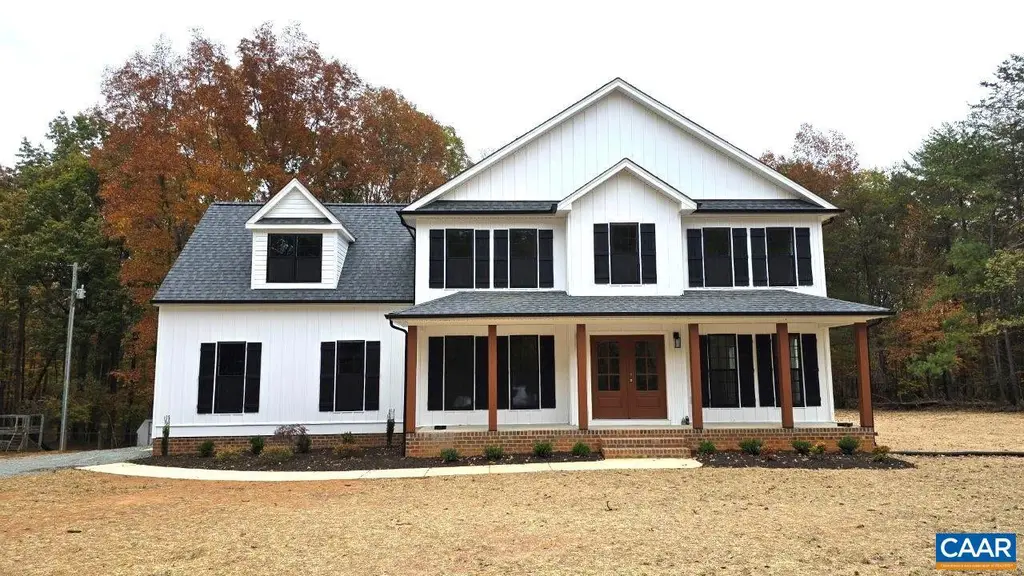
1232 Boston Rd N · Lake Monticello, VA
Flood risk 1/10 · Minimal
- FEMA flood zone
- X (unshaded)
- Chance of flooding over 30 yrs
- 0.0%
- Est. flood insurance / yr
- $507 – $1,088
Fire risk 5/10 · Moderate
- Est. fire insurance / yr
- $666 – $1,236
Heat risk 6/10 · Moderate
- Hot days now (above 104°F)
- 7 days/yr
- Hot days in 30 yrs
- 17 days/yr
Wind risk 3/10 · Minor
- Chance of severe wind over 30 yrs
- 4.0%
Air-quality risk 1/10 · Minimal
- Unhealthy air days now
- 0 days/yr
- Unhealthy air days in 30 yrs
- 0 days/yr
Risk factors via First Street. Map © Google.
Why this score? — see what drove the D- grade
The composite is a weighted blend of 9 inputs, each scored 0–100. Each bar is that input's sub-score; the figure is the points it added to the 100-point composite (weight × sub-score).
- Appreciation +10.0/10.0
- ARV discount +7.5/15.0
- Schools +5.8/10.0
- Cash flow +5.7/30.0
- Livability +3.4/5.0
- Rent growth +2.5/5.0
- Condition / age +2.5/5.0
- 1% rule +1.2/10.0
- DSCR +0.1/10.0
$498,113
🖨 Deal sheet (PDF) 📄 Offer letter ✓ Due diligence
Listing remarks
TO BE BUILT! The Ross model with upgrades galore 5 miles to Zion Crossroads! The welcoming front porch boasts 12” vertical Board and Batten siding on the front of the house, French front door with 3/4 glass, 2 wall lanterns and extra LED lights with dimmers, black gutters and windows, craftsman style shutters, stained columns, dormer, and a side load garage with opener. Interior upgrades include beautiful engineered hardwood flooring throughout the entire 1st floor, great room with fireplace, extra windows and LED lights, dining room with craftsman trim package, gourmet kitchen layout, upgraded stainless appliances, Granite counters, 3x8 double island with overhang and pendant lights,
Key facts
- 2.11 acre lot
- 2 garage spots
- Built 2026
Property features AI
Exterior
- Parking: Attached 2-car garage; Garage with electricity and garage door opener; Gravel parking; Garage faces side
- Security: Deadbolt locks; Smoke detectors
- Utilities: Private well water; Septic tank; Other utilities
- Home design: Detached property; Two levels; New construction; Model: THE ROSS
- Construction: Stick-built with vinyl siding; Block and brick/mortar foundation; Architectural roof
- Exterior features: Deck; Front porch; Porch; Garden; Partially cleared lot; Wooded lot; Crawl space basement
Interior
- Kitchen: Dishwasher; Electric range; Microwave
- Bedrooms: Primary bedroom (Second); Additional bedroom (Second)
- Flooring: Carpet; Ceramic tile; Hardwood; Vinyl
- Bathrooms: 2 full bathrooms; 1 half bathroom; 1 main-level bathroom
- Heating & cooling: Central heating (Heat pump); Central air (Heat pump)
- Interior features: Walk-in closets; Breakfast area; Entrance foyer; Eat-in kitchen; Kitchen island; Recessed lighting; Low-e windows; Tilt-in windows; Transom windows
- Laundry & utility: Washer hookup; Dryer hookup; Laundry room (Second)
Neighborhood map
What this means for you Summary
Snapshot
- This is a 4-bed/2.5-bath single-family listed at $498k.
Deal economics
- At list price, monthly cash flow is $-1k ($-12k/yr) — negative.
- To cash-flow at today's rent, offer at most $352k (29.4% below list).
- To meet the 1% rule (rent ≥ 1% of price), the offer needs to be $308k (38.3% below list).
- Recommended offer: $308k (38.3% below list) — sets the bar for 1% rule.
Location & tenants
- Location reads 67/100 on livability (#284 in VA) — a middle-class / working-renter tenant base. Strengths: employment A+, housing A+, crime A; Watch: amenities F, commute F, health & safety F.
- Fluvanna County Public School District (rural): math 61% / reading 71% proficiency, ranked #34 of 131 in VA (top 26%) — acceptable for families but not a draw, mixed tenant base, ~2y average lease.
- Zoned schools: Central Elementary (715 students, 52% FRL); Fluvanna Middle (math 65% / reading 70%, grade A-, #98 of 342 statewide, top 30%, 763 students, 42% FRL); Fluvanna County High (math 60% / reading 76%, grade B, #180 of 319 statewide, top 57%, 1,488 students, 37% FRL) — zoned schools average 44% FRL vs 23% district-wide (21 pts higher); higher-poverty schools than district average — tighter screening recommended.
- Market conditions: 28 active listings in the ZIP; 138 units permitted in Fluvanna County in 2024 (6 in 5+ unit buildings).
Forward outlook
- In year one you build about $53k of equity ($3k loan paydown + $50k appreciation (10.0% local appreciation)).
- By year 2, paydown + projected appreciation supports a ~$86k cash-out refi (75% LTV) — recoverable capital for the next deal without selling this one.
Negotiation context
- It's been on market 53 days — a 3% lower offer ($483k) is reasonable based on typical stale-listing flexibility.
Risks & watch-outs
- Climate carrying-cost: moderate wildfire risk; extreme-heat days projected 7→17/yr by 2055 (HVAC capex compounding) — expect insurance premiums to compound above CPI over the hold.
Questions for the listing agent
- What do current leases actually rent for vs. the listed asking? Can we see a recent rent roll and the last 12 months of T-12 income?
- It's been on market 53 days. Have you received any prior offers? Is the seller open to a 38% concession, seller financing, or rate buy-down credit?
- Is there a deadline driving the sale (1031 exchange, divorce, estate, relocation)? That informs how much negotiation room exists.
- Schools are D-rated, which usually means shorter tenancies and higher turnover. Who's the typical renter profile here, and what's been the actual vacancy rate?
- The area grade is low — what's the realistic commute time and amenity access for the typical tenant pool here? Any planned neighborhood developments (good or bad) we should know about?
- What's the average days-on-market for RENTAL listings here right now (not sales)? A rising rental-DOM trend means longer vacancies and softer asking-rent achievability than the comps imply.
- What's the recent tenant-quality profile in this submarket — average credit score on applications, eviction rate, late-payment / NSF rate, and stable-employment percentage? A property-management company in the area should have these aggregated.
- How much new for-sale + rental construction is in the pipeline within 1–3 miles? Heavy new supply typically softens prices + rents 12–24 months out; constrained supply supports both.
Investment metrics
- 1% rule
- 0.62% ✗
- Cap rate
- 3.85%
- Cash-on-cash
- -8.72%
- DSCR
- 0.61
- GRM
- 13.5
CMA / ARV
No comps found within radius.
Projected returns pro-forma
10.0% appreciation · 3.0% rent growth · sell at horizon
- IRR
- 18.1%
- Equity multiple
- 2.48×
- Total profit
- $206,812
- Equity at exit
- $448,740
- IRR
- 17.0%
- Equity multiple
- 5.73×
- Total profit
- $659,857
- Equity at exit
- $967,724
Cash invested: $139,472 (down + closing). Projections, not guarantees.
Landlord ↔ Tenant lean methodology
- Overall (STATE)
- 55 Moderately Landlord-Leaning
- State Virginia
- 55 Moderately Landlord-Leaning · D+2
- County
- — inherits STATE
- City
- — inherits STATE
ZIP-level market 22974
- Home prices YoY
- 12.0%
- Active inventory
- 28
- Price-to-rent
- 13.5×
Monthly cashflow live
- Estimated rent
- $3,075 medium interval (Pro) →
- Mortgage (P&I)
- −$2,612
- Tax est. 1.5%
- −$623 /mo · $7,472/yr
- Insurance
- −$208
- HOA
- −$0
- Vacancy / Maint / Mgmt
- −$646
- Net cashflow
- $-1,013
Break-even live
Sensitivity live
| Price | -10% $-669 | -5% $-841 | +0% $-1,013 | +5% $-1,185 | +10% $-1,357 |
|---|---|---|---|---|---|
| Rent | -10% $-1,256 | -5% $-1,134 | +0% $-1,013 | +5% $-892 | +10% $-770 |
| Rate | -1.0pp $-762 | -0.5pp $-886 | base $-1,013 | +0.5pp $-1,142 | +1.0pp $-1,273 |
UW: 25.0% down · 7.5% · 30yr · 1.5% tax · 5.0% vac · 8.0% maint · 8.0% mgmt
Financing live
Cash to close
- Down payment
- $124,528
- Closing costs
- $14,943
- Reserves months
- —
- Total cash needed
- —
Loan-product check · same deal, 3 products live
Conventional
25% down · 7.5% · 30yr
- Down + closing
- —
- Monthly P&I
- —
- Monthly cashflow
- —
- DSCR
- —
- Eligible?
- —
Personal DTI + credit; lowest rate.
DSCR
20% down · 8.5% · 30yr
- Down + closing
- —
- Monthly P&I
- —
- Monthly cashflow
- —
- DSCR
- —
- Eligible?
- —
No personal income docs; deal must DSCR.
Hard money
10% down · 12.0% · 12mo
- Down + closing
- —
- Monthly P&I
- —
- Monthly cashflow
- —
- DSCR
- —
- Eligible?
- —
Short-term bridge; refi at stabilization.
Listing history 14 events
-
2026-06-21days on market $498,113 Active 53 DOM
-
2026-06-19days on market $498,113 Active 51 DOM
-
2026-06-18days on market $498,113 Active 50 DOM
-
2026-06-17days on market $498,113 Active 49 DOM
-
2026-06-16days on market $498,113 Active 48 DOM
-
2026-06-15days on market $498,113 Active 47 DOM
-
2026-06-14days on market $498,113 Active 45 DOM
-
2026-06-13days on market $498,113 Active 44 DOM
-
2026-06-10days on market $498,113 Active 42 DOM
-
2026-06-09days on market $498,113 Active 41 DOM
-
2026-06-08days on market $498,113 Active 40 DOM
-
2026-06-07days on market $498,113 Active 39 DOM
-
2026-06-03remarks 693-char remark
-
2026-06-03$498,113 Active 34 DOM
ⓘ Source: listings_history table (triggers on properties + properties_extension) + one-shot
backfill from property_details.listing_events for pre-trigger history.
Climate risk First Street
- Flood 1/10 Low FEMA zone X (unshaded) · 0% chance over 30 yrs
- Wildfire 5/10 Major
- Heat 6/10 Major 7 d/yr ≥104°F today · 17 d/yr by 30 yrs out
- Wind 3/10 Moderate 4% chance of damaging wind over 30 yrs
- Air quality 1/10 Low 0 unhealthy d/yr today · 0 by 30 yrs out
Nearby sold comps map
Loading sold comps map…
Walkable amenities ~0.75 mi
Loading nearby amenities…
Taxation est. · year 1
- Rental income
- $36,901
- − Mortgage interest
- −$27,902
- − Property taxes
- −$7,472
- − Insurance
- −$2,491
- − Repairs & maintenance
- −$2,952
- − Management
- −$2,952
- − Depreciation
- −$14,491
- Taxable loss
- −$21,358
- Est. tax savings @ 24.0%
- +$5,126
- After-tax cash flow
- $-7,030/yr
For passive investors: Depreciation is non-cash, so a rental often shows a tax loss while cash-flowing — sheltering income. Rental losses are passive: they offset passive income freely, and up to $25,000/yr can offset ordinary (W-2) income if you actively participate and your MAGI is under $100k (phasing out to $0 by $150k); unused losses carry forward. On sale, claimed depreciation is recaptured at up to 25%, and gains may owe capital-gains tax (a 1031 exchange can defer both). Figures are a year-1 estimate at your 24.0% rate — not tax advice; consult a CPA.
Schools (NCES district)
- District
- Fluvanna County Public School District
- NCES district ID
- 5101380
- Math proficiency
- 61% ▼ -23.00%
- Reading proficiency
- 71% ▼ -4.00%
- Median HH income
- $66,601
- Composite
- 57.6/100
- National rank
- #1065
- State rank
- #34 of 131 in VA
Livability — Lake Monticello
- Score
- 67/100
- State rank
- #284
- US rank
- #10173
Category grades
Schools grade is shown separately in the Schools card above.
Census & demographics
- Population (ZIP)
- 5,123
Population outlook (Fluvanna County) Hauer SSP2
- Today (2025)
- 27,237 people
- By 2030
- 27,607 · +1.4%
- By 2040
- 28,075 · +3.1%
- By 2050
- 28,019 · +2.9%
- By 2075
- 28,058 · +3.0%
- By 2100
- 26,124 · -4.1%
Race, ethnicity, and origin ACS 2023
- Neighborhood character
- Predominantly White (73%)
- Race & ethnicity
- White 73% Black 14% Two or more races 6% Hispanic / Latino 4%
- Common ancestry
- Iranian 4% Lithuanian 3% Romanian 1%
- Foreign-born
- 2% · Canada, South Korea
- Languages at home
- 94% English-only · Spanish 3% Other Indo-European 1% German/W. Germanic 1%
Political lean MEDSL · Fluvanna
- 2024 margin
- Lean R (+6.3) · D 46.4% · R 52.6% · Other 1.0%
- 2008→2024 swing
- -4.4pp toward R · 2008: -1.8pp · 2024: -6.3pp
- All cycles
- 2024: R+6.3 2020: R+4.7 2016: R+9.4 2012: R+6.2 2008: R+1.8
Not yet ingested
- Civics
- —
Market trends
- HPI YoY
- ▲ 37.70%
- Current HPI
- 351.8003
- Rent YoY
- —
- Metro
- —
- State GDP YoY
- ▲ 2.40%
- F500 in state
- 50
Industry mix (Fortune 500 HQ in VA)
| Industry | F500 HQs | Revenue |
|---|---|---|
| Aerospace / Defense | 4 | $236B |
|
||
| Technology / Defense | 3 | $32B |
|
||
| Financial Services | 2 | $176B |
|
||
| Utilities | 2 | $27B |
|
||
| Insurance | 2 | $25B |
|
||
| Technology | 2 | $15B |
|
||
Price history
1 event — show timeline
- 2026-04-29 Listed $498,113 CAAR
Cash-flow waterfall
monthlySold comps — $/sqft
last 12 mo · ≤1 miLoading sold comps…