27381 99th St · Coweta, OK
Flood risk 1/10 · Minimal
- FEMA flood zone
- X (unshaded)
- Chance of flooding over 30 yrs
- 0.0%
- Est. flood insurance / yr
- $507 – $1,088
Fire risk 3/10 · Minor
- Est. fire insurance / yr
- $2,463 – $4,575
Heat risk 6/10 · Moderate
- Hot days now (above 110°F)
- 7 days/yr
- Hot days in 30 yrs
- 18 days/yr
Wind risk 3/10 · Minor
- Chance of severe wind over 30 yrs
- 4.0%
Air-quality risk 1/10 · Minimal
- Unhealthy air days now
- 0 days/yr
- Unhealthy air days in 30 yrs
- 0 days/yr
Risk factors via First Street. Map © Google.
Why this score? — see what drove the C- grade
The composite is a weighted blend of 9 inputs, each scored 0–100. Each bar is that input's sub-score; the figure is the points it added to the 100-point composite (weight × sub-score).
- Cash flow +21.8/30.0
- ARV discount +7.5/15.0
- DSCR +7.0/10.0
- 1% rule +5.7/10.0
- Livability +3.4/5.0
- Rent growth +3.0/5.0
- Condition / age +2.5/5.0
- Schools +2.4/10.0
- Appreciation +0.0/10.0
$173,000
🖨 Deal sheet 📄 Offer letter ✓ Due diligence
Listing remarks
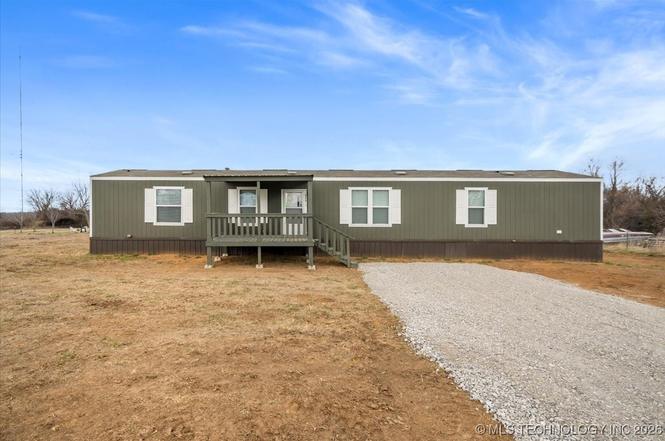
Well-maintained 2018 Clayton model situated on a spacious ½-acre lot, offering comfort, functionality, and modern appeal. This lightly lived-in home features 3 bedrooms and 2 bathrooms, with an inviting open-concept layout perfect for everyday living and entertaining. The main living areas are finished with durable laminate flooring, while the kitchen is highlighted by a central island that anchors the space. Enjoy relaxing mornings or evenings on the covered front porch, adding to the home’s overall charm and livability.
Key facts
- Covered front porch
- Central island
- 0.45 acre lot
Tags
Property features AI
Exterior
- Security: Smoke detectors; No safety shelter
- Utilities: Electricity available; Natural gas available; Phone available; Water available (rural); Aerobic septic system
- Home design: Single wide manufactured home; Single-story; Faces south; Tie-down foundation
- Construction: Built by builder (year built source: Builder); Manufactured construction with vinyl siding; Asphalt/fiberglass roof
- Exterior features: Covered porch
Interior
- Kitchen: Dishwasher; Disposal; Microwave; Oven; Range; Refrigerator
- Flooring: Carpet; Laminate
- Bathrooms: 2 full bathrooms
- Heating & cooling: Central heating (gas); Central air conditioning
- Interior features: Vinyl insulated windows; Insulated doors; Laminate counters; Gas range and gas oven connections; No specified additional interior exterior features
- Laundry & utility: Washer hookup; Dryer hookup (electric and gas); Washer and Dryer included
Neighborhood map
What this means for you Summary
Snapshot
- This is a 3-bed/2.0-bath manufactured listed at $173k.
Deal economics
- At list price, monthly cash flow is $270 ($3k/yr) — positive.
- The deal already cash-flows at list — no discount required.
- Meets the 1% rule at list price ($2k rent vs $173k).
- Recommended offer: $152k (12.0% below list) — sets the bar for market timing.
- Cap rate 8.2% vs local median 3.9% in Coweta — top-decile yield for the area; either an underpriced asset or a hidden risk that comps aren't pricing in. Stress-test before assuming the spread holds.
Location & tenants
- Location reads 68/100 on livability (#73 in OK) — a middle-class / working-renter tenant base. Strengths: crime A+, cost of living A+, housing A+; Watch: schools D-, amenities F, commute F.
- Broken Arrow (suburban): math 23% / reading 28% proficiency, ranked #79 of 270 in OK (top 29%) — low school quality limits family demand, transient renter base, plan for 1-2y turnover.
- Market conditions: Rents rising (+2.1%/yr); 652 active listings in the ZIP; 1 comparable units currently listed for rent nearby; solid renter incomes; 581 units permitted in Wagoner County in 2024 (0 in 5+ unit buildings).
Forward outlook
- Local home prices are declining (-3.0%/yr); year-one equity from $1k of loan paydown is wiped out by about $5k of value loss. Plan a longer hold.
- Wagoner County population projected at +16% by 2050 — long-run rental-demand tailwind backs the buy-and-hold thesis.
Negotiation context
- It's been on market 143 days — a 12% lower offer ($152k) is reasonable based on typical stale-listing flexibility.
Risks & watch-outs
- Climate carrying-cost: extreme-heat days projected 7→18/yr by 2055 (HVAC capex compounding) — expect insurance premiums to compound above CPI over the hold.
Questions for the listing agent
- It's been on market 143 days. Have you received any prior offers? Is the seller open to a 12% concession, seller financing, or rate buy-down credit?
- Why hasn't it sold? Are there any deal-killer items the seller is aware of (foundation, flood, title, zoning, code violations)?
- Is there a deadline driving the sale (1031 exchange, divorce, estate, relocation)? That informs how much negotiation room exists.
- Schools are D-rated, which usually means shorter tenancies and higher turnover. Who's the typical renter profile here, and what's been the actual vacancy rate?
- What's the average days-on-market for RENTAL listings here right now (not sales)? A rising rental-DOM trend means longer vacancies and softer asking-rent achievability than the comps imply.
- What's the recent tenant-quality profile in this submarket — average credit score on applications, eviction rate, late-payment / NSF rate, and stable-employment percentage? A property-management company in the area should have these aggregated.
- How much new for-sale + rental construction is in the pipeline within 1–3 miles? Heavy new supply typically softens prices + rents 12–24 months out; constrained supply supports both.
Investment metrics
- 1% rule
- 1.07% ✓
- Cap rate
- 8.16%
- Cash-on-cash
- 6.69%
- DSCR
- 1.30
- GRM
- 7.8
CMA / ARV
No comps found within radius.
Projected returns pro-forma
-3.0% appreciation · 2.12% rent growth · sell at horizon
- IRR
- -7.0%
- Equity multiple
- 0.74×
- Total profit
- $-12,446
- Equity at exit
- $25,795
- IRR
- 1.5%
- Equity multiple
- 1.10×
- Total profit
- $4,844
- Equity at exit
- $14,958
Cash invested: $48,440 (down + closing). Projections, not guarantees.
Landlord ↔ Tenant lean methodology
- Overall (STATE)
- 83 Strongly Landlord-Friendly
- State Oklahoma
- 83 Strongly Landlord-Friendly · R+20
- County
- — inherits STATE
- City
- — inherits STATE
ZIP-level market 74014
- Rents YoY
- 2.1%
- Active inventory
- 652
- Price-to-rent
- 7.8×
Monthly cashflow live
- Estimated rent
- $1,855 medium interval (Pro) →
- Mortgage (P&I)
- −$907
- Tax est. 1.5%
- −$216 /mo · $2,595/yr
- Insurance
- −$72
- HOA
- −$0
- Vacancy / Maint / Mgmt
- −$390
- Net cashflow
- $270
Break-even live
UW: 25.0% down · 7.5% · 30yr · 1.5% tax · 5.0% vac · 8.0% maint · 8.0% mgmt
Financing live
Cash to close
- Down payment
- $43,250
- Closing costs
- $5,190
- Reserves months
- —
- Total cash needed
- —
Loan-product check · same deal, 3 products live
Conventional
25% down · 7.5% · 30yr
- Down + closing
- —
- Monthly P&I
- —
- Monthly cashflow
- —
- DSCR
- —
- Eligible?
- —
Personal DTI + credit; lowest rate.
DSCR
20% down · 8.5% · 30yr
- Down + closing
- —
- Monthly P&I
- —
- Monthly cashflow
- —
- DSCR
- —
- Eligible?
- —
No personal income docs; deal must DSCR.
Hard money
10% down · 12.0% · 12mo
- Down + closing
- —
- Monthly P&I
- —
- Monthly cashflow
- —
- DSCR
- —
- Eligible?
- —
Short-term bridge; refi at stabilization.
Rent comps 1 comps
| Address | Beds | Baths | Sqft | Rent | $/sqft | DOM | Units | Dist |
|---|---|---|---|---|---|---|---|---|
| 9127 S 256th East Ave Broken Arrow, OK | 3.0 | 2.0 | 1455 | $1,750 | $1.20 | 1d | 1 | 1.34mi |
Listing history 18 events
-
2026-06-18days on market $173,000 Active 143 DOM
-
2026-06-17days on market $173,000 Active 142 DOM
-
2026-06-16days on market $173,000 Active 141 DOM
-
2026-06-15days on market $173,000 Active 140 DOM
-
2026-06-13days on market $173,000 Active 138 DOM
-
2026-06-10days on market $173,000 Active 135 DOM
-
2026-06-09days on market $173,000 Active 134 DOM
-
2026-06-08days on market $173,000 Active 133 DOM
-
2026-06-07days on market $173,000 Active 132 DOM
-
2026-06-05days on market $173,000 Active 129 DOM
-
2026-06-03days on market $173,000 Active 128 DOM
-
2026-06-02days on market $173,000 Active 127 DOM
-
2026-06-01days on market $173,000 Active 126 DOM
-
2026-05-31days on market $173,000 Active 125 DOM
-
2026-05-07price $175,000
-
2026-04-13price $177,000
-
2026-03-30price $179,000
-
2026-01-26$180,000 Active
ⓘ Source: listings_history table (triggers on properties + properties_extension) + one-shot
backfill from property_details.listing_events for pre-trigger history.
Climate risk First Street
- Flood 1/10 Low FEMA zone X (unshaded) · 0% chance over 30 yrs
- Wildfire 3/10 Moderate
- Heat 6/10 Major 7 d/yr ≥110°F today · 18 d/yr by 30 yrs out
- Wind 3/10 Moderate 4% chance of damaging wind over 30 yrs
- Air quality 1/10 Low 0 unhealthy d/yr today · 0 by 30 yrs out
Nearby sold comps map
Loading sold comps map…
Walkable amenities ~0.75 mi
Loading nearby amenities…
Taxation est. · year 1
- Rental income
- $22,260
- − Mortgage interest
- −$9,691
- − Property taxes
- −$2,595
- − Insurance
- −$865
- − Repairs & maintenance
- −$1,781
- − Management
- −$1,781
- − Depreciation
- −$5,033
- Taxable income
- $515
- Est. tax owed @ 24.0%
- −$124
- After-tax cash flow
- $3,115/yr
For passive investors: Depreciation is non-cash, so a rental often shows a tax loss while cash-flowing — sheltering income. Rental losses are passive: they offset passive income freely, and up to $25,000/yr can offset ordinary (W-2) income if you actively participate and your MAGI is under $100k (phasing out to $0 by $150k); unused losses carry forward. On sale, claimed depreciation is recaptured at up to 25%, and gains may owe capital-gains tax (a 1031 exchange can defer both). Figures are a year-1 estimate at your 24.0% rate — not tax advice; consult a CPA.
Schools (NCES district)
- District
- Broken Arrow
- NCES district ID
- 4005490
- Math proficiency
- 23% ▼ -9.00%
- Reading proficiency
- 28% ▼ -9.00%
- Median HH income
- $64,646
- Composite
- 23.86/100
- National rank
- #7801
- State rank
- #79 of 270 in OK
Livability — Coweta
- Score
- 68/100
- State rank
- #73
- US rank
- #9871
Category grades
Schools grade is shown separately in the Schools card above.
Census & demographics
- County
- Wagoner County · 61,834 people
- City population
- 16,622
- Metro
- Tulsa, OK
- Population (ZIP)
- 45,212
- Household income
- $95,501
- Rent vs Own
- Severe rent burden
- 289.0
Population outlook (Wagoner County) Hauer SSP2
- Today (2025)
- 84,796 people
- By 2030
- 88,162 · +4.0%
- By 2040
- 93,882 · +10.7%
- By 2050
- 98,219 · +15.8%
- By 2075
- 106,561 · +25.7%
- By 2100
- 109,360 · +29.0%
Race, ethnicity, and origin ACS 2023
- Neighborhood character
- Predominantly White (69%)
- Race & ethnicity
- White 69% Two or more races 11% Hispanic / Latino 11% Native American 6% Asian 4% Black 3%
- Hispanic origin (detail)
- Mexican 8%
- Common ancestry
- Italian 2% Slovak 2% Lithuanian 2%
- Foreign-born
- 7% · Canada
- Languages at home
- 89% English-only · Spanish 7% Other Asian/Pacific 2% Russian/Polish/Slavic 1%
Political lean MEDSL · Wagoner
- 2024 margin
- Solid R (+49.8) · D 24.2% · R 74.0% · Other 1.8%
- 2008→2024 swing
- -8.0pp toward R · 2008: -41.8pp · 2024: -49.8pp
- All cycles
- 2024: R+49.8 2020: R+50.1 2016: R+52.0 2012: R+45.7 2008: R+41.8
Not yet ingested
- Civics
- —
Market trends
- HPI YoY
- ▼ -206.67%
- Current HPI
- 203.7301
- Rent YoY
- ▲ 2.12%
- Metro
- Tulsa, OK
- State GDP YoY
- ▲ 1.55%
- F500 in state
- 6
Industry mix (Fortune 500 HQ in OK)
| Industry | F500 HQs | Revenue |
|---|---|---|
| Energy | 3 | $48B |
|
||
Price history
-2.8% since first listed4 events — show timeline
- 2026-05-07 Price Changed $175,000 MLS Technology, Inc.
- 2026-04-13 Price Changed $177,000 MLS Technology, Inc.
- 2026-03-30 Price Changed $179,000 MLS Technology, Inc.
- 2026-01-26 Listed $180,000 MLS Technology, Inc.
Cash-flow waterfall
monthlySold comps — $/sqft
last 12 mo · ≤1 miLoading sold comps…