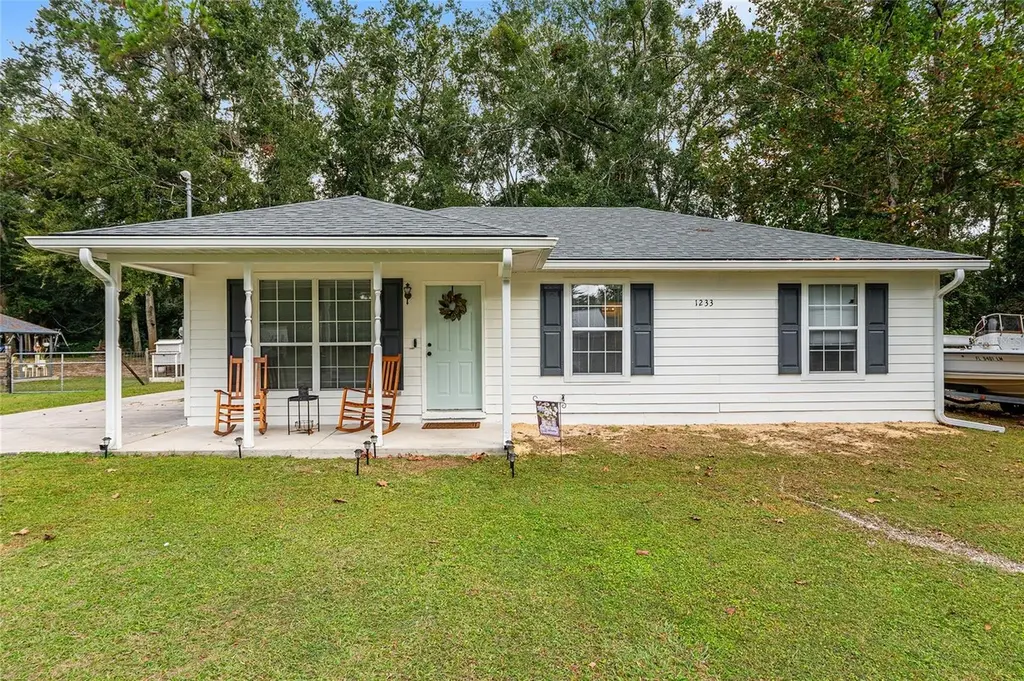
1233 SW 4th Ave · Trenton, FL
Flood risk 6/10 · Moderate
- FEMA flood zone
- X (unshaded)
- Chance of flooding over 30 yrs
- 0.72%
- Est. flood insurance / yr
- $507 – $1,088
Fire risk 5/10 · Moderate
- Est. fire insurance / yr
- $947 – $1,759
Heat risk 8/10 · Major
- Hot days now (above 108°F)
- 6 days/yr
- Hot days in 30 yrs
- 19 days/yr
Wind risk 9/10 · Severe
- Chance of severe wind over 30 yrs
- 99.0%
Air-quality risk 3/10 · Minor
- Unhealthy air days now
- 2 days/yr
- Unhealthy air days in 30 yrs
- 3 days/yr
Risk factors via First Street. Map © Google.
Why this score? — see what drove the D+ grade
The composite is a weighted blend of 9 inputs, each scored 0–100. Each bar is that input's sub-score; the figure is the points it added to the 100-point composite (weight × sub-score).
- Cash flow +11.0/30.0
- Appreciation +10.0/10.0
- ARV discount +7.0/15.0
- Schools +5.3/10.0
- Livability +3.9/5.0
- DSCR +3.2/10.0
- 1% rule +2.5/10.0
- Rent growth +2.5/5.0
- Condition / age +2.5/5.0
$225,000
🖨 Deal sheet 📄 Offer letter ✓ Due diligence
Listing remarks MLS
Great location! NEW SHINGLE ROOF INSTALLED 5/2023. This 3 bed 2 bath home is located in the heart of Trenton. Tons of potential to make this yours, perfect for a starter home. Call to set up a tour.
Key facts
- Spacious front yard
- Large backyard
- Cozy front porch
Tags
Property features AI
Finance
- Other: Lot size approximately 0.34 acre (1/4 to less than 1/2 acre)
- Financial info: No lease restrictions; Tax information not included per instructions
- HOA & community: No HOA/association
Exterior
- Parking: Parking details not provided
- Utilities: Public water; Septic tank sewer; Electricity connected; Water connected
- Home design: Single family residence; Residential property; One story; Faces south; Homestead exempt
- Construction: Shingle roof; Slab foundation; Built with typical residential construction (year not provided)
- Exterior features: Other exterior features; Paved road access
Interior
- Kitchen: Dishwasher; Microwave; Range; Refrigerator; Electric water heater
- Bedrooms: 3 bedrooms
- Flooring: Vinyl flooring
- Bathrooms: 2 full bathrooms
- Heating & cooling: Central heating; Central air conditioning
- Interior features: Ceiling fans; Living room/dining room combo
- Laundry & utility: Laundry in kitchen; Laundry closet
Neighborhood map
What this means for you Summary
Snapshot
- This is a 3-bed/2.0-bath single-family listed at $225k.
Deal economics
- At list price, monthly cash flow is $-95 ($-1k/yr) — negative.
- To cash-flow at today's rent, offer at most $208k (7.5% below list).
- To meet the 1% rule (rent ≥ 1% of price), the offer needs to be $170k (24.5% below list).
- Recommended offer: $170k (24.5% below list) — sets the bar for 1% rule.
Location & tenants
- Location reads 77/100 on livability (#207 in FL, #3,078 nationally) — a middle-class / working-renter tenant base. Strengths: crime A+, cost of living A+, housing A+; Watch: amenities F, commute F, employment F.
- Gilchrist (rural): math 66% / reading 61% proficiency, ranked #9 of 73 in FL (top 12%) — acceptable for families but not a draw, mixed tenant base, ~2y average lease.
- Zoned schools: Trenton Elementary School (math 71% / reading 59%, grade B+, #514 of 2,144 statewide, top 24%, 809 students, 58% FRL); Trenton High School (math 71% / reading 63%, grade B, #69 of 667 statewide, top 11%, 715 students, 48% FRL) — zoned schools at 53% FRL track the district average.
- Market conditions: 199 active listings in the ZIP; 94 units permitted in Gilchrist County in 2024 (0 in 5+ unit buildings).
Forward outlook
- In year one you build about $24k of equity ($2k loan paydown + $22k appreciation (10.0% local appreciation)).
- Gilchrist County population projected to shrink 6% by 2050 — rents likely to lag national; underwrite the cash flow, not the appreciation.
- By year 2, paydown + projected appreciation supports a ~$39k cash-out refi (75% LTV) — recoverable capital for the next deal without selling this one.
Negotiation context
- It's been on market 187 days — a 12% lower offer ($198k) is reasonable based on typical stale-listing flexibility.
- 3 sale attempts since 3y ago with the ask held roughly flat each time — persistent listings suggest the price (not the market) is what's stuck; bring a comps-based counter.
- Current owner paid $185k; 22% above their basis — modest negotiation headroom, anchor on the comps not their cost.
Risks & watch-outs
- Climate carrying-cost: major flood risk; severe wind risk, 99% chance of damaging wind over 30y; moderate wildfire risk; extreme-heat days projected 6→19/yr by 2055 (HVAC capex compounding) — expect insurance premiums to compound above CPI over the hold.
Questions for the listing agent
- What do current leases actually rent for vs. the listed asking? Can we see a recent rent roll and the last 12 months of T-12 income?
- It's been on market 187 days. Have you received any prior offers? Is the seller open to a 25% concession, seller financing, or rate buy-down credit?
- Why hasn't it sold? Are there any deal-killer items the seller is aware of (foundation, flood, title, zoning, code violations)?
- Is there a deadline driving the sale (1031 exchange, divorce, estate, relocation)? That informs how much negotiation room exists.
- Schools are B-rated — typically a magnet for longer-tenancy family renters. What's the average tenant stay here, and is there a school-zone premium baked into asking?
- The area grade is low — what's the realistic commute time and amenity access for the typical tenant pool here? Any planned neighborhood developments (good or bad) we should know about?
- What's the average days-on-market for RENTAL listings here right now (not sales)? A rising rental-DOM trend means longer vacancies and softer asking-rent achievability than the comps imply.
- What's the recent tenant-quality profile in this submarket — average credit score on applications, eviction rate, late-payment / NSF rate, and stable-employment percentage? A property-management company in the area should have these aggregated.
- How much new for-sale + rental construction is in the pipeline within 1–3 miles? Heavy new supply typically softens prices + rents 12–24 months out; constrained supply supports both.
Investment metrics
- 1% rule
- 0.75% ✗
- Cap rate
- 5.79%
- Cash-on-cash
- -1.81%
- DSCR
- 0.92
- GRM
- 11.0
CMA / ARV
- ARV (on-the-fly)
- $222,560
- Comps found
- 5
Show comp detail 5 sales within ~0.75 mi
| Address | Dist | Beds/Ba | Sqft | Sold | Price | $/sf | Match |
|---|---|---|---|---|---|---|---|
| 1233 SW 4th Ave | 0.00mi | 3/2.0 | 1,040 (0%) | 1mo | $220,000 | $212 | 100 |
| 1800 SW 19th Cir | 0.54mi | 2/2.0 (-1) | 1,040 (0%) | 3mo | $249,000 | $239 | 67 |
| 872 SW 2nd Ave | 0.26mi | 3/2.0 | 1,137 (+9%) | 7mo | $235,000 | $207 | 66 |
| 1125 SW Ninth Ave | 0.21mi | 2/2.0 (-1) | 960 (-8%) | 18mo | $260,000 | $271 | 58 |
| 418 SW Fifth Ave | 0.53mi | 3/1.0 | 960 (-8%) | 4mo | $205,000 | $214 | 55 |
Match score weights: distance 35% · size 25% · config 20% · recency 20%. Top-matched comps best support the ARV.
Projected returns pro-forma
10.0% appreciation · 3.0% rent growth · sell at horizon
- IRR
- 23.0%
- Equity multiple
- 2.85×
- Total profit
- $116,431
- Equity at exit
- $202,698
- IRR
- 20.5%
- Equity multiple
- 6.52×
- Total profit
- $347,545
- Equity at exit
- $437,126
Cash invested: $63,000 (down + closing). Projections, not guarantees.
Landlord ↔ Tenant lean methodology
- Overall (STATE)
- 87 Strongly Landlord-Friendly
- State Florida
- 87 Strongly Landlord-Friendly · R+3
- County
- — inherits STATE
- City
- — inherits STATE
ZIP-level market 32693
- Home prices YoY
- 14.8%
- Active inventory
- 199
- Price-to-rent
- 11.0×
Monthly cashflow live
- Estimated rent
- $1,698 medium interval (Pro) →
- Mortgage (P&I)
- −$1,180
- Tax from tax record
- −$163 /mo · $1,955/yr
- Insurance
- −$94
- HOA
- −$0
- Vacancy / Maint / Mgmt
- −$357
- Net cashflow
- $-95
Break-even live
UW: 25.0% down · 7.5% · 30yr · 1.5% tax · 5.0% vac · 8.0% maint · 8.0% mgmt
Financing live
Cash to close
- Down payment
- $56,250
- Closing costs
- $6,750
- Reserves months
- —
- Total cash needed
- —
Loan-product check · same deal, 3 products live
Conventional
25% down · 7.5% · 30yr
- Down + closing
- —
- Monthly P&I
- —
- Monthly cashflow
- —
- DSCR
- —
- Eligible?
- —
Personal DTI + credit; lowest rate.
DSCR
20% down · 8.5% · 30yr
- Down + closing
- —
- Monthly P&I
- —
- Monthly cashflow
- —
- DSCR
- —
- Eligible?
- —
No personal income docs; deal must DSCR.
Hard money
10% down · 12.0% · 12mo
- Down + closing
- —
- Monthly P&I
- —
- Monthly cashflow
- —
- DSCR
- —
- Eligible?
- —
Short-term bridge; refi at stabilization.
Listing history 9 events
-
2026-05-06status Pending
-
2026-03-30price $225,000
-
2026-02-05price $230,000
-
2025-10-31$235,000 Active
-
2023-06-23soldstatus $185,000 Closed 198-char remark
Show marketing remark (198 chars)
Great location! NEW SHINGLE ROOF INSTALLED 5/2023. This 3 bed 2 bath home is located in the heart of Trenton. Tons of potential to make this yours, perfect for a starter home. Call to set up a tour.
-
2023-05-12status Pending 198-char remark
Show marketing remark (198 chars)
Great location! NEW SHINGLE ROOF INSTALLED 5/2023. This 3 bed 2 bath home is located in the heart of Trenton. Tons of potential to make this yours, perfect for a starter home. Call to set up a tour.
-
2023-03-30status Active 198-char remark
Show marketing remark (198 chars)
Great location! NEW SHINGLE ROOF INSTALLED 5/2023. This 3 bed 2 bath home is located in the heart of Trenton. Tons of potential to make this yours, perfect for a starter home. Call to set up a tour.
-
2023-03-14status Pending 198-char remark
Show marketing remark (198 chars)
Great location! NEW SHINGLE ROOF INSTALLED 5/2023. This 3 bed 2 bath home is located in the heart of Trenton. Tons of potential to make this yours, perfect for a starter home. Call to set up a tour.
-
2023-01-22$195,000 Active 198-char remark
Show marketing remark (198 chars)
Great location! NEW SHINGLE ROOF INSTALLED 5/2023. This 3 bed 2 bath home is located in the heart of Trenton. Tons of potential to make this yours, perfect for a starter home. Call to set up a tour.
ⓘ Source: listings_history table (triggers on properties + properties_extension) + one-shot
backfill from property_details.listing_events for pre-trigger history.
Tax reassessment forecast FL · Resets to sale price
- Current annual tax
- $1,955 · $163/mo
- Projected year-2 tax
- $1,955 · $163/mo
- Expected delta
- $0/yr ($0/mo · -0.0%)
ⓘ Screening estimate from a state-policy table — verify with the county assessor before closing.
Climate risk First Street
- Flood 6/10 Major FEMA zone X (unshaded) · 72% chance over 30 yrs
- Wildfire 5/10 Major
- Heat 8/10 Severe 6 d/yr ≥108°F today · 19 d/yr by 30 yrs out
- Wind 9/10 Extreme 99% chance of damaging wind over 30 yrs
- Air quality 3/10 Moderate 2 unhealthy d/yr today · 3 by 30 yrs out
Nearby sold comps map
Loading sold comps map…
Walkable amenities ~0.75 mi
Loading nearby amenities…
Taxation est. · year 1
- Rental income
- $20,375
- − Mortgage interest
- −$12,603
- − Property taxes
- −$1,955
- − Insurance
- −$1,125
- − Repairs & maintenance
- −$1,630
- − Management
- −$1,630
- − Depreciation
- −$6,545
- Taxable loss
- −$5,113
- Est. tax savings @ 24.0%
- +$1,227
- After-tax cash flow
- $85/yr
For passive investors: Depreciation is non-cash, so a rental often shows a tax loss while cash-flowing — sheltering income. Rental losses are passive: they offset passive income freely, and up to $25,000/yr can offset ordinary (W-2) income if you actively participate and your MAGI is under $100k (phasing out to $0 by $150k); unused losses carry forward. On sale, claimed depreciation is recaptured at up to 25%, and gains may owe capital-gains tax (a 1031 exchange can defer both). Figures are a year-1 estimate at your 24.0% rate — not tax advice; consult a CPA.
Schools (NCES district)
- District
- Gilchrist
- NCES district ID
- 1200630
- Math proficiency
- 66% ▼ -4.00%
- Reading proficiency
- 61% ▼ -5.00%
- Median HH income
- $39,610
- Composite
- 53.01/100
- National rank
- #1522
- State rank
- #9 of 73 in FL
Livability — Trenton
- Score
- 77/100
- State rank
- #207
- US rank
- #3078
Category grades
Schools grade is shown separately in the Schools card above.
Census & demographics
- Census place
- Trenton, FL
- Population (ZIP)
- 11,692
Population outlook (Gilchrist County) Hauer SSP2
- Today (2025)
- 17,730 people
- By 2030
- 17,722 · +-0.0%
- By 2040
- 17,393 · -1.9%
- By 2050
- 16,597 · -6.4%
- By 2075
- 14,300 · -19.3%
- By 2100
- 11,498 · -35.1%
Race, ethnicity, and origin ACS 2023
- Neighborhood character
- Predominantly White (82%)
- Race & ethnicity
- White 82% Hispanic / Latino 8% Two or more races 7% Black 5%
- Hispanic origin (detail)
- Mexican 2% Puerto Rican 3%
- Common ancestry
- Lithuanian 4% Slovak 3% Romanian 1%
- Foreign-born
- 4% · Canada
- Languages at home
- 94% English-only · Spanish 5%
Political lean MEDSL · Gilchrist
- 2024 margin
- Solid R (+68.0) · D 15.6% · R 83.6%
- 2008→2024 swing
- -21.2pp toward R · 2008: -46.8pp · 2024: -68.0pp
- All cycles
- 2024: R+68.0 2020: R+64.0 2016: R+62.8 2012: R+51.0 2008: R+46.8
Not yet ingested
- Civics
- —
Market trends
- HPI YoY
- ▲ 46.81%
- Current HPI
- 363.4299
- Rent YoY
- —
- Metro
- —
- State GDP YoY
- ▲ 3.28%
- F500 in state
- 36
Industry mix (Fortune 500 HQ in FL)
| Industry | F500 HQs | Revenue |
|---|---|---|
| Industrial Technology | 2 | $29B |
|
||
| Insurance | 2 | $17B |
|
||
| Retail | 1 | $60B |
|
||
| Technology Distribution | 1 | $58B |
|
||
| Homebuilding | 1 | $35B |
|
||
| Technology Manufacturing | 1 | $35B |
|
||
Price history
+15.4% since first listed9 events — show timeline
- 2026-05-06 Pending — Stellar MLS as Distributed by MLS Grid
- 2026-03-30 Price Changed $225,000 Stellar MLS as Distributed by MLS Grid
- 2026-02-05 Price Changed $230,000 Stellar MLS as Distributed by MLS Grid
- 2025-10-31 Listed $235,000 Stellar MLS as Distributed by MLS Grid
- 2023-06-23 Sold (MLS) $185,000 DGLMLS
- 2023-05-12 Pending — DGLMLS
- 2023-03-30 Relisted — DGLMLS
- 2023-03-14 Pending — DGLMLS
- 2023-01-22 Listed $195,000 DGLMLS
Property tax history
+10.8%/yrLatest (2025): $1,955 · -5.8% YoY. Source: county tax records.
Cash-flow waterfall
monthlySold comps — $/sqft
last 12 mo · ≤1 miLoading sold comps…