59 Courtland Ave · Stamford, CT
Flood risk No data
- FEMA flood zone
- —
- Chance of flooding over 30 yrs
- —
- Est. flood insurance / yr
- —
Fire risk No data
- Est. fire insurance / yr
- —
Heat risk No data
- Hot days now (above threshold)
- —
- Hot days in 30 yrs
- —
Wind risk No data
- Chance of severe wind over 30 yrs
- —
Air-quality risk No data
- Unhealthy air days now
- —
- Unhealthy air days in 30 yrs
- —
Risk factors via First Street. Map © Google.
Why this score? — see what drove the F grade
The composite is a weighted blend of 9 inputs, each scored 0–100. Each bar is that input's sub-score; the figure is the points it added to the 100-point composite (weight × sub-score).
- ARV discount +7.5/15.0
- Cash flow +4.6/30.0
- 1% rule +4.2/10.0
- Schools +3.5/10.0
- Livability +3.5/5.0
- Rent growth +3.0/5.0
- Condition / age +2.5/5.0
- DSCR +0.0/10.0
- Appreciation +0.0/10.0
$285,500
🖨 Deal sheet (PDF) 📄 Offer letter ✓ Due diligence
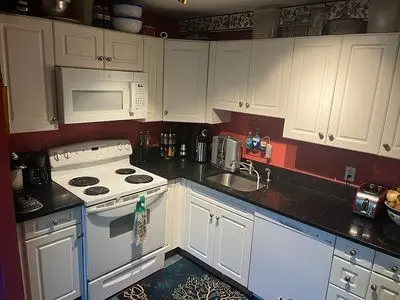
Listing remarks
Completely handicap accessible, solid hardwood doors, ample closets and the & acirc; & euro; & oelig; living is easy! & acirc; & euro; �
Key facts
- Handicap accessible
- Solid hardwood doors
- Ample closets
Tags
Property features AI
Exterior
- Home design: Single-family property built in 1972; Living area approximately 886
- Exterior features: Located in the East Side of Stamford neighborhood
Neighborhood map
What this means for you Summary
Snapshot
- This is a 2-bed/1.0-bath condo listed at $286k.
Deal economics
- At list price, monthly cash flow is $-720 ($-9k/yr) — negative.
- The deal already cash-flows at list — no discount required.
- To meet the 1% rule (rent ≥ 1% of price), the offer needs to be $262k (8.3% below list).
- Recommended offer: $262k (8.3% below list) — sets the bar for 1% rule.
Location & tenants
- Location reads 70/100 on livability (#98 in CT) — a middle-class / working-renter tenant base. Strengths: employment A+, health & safety A+, crime A-; Watch: amenities F, commute F, cost of living F.
- Stamford School District (urban): math 32% / reading 43% proficiency, ranked #103 of 153 in CT (top 67%) — families likely to look elsewhere, expect single-tenant / working-renter base with shorter leases.
- Zoned schools: Julia A. Stark School (math 32% / reading 40%, grade F, #333 of 553 statewide, top 60%, 593 students, 57% FRL); Dolan School (math 22% / reading 41%, grade F, #134 of 175 statewide, top 77%, 611 students, 59% FRL); Stamford High School (math 31% / reading 56%, grade F, #98 of 194 statewide, top 51%, 2,048 students, 53% FRL).
- Market conditions: Rents rising (+1.9%/yr); 190 active listings in the ZIP; 40 comparable units currently listed for rent nearby; rentals at typical pace (median 26d on market — plan ~3-4 weeks tenant-placement turnaround); 40% of comp listings sitting > 30 days — soft ceiling on asking rent; solid renter incomes; 1,151 units permitted in Western Connecticut Planning Region in 2024 (714 in 5+ unit buildings).
- This rent runs 33% of the median local income ($95k/yr) — at the standard rent-burdened threshold; future hikes will face affordability resistance.
Forward outlook
- Local home prices are declining (-3.0%/yr); year-one equity from $2k of loan paydown is wiped out by about $9k of value loss. Plan a longer hold.
Negotiation context
- It's been on market 26 days — a 2% lower offer ($281k) is reasonable based on typical stale-listing flexibility.
Risks & watch-outs
- Watch-outs: HOA is 31% of rent.
Questions for the listing agent
- What do current leases actually rent for vs. the listed asking? Can we see a recent rent roll and the last 12 months of T-12 income?
- Built in 1972 — when were the roof, HVAC, electrical panel, plumbing, and water heater last replaced?
- What does the HOA fee cover, when was the last increase, and are there any pending special assessments or reserve-fund shortfalls?
- Any open or pending special assessments — roof, HVAC, plumbing, elevator, façade? What's the per-unit balance and payoff schedule, and is the seller paying it off at close or rolling it to the buyer?
- Is there a deadline driving the sale (1031 exchange, divorce, estate, relocation)? That informs how much negotiation room exists.
- Schools are B-rated — typically a magnet for longer-tenancy family renters. What's the average tenant stay here, and is there a school-zone premium baked into asking?
- The area grade is low — what's the realistic commute time and amenity access for the typical tenant pool here? Any planned neighborhood developments (good or bad) we should know about?
- What's the average days-on-market for RENTAL listings here right now (not sales)? A rising rental-DOM trend means longer vacancies and softer asking-rent achievability than the comps imply.
- What's the recent tenant-quality profile in this submarket — average credit score on applications, eviction rate, late-payment / NSF rate, and stable-employment percentage? A property-management company in the area should have these aggregated.
- How much new apartment / multifamily construction is in the pipeline within 1–3 miles? Heavy new supply (>2% of stock underway) typically softens rents 12–24 months out; light construction supports rent growth.
Investment metrics
- 1% rule
- 0.92% ✗
- Cap rate
- 3.27%
- Cash-on-cash
- -10.81%
- DSCR
- 0.52
- GRM
- 9.1
CMA / ARV
No comps found within radius.
Projected returns pro-forma
-3.0% appreciation · 1.95% rent growth · sell at horizon
- IRR
- -37.4%
- Equity multiple
- -0.18×
- Total profit
- $-94,332
- Equity at exit
- $42,569
- IRR
- -65.0%
- Equity multiple
- -0.88×
- Total profit
- $-150,012
- Equity at exit
- $24,685
Cash invested: $79,940 (down + closing). Projections, not guarantees.
Landlord ↔ Tenant lean methodology
- Overall (STATE)
- 27 Tenant-Leaning
- State Connecticut
- 27 Tenant-Leaning · D+7
- County
- — inherits STATE
- City
- — inherits STATE
ZIP-level market 06902
- Rents YoY
- 1.9%
- Active inventory
- 190
- Price-to-rent
- 9.1×
Monthly cashflow live
- Estimated rent
- $2,619 high interval (Pro) →
- Mortgage (P&I)
- −$1,497
- Tax est. 1.5%
- −$357 /mo · $4,282/yr
- Insurance
- −$119
- HOA est. from 4 same-building comps
- −$816
- Vacancy / Maint / Mgmt
- −$550
- Net cashflow
- $-720
Break-even live
Sensitivity live
| Price | -10% $-523 | -5% $-622 | +0% $-720 | +5% $-819 | +10% $-918 |
|---|---|---|---|---|---|
| Rent | -10% $-927 | -5% $-824 | +0% $-720 | +5% $-617 | +10% $-513 |
| Rate | -1.0pp $-576 | -0.5pp $-648 | base $-720 | +0.5pp $-794 | +1.0pp $-869 |
UW: 25.0% down · 7.5% · 30yr · 1.5% tax · 5.0% vac · 8.0% maint · 8.0% mgmt
Financing live
Cash to close
- Down payment
- $71,375
- Closing costs
- $8,565
- Reserves months
- —
- Total cash needed
- —
Loan-product check · same deal, 3 products live
Conventional
25% down · 7.5% · 30yr
- Down + closing
- —
- Monthly P&I
- —
- Monthly cashflow
- —
- DSCR
- —
- Eligible?
- —
Personal DTI + credit; lowest rate.
DSCR
20% down · 8.5% · 30yr
- Down + closing
- —
- Monthly P&I
- —
- Monthly cashflow
- —
- DSCR
- —
- Eligible?
- —
No personal income docs; deal must DSCR.
Hard money
10% down · 12.0% · 12mo
- Down + closing
- —
- Monthly P&I
- —
- Monthly cashflow
- —
- DSCR
- —
- Eligible?
- —
Short-term bridge; refi at stabilization.
Rent comps 40 comps
| Address | Beds | Baths | Sqft | Rent | $/sqft | DOM | Units | Dist |
|---|---|---|---|---|---|---|---|---|
| 246 Seaton Rd #2 Stamford, CT | 1.0 | 1.0 | 575 | $1,975 | $3.43 | 46d | 1 | 0.06mi |
| 231 Seaton Rd #2 Stamford, CT | 2.0 | 1.0 | 775 | $2,700 | $3.48 | 16d | 1 | 0.08mi |
| 18 Hamilton Ct Unit B Stamford, CT | 2.0 | 1.0 | 975 | $2,650 | $2.72 | 25d | 1 | 0.13mi |
| 23 Revere Dr #3 Stamford, CT | 2.0 | 1.0 | 775 | $2,700 | $3.48 | 25d | 1 | 0.16mi |
| 28 Hamilton Ct Unit D Stamford, CT | 1.0 | 1.0 | 825 | $2,295 | $2.78 | 25d | 1 | 0.18mi |
| 333 Hamilton Ave Stamford, CT | 1.0–2.0 | 1.0 | 900 | $2,650 | $2.94 | 25d | 3 | 0.18mi |
| 14 Hamilton Ct Unit A Stamford, CT | 2.0 | 1.0 | 975 | $2,595 | $2.66 | 46d | 1 | 0.19mi |
| 6 Revere Dr #3 Stamford, CT | 2.0 | 1.0 | 775 | $2,600 | $3.35 | 25d | 1 | 0.20mi |
| 34 Standish Rd #3 Stamford, CT | 2.0 | 1.0 | 633 | $2,200 | $3.48 | 46d | 1 | 0.23mi |
| 1068 E Main St #3 Stamford, CT | 2.0 | 1.0 | 710 | $2,400 | $3.38 | 46d | 1 | 0.29mi |
| 1046 E Main St #4 Stamford, CT | 2.0 | 1.0 | 763 | $2,800 | $3.67 | 5d | 1 | 0.32mi |
| 44 Blachley Rd Stamford, CT | 2.0 | 1.0 | 975 | $2,595 | $2.66 | 46d | 2 | 0.36mi |
| 250 Glenbrook Rd Unit D Stamford, CT | 2.0 | 1.0 | 1050 | $2,500 | $2.38 | 46d | 1 | 0.56mi |
| 48 Lockwood Ave Unit 3 Stamford, CT | 1.0 | 1.0 | 600 | $1,800 | $3.00 | 16d | 1 | 0.58mi |
| 25 Clovelly Rd Unit 1 Stamford, CT | 2.0 | 1.5 | 1080 | $2,350 | $2.18 | 46d | 1 | 0.62mi |
| 137 Hollow Tree Ridge Rd Darien, CT | 1.0–3.0 | 1.0–2.0 | 1111 | $5,893 | $5.30 | 5d | 10 | 0.66mi |
| 54 Hope St Unit S Stamford, CT | 2.0 | 2.0 | 952 | $2,800 | $2.94 | 25d | 1 | 0.67mi |
| 96 Lockwood Ave Unit 1 Stamford, CT | 2.0 | 1.0 | 700 | $2,200 | $3.14 | 5d | 1 | 0.69mi |
| MORRIS ST STAMFORD, CT | 2.0 | 1.0 | 1000 | $3,100 | $3.10 | 46d | 1 | 0.73mi |
| 389 Courtland Ave Stamford, CT | 1.0 | 1.0 | 620 | $1,720 | $2.77 | 25d | 2 | 0.73mi |
| 106 Lafayette St Unit 3 Stamford, CT | 1.0 | 1.0 | 1000 | $1,550 | $1.55 | 21d | 1 | 0.74mi |
| 101 Maple Tree Ave Stamford, CT | 1.0 | 1.0 | 650 | $1,820 | $2.80 | 25d | 1 | 0.74mi |
| 398 Courtland Ave #11 Stamford, CT | 1.0 | 1.0 | 700 | $2,000 | $2.86 | 5d | 1 | 0.74mi |
| 850 E Main St Stamford, CT | 2.0 | 2.0 | 1080 | $3,038 | $2.81 | 5d | 2 | 0.75mi |
| 850 E Main St #412 Stamford, CT | 2.0 | 2.0 | 1080 | $3,050 | $2.82 | 16d | 1 | 0.75mi |
| 97 Glenbrook Rd Unit t415 Stamford, CT | 2.0 | 2.0 | 1050 | $2,865 | $2.73 | 46d | 1 | 0.75mi |
| 504 Glenbrook Rd Stamford, CT | 1.0 | 1.0 | 798 | $2,700 | $3.38 | 5d | 1 | 0.75mi |
| 34 Faucett St Apt 3 Stamford, CT | 1.0 | 1.0 | 600 | $1,900 | $3.17 | 46d | 1 | 0.76mi |
| 87 Glenbrook Rd Stamford, CT | 1.0–2.0 | 1.0 | 872 | $2,650 | $3.04 | 16d | 2 | 0.77mi |
| 87 Glenbrook Rd Unit 7G Stamford, CT | 2.0 | 1.0 | 910 | $2,650 | $2.91 | 12d | 1 | 0.77mi |
| 77 Glenbrook Rd #202 Stamford, CT | 1.0 | 1.0 | 800 | $2,150 | $2.69 | 46d | 1 | 0.77mi |
| 36 Givens Ave Unit 1 Stamford, CT | 1.0 | 1.0 | 720 | $2,300 | $3.19 | 46d | 1 | 0.77mi |
| 28 Hobbie St Stamford, CT | 2.0 | 1.0 | 844 | $3,200 | $3.79 | 46d | 1 | 0.78mi |
| 28 Hobbie St Stamford, CT | 2.0 | 1.0 | 844 | $2,995 | $3.55 | 16d | 1 | 0.78mi |
| 65 Glenbrook Rd Stamford, CT | 1.0–2.0 | 1.5–2.0 | 1208 | $3,400 | $2.81 | 46d | 2 | 0.78mi |
| 100 Glenbrook Rd Unit T414 Stamford, CT | 1.0 | 1.0 | 628 | $2,269 | $3.61 | 46d | 1 | 0.79mi |
| 100 Glenbrook Rd Unit T411 Stamford, CT | 1.0 | 1.0 | 628 | $2,475 | $3.94 | 5d | 1 | 0.79mi |
| 39 Glenbrook Rd Stamford, CT | 1.0–2.0 | 1.0 | 1002 | $2,600 | $2.59 | 46d | 2 | 0.82mi |
| 39 Glenbrook Rd Stamford, CT | 1.0–2.0 | 1.0 | 967 | $2,600 | $2.69 | 5d | 1 | 0.82mi |
| 15 Rose St Unit 3 Stamford, CT | 1.0 | 1.0 | 644 | $1,900 | $2.95 | 25d | 1 | 0.83mi |
HOA detail condo
- Monthly dues
- $0 · $0/yr
- Assessments
- None detected in remarks — confirm with the listing agent.
Listing history 17 events
-
2026-06-21days on market $285,500 Active 26 DOM
-
2026-06-18days on market $285,500 Active 23 DOM
-
2026-06-17days on market $285,500 Active 22 DOM
-
2026-06-16days on market $285,500 Active 21 DOM
-
2026-06-15days on market $285,500 Active 20 DOM
-
2026-06-13days on market $285,500 Active 18 DOM
-
2026-06-13days on market $285,500 Active 17 DOM
-
2026-06-10days on market $285,500 Active 15 DOM
-
2026-06-09days on market $285,500 Active 14 DOM
-
2026-06-08days on market $285,500 Active 13 DOM
-
2026-06-07days on market $285,500 Active 12 DOM
-
2026-06-05days on market $285,500 Active 9 DOM
-
2026-06-03days on market $285,500 Active 8 DOM
-
2026-06-03days on market $285,500 Active 7 DOM
-
2026-06-01days on market $285,500 Active 6 DOM
-
2026-05-31days on market $285,500 Active 5 DOM
-
2026-05-26$285,500 Active
ⓘ Source: listings_history table (triggers on properties + properties_extension) + one-shot
backfill from property_details.listing_events for pre-trigger history.
Nearby sold comps map
Loading sold comps map…
Walkable amenities ~0.75 mi
Loading nearby amenities…
Taxation est. · year 1
- Rental income
- $31,425
- − Mortgage interest
- −$15,992
- − Property taxes
- −$4,282
- − Insurance
- −$1,428
- − Repairs & maintenance
- −$2,514
- − Management
- −$2,514
- − HOA
- −$9,792
- − Depreciation
- −$8,305
- Taxable loss
- −$13,403
- Est. tax savings @ 24.0%
- +$3,217
- After-tax cash flow
- $-5,426/yr
For passive investors: Depreciation is non-cash, so a rental often shows a tax loss while cash-flowing — sheltering income. Rental losses are passive: they offset passive income freely, and up to $25,000/yr can offset ordinary (W-2) income if you actively participate and your MAGI is under $100k (phasing out to $0 by $150k); unused losses carry forward. On sale, claimed depreciation is recaptured at up to 25%, and gains may owe capital-gains tax (a 1031 exchange can defer both). Figures are a year-1 estimate at your 24.0% rate — not tax advice; consult a CPA.
Schools (NCES district)
- District
- Stamford School District
- NCES district ID
- 0904320
- Math proficiency
- 32% ▼ -10.00%
- Reading proficiency
- 43% ▼ -7.00%
- Median HH income
- $78,843
- Composite
- 35.14/100
- National rank
- #5010
- State rank
- #103 of 153 in CT
Livability — Stamford
- Score
- 70/100
- State rank
- #98
- US rank
- #7716
Category grades
Schools grade is shown separately in the Schools card above.
Census & demographics
- Census place
- Stamford, CT
- County
- Fairfield County · 765,532 people
- City population
- 123,058
- Metro
- Bridgeport-Stamford-Norwalk, CT
- Population (ZIP)
- 73,392
- Household income
- $94,843
- Rent vs Own
- Severe rent burden
- 4139.0
Population outlook (Western Connecticut County) Hauer SSP2
- By 2040
- 685,031
Race, ethnicity, and origin ACS 2023
- Neighborhood character
- Highly diverse neighborhood (Simpson 0.71)
- Race & ethnicity
- Hispanic / Latino 35% White 32% Black 23% Two or more races 13% Asian 7%
- Hispanic origin (detail)
- Mexican 3% Puerto Rican 4% Dominican 3%
- Common ancestry
- Hispanic 5% Romanian 3% Scotch-Irish 1%
- Foreign-born
- 36% · Canada, Jamaica, China
- Languages at home
- 51% English-only · Spanish 30% French/Haitian/Cajun 6% Other Indo-European 4%
Political lean MEDSL · Western Connecticut
- 2024 margin
- D (+19.1) · D 58.8% · R 39.7% · Other 1.6%
- All cycles
- 2024: D+19.1
Not yet ingested
- Civics
- —
Market trends
- HPI YoY
- ▼ -450.67%
- Current HPI
- 173.4108
- Rent YoY
- ▲ 1.95%
- Metro
- Bridgeport-Stamford-Norwalk, CT
- State GDP YoY
- ▲ 1.06%
- F500 in state
- 38
Industry mix (Fortune 500 HQ in CT)
| Industry | F500 HQs | Revenue |
|---|---|---|
| Industrial Machinery | 4 | $38B |
|
||
| Insurance | 3 | $71B |
|
||
| Financial Services | 2 | $25B |
|
||
| Transportation / Logistics | 2 | $18B |
|
||
| Healthcare | 1 | $247B |
|
||
| Telecommunications | 1 | $55B |
|
||
Price history
1 event — show timeline
- 2026-05-26 Listed $285,500 FSBO.com
Cash-flow waterfall
monthlySold comps — $/sqft
last 12 mo · ≤1 miLoading sold comps…