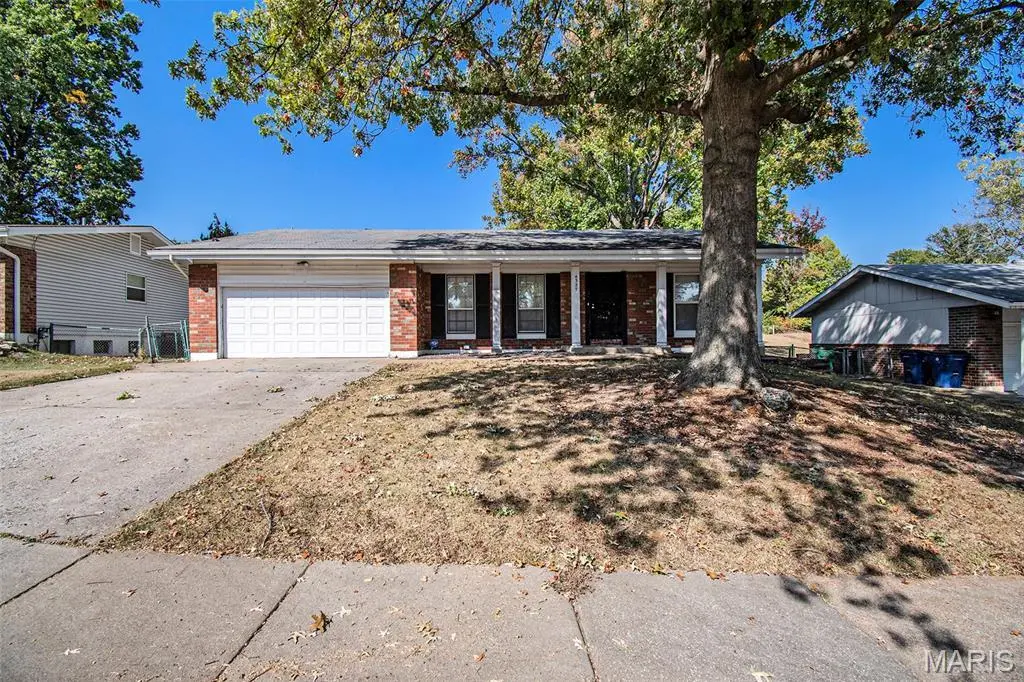
4327 Sulla Dr · Florissant, MO
Flood risk 1/10 · Minimal
- FEMA flood zone
- X (unshaded)
- Chance of flooding over 30 yrs
- 0.0%
- Est. flood insurance / yr
- $473 – $860
Fire risk 1/10 · Minimal
- Est. fire insurance / yr
- $1,054 – $1,958
Heat risk 5/10 · Moderate
- Hot days now (above 106°F)
- 7 days/yr
- Hot days in 30 yrs
- 21 days/yr
Wind risk 2/10 · Minimal
- Chance of severe wind over 30 yrs
- 1.0%
Air-quality risk 3/10 · Minor
- Unhealthy air days now
- 3 days/yr
- Unhealthy air days in 30 yrs
- 5 days/yr
Risk factors via First Street. Map © Google.
Why this score? — see what drove the B grade
The composite is a weighted blend of 9 inputs, each scored 0–100. Each bar is that input's sub-score; the figure is the points it added to the 100-point composite (weight × sub-score).
- Cash flow +21.6/30.0
- ARV discount +15.0/15.0
- Appreciation +10.0/10.0
- DSCR +6.9/10.0
- 1% rule +5.6/10.0
- Rent growth +4.4/5.0
- Livability +3.7/5.0
- Condition / age +2.5/5.0
- Schools +1.7/10.0
$170,000
🖨 Deal sheet 📄 Offer letter ✓ Due diligence
Listing remarks MLS
Welcome to this inviting 3-bedroom, 2-bathroom home with a 2-car garage, located in Seven Hills. This home features a traditional layout, with the living room flowing seamlessly into the dining room and then into the kitchen. The kitchen offers abundant cabinet space and matching black appliances. All three bedrooms are situated on the same wing of the house for convenience. A large unfinished basement provides tremendous potential, perfect for storage now and offering the opportunity to be finished out later as a secondary living area or game room. Schedule your showing today!
Key facts
- 9,313 sq ft lot
- 2 garage spots
- Built 1965
Tags
Neighborhood map
What this means for you Summary
Snapshot
- This is a 4-bed/2.0-bath single-family listed at $170k.
Deal economics
- At list price, monthly cash flow is $257 ($3k/yr) — positive.
- The deal already cash-flows at list — no discount required.
- Meets the 1% rule at list price ($2k rent vs $170k).
- Recommended offer: $150k (12.0% below list) — sets the bar for market timing.
- Cap rate 8.1% vs local median 6.3% in Florissant — meaningfully above typical; check what's discounted (condition, days-on-market, listing class) to confirm the premium yield is real.
Location & tenants
- Location reads 73/100 on livability (#82 in MO) — a middle-class / working-renter tenant base. Strengths: cost of living A+, housing A+, health & safety B+; Watch: crime C-, amenities D+, schools D.
- Hazelwood (suburban): math 11% / reading 26% proficiency, ranked #306 of 324 in MO (top 94%) — low school quality limits family demand, transient renter base, plan for 1-2y turnover.
- Market conditions: Rents rising fast (+7.5%/yr); 218 active listings in the ZIP; 17 comparable units currently listed for rent nearby; rentals at typical pace (median 24d on market — plan ~3-4 weeks tenant-placement turnaround); 920 units permitted in St. Louis County in 2024 (250 in 5+ unit buildings).
- This rent runs 32% of the median local income ($67k/yr) — at the standard rent-burdened threshold; future hikes will face affordability resistance.
Forward outlook
- In year one you build about $18k of equity ($1k loan paydown + $17k appreciation (10.0% local appreciation)).
- At projected returns (10.0% appreciation + 7.5% rent growth), your $48k cash investment doubles in ~3 years — after that, you're playing with house money.
- By year 3, paydown + projected appreciation supports a ~$46k cash-out refi (75% LTV) — recoverable capital for the next deal without selling this one.
Negotiation context
- It's been on market 233 days — a 12% lower offer ($150k) is reasonable based on typical stale-listing flexibility.
Risks & watch-outs
- Climate carrying-cost: extreme-heat days projected 7→21/yr by 2055 (HVAC capex compounding) — expect insurance premiums to compound above CPI over the hold.
Questions for the listing agent
- It's been on market 233 days. Have you received any prior offers? Is the seller open to a 12% concession, seller financing, or rate buy-down credit?
- Built in 1965 — when were the roof, HVAC, electrical panel, plumbing, and water heater last replaced?
- Why hasn't it sold? Are there any deal-killer items the seller is aware of (foundation, flood, title, zoning, code violations)?
- Is there a deadline driving the sale (1031 exchange, divorce, estate, relocation)? That informs how much negotiation room exists.
- Schools are D-rated, which usually means shorter tenancies and higher turnover. Who's the typical renter profile here, and what's been the actual vacancy rate?
- What's the average days-on-market for RENTAL listings here right now (not sales)? A rising rental-DOM trend means longer vacancies and softer asking-rent achievability than the comps imply.
- What's the recent tenant-quality profile in this submarket — average credit score on applications, eviction rate, late-payment / NSF rate, and stable-employment percentage? A property-management company in the area should have these aggregated.
- How much new for-sale + rental construction is in the pipeline within 1–3 miles? Heavy new supply typically softens prices + rents 12–24 months out; constrained supply supports both.
Investment metrics
- 1% rule
- 1.06% ✓
- Cap rate
- 8.11%
- Cash-on-cash
- 6.47%
- DSCR
- 1.29
- GRM
- 7.8
CMA / ARV
- ARV (median comp)
- $207,545
- List price
- $170,000
- Delta
- -18.09%
- Verdict
- UNDERPRICED
- Comps
- 20 within 1.0 mi
Show comp detail 12 sales within ~0.75 mi
| Address | Dist | Beds/Ba | Sqft | Sold | Price | $/sf | Match |
|---|---|---|---|---|---|---|---|
| 4333 Caracalla Dr | 0.07mi | 3/2.5 (-1) | 1,271 (-1%) | 3mo | $225,000 | $177 | 86 |
| 4394 Satiris Dr | 0.16mi | 3/2.0 (-1) | 1,301 (+2%) | 0mo | $235,000 | $181 | 84 |
| 4428 Papal Dr | 0.17mi | 3/2.0 (-1) | 1,318 (+3%) | 6mo | $129,900 | $99 | 78 |
| 4443 Remus Dr | 0.20mi | 4/2.5 | 1,354 (+6%) | 3mo | $224,900 | $166 | 76 |
| 11678 Galba Dr | 0.41mi | 3/2.0 (-1) | 1,292 (+1%) | 2mo | $129,900 | $101 | 73 |
| 4384 Remus Dr | 0.15mi | 3/2.0 (-1) | 1,128 (-12%) | 2mo | $209,900 | $186 | 67 |
| 4451 Rhine Dr | 0.22mi | 3/2.0 (-1) | 1,421 (+11%) | 0mo | $165,000 | $116 | 66 |
| 11962 Nero Dr | 0.19mi | 3/2.0 (-1) | 1,440 (+12%) | 1mo | $220,000 | $153 | 65 |
| 4377 Varano Dr | 0.29mi | 3/2.0 (-1) | 1,155 (-10%) | 2mo | $150,000 | $130 | 64 |
| 4950 Patricia Ridge Dr | 0.52mi | 3/1.5 (-1) | 1,124 (-12%) | 4mo | $177,500 | $158 | 45 |
| 11879 Galba Dr | 0.53mi | 3/1.5 (-1) | 1,092 (-15%) | 0mo | $159,900 | $146 | 43 |
| 12415 Danube Dr | 0.62mi | 3/2.0 (-1) | 1,124 (-12%) | 6mo | $150,000 | $133 | 41 |
Match score weights: distance 35% · size 25% · config 20% · recency 20%. Top-matched comps best support the ARV.
Projected returns pro-forma
10.0% appreciation · 7.51% rent growth · sell at horizon
- IRR
- 30.8%
- Equity multiple
- 3.47×
- Total profit
- $117,532
- Equity at exit
- $153,149
- IRR
- 28.2%
- Equity multiple
- 8.44×
- Total profit
- $354,133
- Equity at exit
- $330,273
Cash invested: $47,600 (down + closing). Projections, not guarantees.
Landlord ↔ Tenant lean methodology
- Overall (STATE)
- 81 Strongly Landlord-Friendly
- State Missouri
- 81 Strongly Landlord-Friendly · R+10
- County
- — inherits STATE
- City
- — inherits STATE
ZIP-level market 63033
- Home prices YoY
- 2.5%
- Rents YoY
- 7.5%
- Active inventory
- 218
- Price-to-rent
- 7.8×
Monthly cashflow live
- Estimated rent
- $1,807 high interval (Pro) →
- Mortgage (P&I)
- −$891
- Tax from tax record
- −$208 /mo · $2,498/yr
- Insurance
- −$71
- HOA
- −$0
- Vacancy / Maint / Mgmt
- −$379
- Net cashflow
- $257
Break-even live
UW: 25.0% down · 7.5% · 30yr · 1.5% tax · 5.0% vac · 8.0% maint · 8.0% mgmt
Financing live
Cash to close
- Down payment
- $42,500
- Closing costs
- $5,100
- Reserves months
- —
- Total cash needed
- —
Loan-product check · same deal, 3 products live
Conventional
25% down · 7.5% · 30yr
- Down + closing
- —
- Monthly P&I
- —
- Monthly cashflow
- —
- DSCR
- —
- Eligible?
- —
Personal DTI + credit; lowest rate.
DSCR
20% down · 8.5% · 30yr
- Down + closing
- —
- Monthly P&I
- —
- Monthly cashflow
- —
- DSCR
- —
- Eligible?
- —
No personal income docs; deal must DSCR.
Hard money
10% down · 12.0% · 12mo
- Down + closing
- —
- Monthly P&I
- —
- Monthly cashflow
- —
- DSCR
- —
- Eligible?
- —
Short-term bridge; refi at stabilization.
Rent comps 17 comps
| Address | Beds | Baths | Sqft | Rent | $/sqft | DOM | Units | Dist |
|---|---|---|---|---|---|---|---|---|
| 11635 Hazeloak Dr Black Jack, MO | 3.0 | 2.0 | 1124 | $1,728 | $1.54 | 17d | 1 | 0.52mi |
| 4872 Bristol Rock Rd Black Jack, MO | 4.0 | 2.0 | 1448 | $2,061 | $1.42 | 2d | 1 | 0.59mi |
| 4583 Whisper Lake Dr Black Jack, MO | 1.0–5.0 | 1.0–2.5 | 1225 | $1,354 | $1.10 | 1d | 17 | 0.84mi |
| 2544 Netherton Dr Saint Louis, MO | 3.0 | 2.0 | 1288 | $1,945 | $1.51 | 1d | 1 | 1.01mi |
| 1670 Arundel Dr Florissant, MO | 3.0 | 2.0 | 1012 | $1,450 | $1.43 | 23d | 1 | 1.10mi |
| 1536 Springlet Ct #31 Florissant, MO | 3.0 | 2.5 | 1161 | $1,450 | $1.25 | 7d | 1 | 1.15mi |
| 2257 Luxmore Dr Saint Louis, MO | 3.0 | 3.0 | 1073 | $1,495 | $1.39 | 23d | 1 | 1.21mi |
| 2259 Ainsworth Dr Saint Louis, MO | 4.0 | 2.0 | 1561 | $2,100 | $1.35 | 1d | 1 | 1.36mi |
| 2259 Ainsworth Dr Saint Louis, MO | 4.0 | 2.0 | 1500 | $1,776 | $1.18 | 43d | 1 | 1.36mi |
| 3585 Pershall Rd Unit Moor Ferguson, MO | 3.0 | 2.0 | 1577 | $1,500 | $0.95 | 43d | 1 | 1.37mi |
| 10329 Chesley Dr Saint Louis, MO | 3.0 | 1.0 | 1014 | $1,350 | $1.33 | 23d | 1 | 1.40mi |
| 1095 Ozment Dr Florissant, MO | 3.0 | 2.0 | 984 | $1,461 | $1.48 | 23d | 1 | 1.42mi |
| 1547 Babcock Dr Saint Louis, MO | 3.0 | 1.0 | 1014 | $1,480 | $1.46 | 43d | 1 | 1.48mi |
| 1050 Ozment Dr Florissant, MO | 3.0 | 2.0 | 984 | $1,525 | $1.55 | 43d | 1 | 1.48mi |
| 62 Capitol Hill Dr Saint Louis, MO | 3.0 | 2.0 | 1239 | $1,250 | $1.01 | 43d | 1 | 1.48mi |
| 10304 Bon Oak Dr Saint Louis, MO | 3.0 | 1.5 | 1500 | $1,250 | $0.83 | 43d | 1 | 1.49mi |
| 1915 Green Valley Dr Saint Louis, MO | 4.0 | 2.0 | 1740 | $1,500 | $0.86 | 4d | 1 | 1.50mi |
Listing history 27 events
-
2026-06-18days on market $170,000 Active 233 DOM
-
2026-06-17days on market $170,000 Active 232 DOM
-
2026-06-16days on market $170,000 Active 231 DOM
-
2026-06-15price $170,000 Active 230 DOM
-
2026-06-15days on market $173,000 Active 230 DOM
-
2026-06-13days on market $173,000 Active 228 DOM
-
2026-06-13days on market $173,000 Active 227 DOM
-
2026-06-09days on market $173,000 Active 224 DOM
-
2026-06-08days on market $173,000 Active 223 DOM
-
2026-06-07days on market $173,000 Active 222 DOM
-
2026-06-05days on market $173,000 Active 219 DOM
-
2026-06-03days on market $173,000 Active 218 DOM
-
2026-06-02days on market $173,000 Active 217 DOM
-
2026-06-01days on market $173,000 Active 216 DOM
-
2026-05-31days on market $173,000 Active 215 DOM
-
2026-05-15price $173,000 587-char remark
Show marketing remark (587 chars)
Welcome to this inviting 3-bedroom, 2-bathroom home with a 2-car garage, located in Seven Hills. This home features a traditional layout, with the living room flowing seamlessly into the dining room and then into the kitchen. The kitchen offers abundant cabinet space and matching black appliances. All three bedrooms are situated on the same wing of the house for convenience. A large unfinished basement provides tremendous potential, perfect for storage now and offering the opportunity to be finished out later as a secondary living area or game room. Schedule your showing today!
-
2026-04-17price $180,000 587-char remark
Show marketing remark (587 chars)
Welcome to this inviting 3-bedroom, 2-bathroom home with a 2-car garage, located in Seven Hills. This home features a traditional layout, with the living room flowing seamlessly into the dining room and then into the kitchen. The kitchen offers abundant cabinet space and matching black appliances. All three bedrooms are situated on the same wing of the house for convenience. A large unfinished basement provides tremendous potential, perfect for storage now and offering the opportunity to be finished out later as a secondary living area or game room. Schedule your showing today!
-
2026-02-27price $184,000 587-char remark
Show marketing remark (587 chars)
Welcome to this inviting 3-bedroom, 2-bathroom home with a 2-car garage, located in Seven Hills. This home features a traditional layout, with the living room flowing seamlessly into the dining room and then into the kitchen. The kitchen offers abundant cabinet space and matching black appliances. All three bedrooms are situated on the same wing of the house for convenience. A large unfinished basement provides tremendous potential, perfect for storage now and offering the opportunity to be finished out later as a secondary living area or game room. Schedule your showing today!
-
2026-02-06price $188,000 587-char remark
Show marketing remark (587 chars)
Welcome to this inviting 3-bedroom, 2-bathroom home with a 2-car garage, located in Seven Hills. This home features a traditional layout, with the living room flowing seamlessly into the dining room and then into the kitchen. The kitchen offers abundant cabinet space and matching black appliances. All three bedrooms are situated on the same wing of the house for convenience. A large unfinished basement provides tremendous potential, perfect for storage now and offering the opportunity to be finished out later as a secondary living area or game room. Schedule your showing today!
-
2026-01-16price $194,000 587-char remark
Show marketing remark (587 chars)
Welcome to this inviting 3-bedroom, 2-bathroom home with a 2-car garage, located in Seven Hills. This home features a traditional layout, with the living room flowing seamlessly into the dining room and then into the kitchen. The kitchen offers abundant cabinet space and matching black appliances. All three bedrooms are situated on the same wing of the house for convenience. A large unfinished basement provides tremendous potential, perfect for storage now and offering the opportunity to be finished out later as a secondary living area or game room. Schedule your showing today!
-
2025-10-28$200,000 Active 587-char remark
Show marketing remark (587 chars)
Welcome to this inviting 3-bedroom, 2-bathroom home with a 2-car garage, located in Seven Hills. This home features a traditional layout, with the living room flowing seamlessly into the dining room and then into the kitchen. The kitchen offers abundant cabinet space and matching black appliances. All three bedrooms are situated on the same wing of the house for convenience. A large unfinished basement provides tremendous potential, perfect for storage now and offering the opportunity to be finished out later as a secondary living area or game room. Schedule your showing today!
-
2023-06-21historical
-
2015-09-01soldstatus $19,500,437
-
2013-06-10soldstatus $499,000
-
2012-12-12soldstatus $25,000
-
2012-12-12soldstatus $34,000
-
1990-08-01soldstatus
ⓘ Source: listings_history table (triggers on properties + properties_extension) + one-shot
backfill from property_details.listing_events for pre-trigger history.
Tax reassessment forecast MO · Resets to sale price
- Current annual tax
- $2,498 · $208/mo
- Projected year-2 tax
- $2,498 · $208/mo
- Expected delta
- $0/yr ($0/mo · 0.0%)
ⓘ Screening estimate from a state-policy table — verify with the county assessor before closing.
Climate risk First Street
- Flood 1/10 Low FEMA zone X (unshaded) · 0% chance over 30 yrs
- Wildfire 1/10 Low
- Heat 5/10 Major 7 d/yr ≥106°F today · 21 d/yr by 30 yrs out
- Wind 2/10 Low 100% chance of damaging wind over 30 yrs
- Air quality 3/10 Moderate 3 unhealthy d/yr today · 5 by 30 yrs out
Nearby sold comps map
Loading sold comps map…
Walkable amenities ~0.75 mi
Loading nearby amenities…
Taxation est. · year 1
- Rental income
- $21,679
- − Mortgage interest
- −$9,523
- − Property taxes
- −$2,498
- − Insurance
- −$850
- − Repairs & maintenance
- −$1,734
- − Management
- −$1,734
- − Depreciation
- −$4,945
- Taxable income
- $394
- Est. tax owed @ 24.0%
- −$95
- After-tax cash flow
- $2,986/yr
For passive investors: Depreciation is non-cash, so a rental often shows a tax loss while cash-flowing — sheltering income. Rental losses are passive: they offset passive income freely, and up to $25,000/yr can offset ordinary (W-2) income if you actively participate and your MAGI is under $100k (phasing out to $0 by $150k); unused losses carry forward. On sale, claimed depreciation is recaptured at up to 25%, and gains may owe capital-gains tax (a 1031 exchange can defer both). Figures are a year-1 estimate at your 24.0% rate — not tax advice; consult a CPA.
Schools (NCES district)
- District
- Hazelwood
- NCES district ID
- 2913830
- Math proficiency
- 11% ▼ -13.00%
- Reading proficiency
- 26% ▼ -6.00%
- Median HH income
- $51,621
- Composite
- 16.77/100
- National rank
- #9156
- State rank
- #306 of 324 in MO
Livability — Florissant
- Score
- 73/100
- State rank
- #82
- US rank
- #5406
Category grades
Schools grade is shown separately in the Schools card above.
Census & demographics
- County
- Saint Louis County · 888,823 people
- City population
- 42,258
- Metro
- St. Louis, MO-IL
- Population (ZIP)
- 43,056
- Household income
- $66,776
- Rent vs Own
- Severe rent burden
- 1429.0
Population outlook (St. Louis County) Hauer SSP2
- Today (2025)
- 1,025,227 people
- By 2030
- 1,028,023 · +0.3%
- By 2040
- 1,020,940 · -0.4%
- By 2050
- 1,007,280 · -1.8%
- By 2075
- 987,277 · -3.7%
- By 2100
- 921,984 · -10.1%
Race, ethnicity, and origin ACS 2023
- Neighborhood character
- Predominantly Black (71%)
- Race & ethnicity
- Black 71% White 23% Two or more races 4% Hispanic / Latino 1%
- Common ancestry
- Romanian 1% Lithuanian 1% Italian 1%
- Foreign-born
- 3% · Canada, Vietnam
- Languages at home
- 95% English-only · Spanish 1% French/Haitian/Cajun 1%
Political lean MEDSL · St. Louis
- 2024 margin
- Strong D (+23.4) · D 60.8% · R 37.4% · Other 1.7%
- 2008→2024 swing
- +3.5pp toward D · 2008: 19.9pp · 2024: 23.4pp
- All cycles
- 2024: D+23.4 2020: D+24.0 2016: D+16.2 2012: D+13.7 2008: D+19.9
Not yet ingested
- Civics
- —
Market trends
- HPI YoY
- ▲ 13.78%
- Current HPI
- 570.6
- Rent YoY
- ▲ 7.51%
- Metro
- St. Louis, MO-IL
- State GDP YoY
- ▲ 1.84%
- F500 in state
- 20
Industry mix (Fortune 500 HQ in MO)
| Industry | F500 HQs | Revenue |
|---|---|---|
| Healthcare | 1 | $163B |
|
||
| Insurance | 1 | $21B |
|
||
| Industrial Technology | 1 | $17B |
|
||
| Retail | 1 | $16B |
|
||
| Industrial Distribution | 1 | $10B |
|
||
| Utilities | 1 | $9B |
|
||
Price history
+592.0% since first listed12 events — show timeline
- 2026-05-15 Price Changed $173,000 MARIS as Distributed by MLS Grid
- 2026-04-17 Price Changed $180,000 MARIS as Distributed by MLS Grid
- 2026-02-27 Price Changed $184,000 MARIS as Distributed by MLS Grid
- 2026-02-06 Price Changed $188,000 MARIS as Distributed by MLS Grid
- 2026-01-16 Price Changed $194,000 MARIS as Distributed by MLS Grid
- 2025-10-28 Listed $200,000 MARIS as Distributed by MLS Grid
- 2023-06-21 Rental Removed — RENT.
- 2015-09-01 Sold (Public Records) $19,500,437 Public Records
- 2013-06-10 Sold (Public Records) $499,000 Public Records
- 2012-12-12 Sold (Public Records) $34,000 Public Records
- 2012-12-12 Sold (Public Records) $25,000 Public Records
- 1990-08-01 Sold (Public Records) — Public Records
Property tax history
+5.9%/yrLatest (2022): $2,498 · +5.6% YoY. Source: county tax records.
Cash-flow waterfall
monthlySold comps — $/sqft
last 12 mo · ≤1 miLoading sold comps…