5729 Lia Dr · Milton, FL
Flood risk 1/10 · Minimal
- FEMA flood zone
- X (unshaded)
- Chance of flooding over 30 yrs
- 0.0%
- Est. flood insurance / yr
- $507 – $1,088
Fire risk 3/10 · Minor
- Est. fire insurance / yr
- $947 – $1,759
Heat risk 10/10 · Severe
- Hot days now (above 105°F)
- 7 days/yr
- Hot days in 30 yrs
- 22 days/yr
Wind risk 9/10 · Severe
- Chance of severe wind over 30 yrs
- 99.0%
Air-quality risk 1/10 · Minimal
- Unhealthy air days now
- 0 days/yr
- Unhealthy air days in 30 yrs
- 0 days/yr
Risk factors via First Street. Map © Google.
Why this score? — see what drove the D grade
The composite is a weighted blend of 9 inputs, each scored 0–100. Each bar is that input's sub-score; the figure is the points it added to the 100-point composite (weight × sub-score).
- Cash flow +13.6/30.0
- ARV discount +7.2/15.0
- Schools +5.3/10.0
- DSCR +4.1/10.0
- Livability +3.9/5.0
- Rent growth +3.2/5.0
- 1% rule +2.8/10.0
- Condition / age +2.5/5.0
- Appreciation +0.0/10.0
$259,000
🖨 Deal sheet (PDF) 📄 Offer letter ✓ Due diligence
Listing remarks MLS
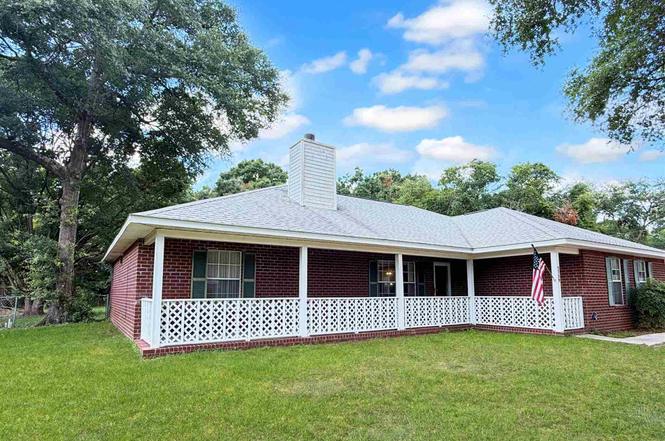
|| Single story Brick home, Split Bedroom plan sitting in a well established neighborhood on a large flat property || Ideal for the person looking for the spaciousness this property has || Side entry garage and easy access to the backyard from the driveway || If outdoor living is important to you then you will enjoy the large screened-in Patio and an over sized front porch || Open floor plan gives you and your company an easy flow for conversations || Zero Carpet - No carpet - || Hardwood flooring in the dining and living area, wood laminate flooring in the bedrooms ||
Key facts
- Brick residence
- Huge screened porch
- Large fenced yard
Tags
Property features AI
Finance
- Other: County-maintained road; Directions provided to property
- HOA & community: No homeowners association
Exterior
- Parking: Attached 2-car garage; 2 covered parking spaces (total 2 spaces)
- Utilities: Public water; Septic tank sewer; Circuit breaker electrical; Cable available; Insulation and ridge vent (energy-efficiency features)
- Home design: Single-story home; Resale property; Not attached to other properties; Homestead exemption indicated; Shingle (composition) roof
- Construction: Brick and frame construction; Slab foundation
- Exterior features: Screened patio/porch; Back yard chain-link fence; Paved road access; Interior lot with central access
Interior
- Kitchen: Laminate countertops; Dishwasher; Electric water heater
- Bedrooms: Master bedroom on the first floor, approximately 15 x 13; Bedroom on the first floor, approximately 11 x 11.8; Second bedroom on the first floor, approximately 10.5 x 11.8
- Flooring: Hardwood flooring; Laminate flooring
- Bathrooms: 2 full bathrooms
- Heating & cooling: Central heating; Fireplace(s); Central air; Ceiling fans for cooling
- Interior features: Baseboards; Cathedral ceilings; Ceiling fans; Double pane windows; Blinds
- Laundry & utility: Laundry inside with washer/dryer hookups
Neighborhood map
What this means for you Summary
Snapshot
- This is a 3-bed/2.0-bath single-family listed at $259k.
Deal economics
- At list price, monthly cash flow is $15 ($178/yr) — positive.
- The deal already cash-flows at list — no discount required.
- To meet the 1% rule (rent ≥ 1% of price), the offer needs to be $202k (22.2% below list).
- Recommended offer: $202k (22.2% below list) — sets the bar for 1% rule.
- Cap rate 6.4% vs local median 4.6% in Milton — top-decile yield for the area; either an underpriced asset or a hidden risk that comps aren't pricing in. Stress-test before assuming the spread holds.
Location & tenants
- Location reads 78/100 on livability (#166 in FL, #2,480 nationally) — a middle-class / working-renter tenant base. Strengths: cost of living A+, housing A+, health & safety A+; Watch: amenities D-, commute F.
- Santa Rosa (suburban): math 63% / reading 60% proficiency, ranked #8 of 73 in FL (top 11%) — acceptable for families but not a draw, mixed tenant base, ~2y average lease.
- Zoned schools: Berryhill Elementary School (math 71% / reading 62%, grade B+, #473 of 2,144 statewide, top 23%, 923 students, 51% FRL); Hobbs Middle School (math 52% / reading 48%, grade C, #254 of 571 statewide, top 45%, 700 students, 63% FRL); Milton High School (math 44% / reading 42%, grade F, #255 of 667 statewide, top 39%, 2,085 students, 54% FRL) — zoned schools average 56% FRL vs 36% district-wide (20 pts higher); higher-poverty schools than district average — tighter screening recommended.
- Market conditions: Rents rising (+2.7%/yr); 360 active listings in the ZIP; 6 comparable units currently listed for rent nearby; rentals at typical pace (median 26d on market — plan ~3-4 weeks tenant-placement turnaround); solid renter incomes; 1,983 units permitted in Santa Rosa County in 2024 (128 in 5+ unit buildings).
- This rent runs 31% of the median local income ($77k/yr) — at the standard rent-burdened threshold; future hikes will face affordability resistance.
Forward outlook
- Local home prices are declining (-3.0%/yr); year-one equity from $2k of loan paydown is wiped out by about $8k of value loss. Plan a longer hold.
- Santa Rosa County population projected at +31% by 2050 — long-run rental-demand tailwind backs the buy-and-hold thesis.
Negotiation context
- Only 4 days on market — expect competitive offers; lowballing is unlikely to land.
- 3 sale attempts since 17y ago with the ask held roughly flat each time — persistent listings suggest the price (not the market) is what's stuck; bring a comps-based counter.
- Current owner paid $153k; list at $259k implies a 69% gain — meaningful room to come down on a strong offer.
Risks & watch-outs
- Climate carrying-cost: severe wind risk, 99% chance of damaging wind over 30y; extreme-heat days projected 7→22/yr by 2055 (HVAC capex compounding) — expect insurance premiums to compound above CPI over the hold.
Questions for the listing agent
- Is there a deadline driving the sale (1031 exchange, divorce, estate, relocation)? That informs how much negotiation room exists.
- Schools are B-rated — typically a magnet for longer-tenancy family renters. What's the average tenant stay here, and is there a school-zone premium baked into asking?
- The area grade is low — what's the realistic commute time and amenity access for the typical tenant pool here? Any planned neighborhood developments (good or bad) we should know about?
- What's the average days-on-market for RENTAL listings here right now (not sales)? A rising rental-DOM trend means longer vacancies and softer asking-rent achievability than the comps imply.
- What's the recent tenant-quality profile in this submarket — average credit score on applications, eviction rate, late-payment / NSF rate, and stable-employment percentage? A property-management company in the area should have these aggregated.
- How much new for-sale + rental construction is in the pipeline within 1–3 miles? Heavy new supply typically softens prices + rents 12–24 months out; constrained supply supports both.
Investment metrics
- 1% rule
- 0.78% ✗
- Cap rate
- 6.36%
- Cash-on-cash
- 0.25%
- DSCR
- 1.01
- GRM
- 10.7
CMA / ARV
- ARV (on-the-fly)
- $257,526
- Comps found
- 12
Show comp detail 12 sales within ~0.75 mi
| Address | Dist | Beds/Ba | Sqft | Sold | Price | $/sf | Match |
|---|---|---|---|---|---|---|---|
| 5905 Castle Dr | 0.26mi | 3/2.0 | 1,492 (-1%) | 6mo | $255,000 | $171 | 82 |
| 6008 Kingswood Dr | 0.47mi | 3/2.0 | 1,508 (+0%) | 5mo | $225,000 | $149 | 74 |
| 5898 Cedar Tree Dr | 0.49mi | 3/2.0 | 1,560 (+4%) | 1mo | $265,000 | $170 | 70 |
| 5905 Pamela Dr | 0.41mi | 3/2.0 | 1,619 (+8%) | 1mo | $245,000 | $151 | 68 |
| 5773 Hermitage Cir | 0.18mi | 3/2.0 | 1,718 (+14%) | 3mo | $250,000 | $146 | 66 |
| 6136 Arnies Way | 0.41mi | 3/2.0 | 1,673 (+11%) | 2mo | $285,000 | $170 | 61 |
| 5633 Lia Dr | 0.18mi | 3/2.0 | 1,728 (+15%) | 8mo | $295,000 | $171 | 60 |
| 5899 Cedar Tree Dr | 0.49mi | 3/2.0 | 1,425 (-5%) | 13mo | $290,000 | $204 | 57 |
| 5763 Melrose Dr | 0.63mi | 3/2.0 | 1,630 (+8%) | 2mo | $295,000 | $181 | 56 |
| 6028 Players Pl | 0.36mi | 4/2.0 (+1) | 1,730 (+15%) | 1mo | $365,000 | $211 | 53 |
| 5783 Sunview Dr | 0.66mi | 3/2.0 | 1,600 (+6%) | 10mo | $275,000 | $172 | 51 |
| 5837 Northrop Rd | 0.37mi | 3/2.0 | 1,301 (-14%) | 13mo | $307,000 | $236 | 49 |
Match score weights: distance 35% · size 25% · config 20% · recency 20%. Top-matched comps best support the ARV.
Projected returns pro-forma
-3.0% appreciation · 2.7% rent growth · sell at horizon
- IRR
- -16.3%
- Equity multiple
- 0.42×
- Total profit
- $-41,730
- Equity at exit
- $38,618
- IRR
- -8.5%
- Equity multiple
- 0.48×
- Total profit
- $-38,001
- Equity at exit
- $22,394
Cash invested: $72,520 (down + closing). Projections, not guarantees.
Landlord ↔ Tenant lean methodology
- Overall (STATE)
- 87 Strongly Landlord-Friendly
- State Florida
- 87 Strongly Landlord-Friendly · R+3
- County
- — inherits STATE
- City
- — inherits STATE
ZIP-level market 32570
- Home prices YoY
- -15.1%
- Rents YoY
- 2.7%
- Active inventory
- 360
- Price-to-rent
- 10.7×
Monthly cashflow live
- Estimated rent
- $2,016 high interval (Pro) →
- Mortgage (P&I)
- −$1,358
- Tax from tax record
- −$112 /mo · $1,341/yr
- Insurance
- −$108
- HOA
- −$0
- Vacancy / Maint / Mgmt
- −$423
- Net cashflow
- $15
Break-even live
Sensitivity live
| Price | -10% $161 | -5% $88 | +0% $15 | +5% $-58 | +10% $-132 |
|---|---|---|---|---|---|
| Rent | -10% $-144 | -5% $-65 | +0% $15 | +5% $94 | +10% $174 |
| Rate | -1.0pp $145 | -0.5pp $81 | base $15 | +0.5pp $-52 | +1.0pp $-121 |
UW: 25.0% down · 7.5% · 30yr · 1.5% tax · 5.0% vac · 8.0% maint · 8.0% mgmt
Financing live
Cash to close
- Down payment
- $64,750
- Closing costs
- $7,770
- Reserves months
- —
- Total cash needed
- —
Loan-product check · same deal, 3 products live
Conventional
25% down · 7.5% · 30yr
- Down + closing
- —
- Monthly P&I
- —
- Monthly cashflow
- —
- DSCR
- —
- Eligible?
- —
Personal DTI + credit; lowest rate.
DSCR
20% down · 8.5% · 30yr
- Down + closing
- —
- Monthly P&I
- —
- Monthly cashflow
- —
- DSCR
- —
- Eligible?
- —
No personal income docs; deal must DSCR.
Hard money
10% down · 12.0% · 12mo
- Down + closing
- —
- Monthly P&I
- —
- Monthly cashflow
- —
- DSCR
- —
- Eligible?
- —
Short-term bridge; refi at stabilization.
Rent comps 6 comps
| Address | Beds | Baths | Sqft | Rent | $/sqft | DOM | Units | Dist |
|---|---|---|---|---|---|---|---|---|
| 5837 Berryhill Rd Milton, FL | 3.0 | 2.0 | 1131 | $1,950 | $1.72 | 23d | 1 | 0.66mi |
| 5723 Maggie Rose Cir Milton, FL | 3.0 | 2.0 | 1610 | $2,000 | $1.24 | 25d | 1 | 0.79mi |
| 5723 Maggie Rose Cir Milton, FL | 3.0 | 2.0 | 1610 | $2,000 | $1.24 | 15d | 1 | 0.79mi |
| 5555 Hannah St Milton, FL | 3.0 | 2.0 | 2010 | $1,900 | $0.95 | 25d | 1 | 0.84mi |
| 5432 Homestead Dr Milton, FL | 3.0 | 2.0 | 1701 | $1,700 | $1.00 | 15d | 1 | 1.19mi |
| 5733 Orange St Milton, FL | 3.0 | 1.5 | 1640 | $1,500 | $0.91 | 25d | 1 | 1.26mi |
Listing history 3 events
-
2026-06-22days on market $259,000 Active 4 DOM
-
2026-06-17remarks 699-char remark
-
2026-06-17$259,000 Active 1 DOM
ⓘ Source: listings_history table (triggers on properties + properties_extension) + one-shot
backfill from property_details.listing_events for pre-trigger history.
Tax reassessment forecast FL · Resets to sale price
- Current annual tax
- $1,341 · $112/mo
- Projected year-2 tax
- $2,150 · $179/mo
- Expected delta
- +$809/yr (+$67/mo · 60.3%)
ⓘ Screening estimate from a state-policy table — verify with the county assessor before closing.
Climate risk First Street
- Flood 1/10 Low FEMA zone X (unshaded) · 0% chance over 30 yrs
- Wildfire 3/10 Moderate
- Heat 10/10 Extreme 7 d/yr ≥105°F today · 22 d/yr by 30 yrs out
- Wind 9/10 Extreme 99% chance of damaging wind over 30 yrs
- Air quality 1/10 Low 0 unhealthy d/yr today · 0 by 30 yrs out
Nearby sold comps map
Loading sold comps map…
Walkable amenities ~0.75 mi
Loading nearby amenities…
Taxation est. · year 1
- Rental income
- $24,194
- − Mortgage interest
- −$14,508
- − Property taxes
- −$1,341
- − Insurance
- −$1,295
- − Repairs & maintenance
- −$1,935
- − Management
- −$1,935
- − Depreciation
- −$7,535
- Taxable loss
- −$4,356
- Est. tax savings @ 24.0%
- +$1,045
- After-tax cash flow
- $1,224/yr
For passive investors: Depreciation is non-cash, so a rental often shows a tax loss while cash-flowing — sheltering income. Rental losses are passive: they offset passive income freely, and up to $25,000/yr can offset ordinary (W-2) income if you actively participate and your MAGI is under $100k (phasing out to $0 by $150k); unused losses carry forward. On sale, claimed depreciation is recaptured at up to 25%, and gains may owe capital-gains tax (a 1031 exchange can defer both). Figures are a year-1 estimate at your 24.0% rate — not tax advice; consult a CPA.
Schools (NCES district)
- District
- Santa Rosa
- NCES district ID
- 1201650
- Math proficiency
- 63% ▼ -6.00%
- Reading proficiency
- 60% ▼ -5.00%
- Median HH income
- $58,161
- Composite
- 53.12/100
- National rank
- #1511
- State rank
- #8 of 73 in FL
Livability — Milton
- Score
- 78/100
- State rank
- #166
- US rank
- #2480
Category grades
Schools grade is shown separately in the Schools card above.
Census & demographics
- County
- Santa Rosa County · 194,764 people
- City population
- 69,025
- Metro
- Pensacola-Ferry Pass-Brent, FL
- Population (ZIP)
- 37,197
- Household income
- $77,222
- Rent vs Own
- Severe rent burden
- 590.0
Population outlook (Santa Rosa County) Hauer SSP2
- Today (2025)
- 195,978 people
- By 2030
- 209,782 · +7.0%
- By 2040
- 235,293 · +20.1%
- By 2050
- 256,408 · +30.8%
- By 2075
- 298,074 · +52.1%
- By 2100
- 303,216 · +54.7%
Race, ethnicity, and origin ACS 2023
- Neighborhood character
- Predominantly White (80%)
- Race & ethnicity
- White 80% Two or more races 7% Black 6% Hispanic / Latino 6% Asian 1%
- Hispanic origin (detail)
- Mexican 2% Puerto Rican 2%
- Common ancestry
- Italian 4% Lithuanian 3% Portuguese 2%
- Foreign-born
- 4% · Canada
- Languages at home
- 94% English-only · Spanish 4% Other Asian/Pacific 1%
Political lean MEDSL · Santa Rosa
- 2024 margin
- Solid R (+51.0) · D 24.1% · R 75.0%
- 2008→2024 swing
- -3.0pp toward R · 2008: -47.9pp · 2024: -51.0pp
- All cycles
- 2024: R+51.0 2020: R+46.5 2016: R+53.5 2012: R+52.6 2008: R+47.9
Not yet ingested
- Civics
- —
Market trends
- HPI YoY
- ▼ -51.06%
- Current HPI
- 287.7469
- Rent YoY
- ▲ 2.70%
- Metro
- Pensacola-Ferry Pass-Brent, FL
- State GDP YoY
- ▲ 3.28%
- F500 in state
- 36
Industry mix (Fortune 500 HQ in FL)
| Industry | F500 HQs | Revenue |
|---|---|---|
| Industrial Technology | 2 | $29B |
|
||
| Insurance | 2 | $17B |
|
||
| Retail | 1 | $60B |
|
||
| Technology Distribution | 1 | $58B |
|
||
| Homebuilding | 1 | $35B |
|
||
| Technology Manufacturing | 1 | $35B |
|
||
Price history
+239.4% since first listed8 events — show timeline
- 2026-06-17 Listed $259,000 PARMLS
- 2017-12-29 Sold (MLS) $153,000 PARMLS
- 2017-09-13 Listed $155,000 PARMLS
- 2009-08-19 Listing Removed — PARMLS
- 2009-08-06 Listed $135,000 PARMLS
- 2005-04-25 Sold (Public Records) $148,900 Public Records
- 2004-04-21 Sold (Public Records) $115,000 Public Records
- 1995-06-01 Sold (Public Records) $76,300 Public Records
Property tax history
+2.3%/yrLatest (2025): $1,341 · +5.8% YoY. Source: county tax records.
Cash-flow waterfall
monthlySold comps — $/sqft
last 12 mo · ≤1 miLoading sold comps…