1083 E South St · Greenfield, IN
Flood risk 1/10 · Minimal
- FEMA flood zone
- X (unshaded)
- Chance of flooding over 30 yrs
- 0.0%
- Est. flood insurance / yr
- $507 – $1,088
Fire risk 1/10 · Minimal
- Est. fire insurance / yr
- $717 – $1,331
Heat risk 3/10 · Minor
- Hot days now (above 102°F)
- 7 days/yr
- Hot days in 30 yrs
- 18 days/yr
Wind risk 2/10 · Minimal
- Chance of severe wind over 30 yrs
- 1.0%
Air-quality risk 2/10 · Minimal
- Unhealthy air days now
- 1 days/yr
- Unhealthy air days in 30 yrs
- 2 days/yr
Risk factors via First Street. Map © Google.
Why this score? — see what drove the B grade
The composite is a weighted blend of 9 inputs, each scored 0–100. Each bar is that input's sub-score; the figure is the points it added to the 100-point composite (weight × sub-score).
- Cash flow +30.0/30.0
- 1% rule +10.0/10.0
- DSCR +10.0/10.0
- ARV discount +7.5/15.0
- Schools +4.0/10.0
- Livability +3.7/5.0
- Rent growth +3.2/5.0
- Condition / age +2.5/5.0
- Appreciation +0.0/10.0
$89,900
🖨 Deal sheet (PDF) 📄 Offer letter ✓ Due diligence
Listing remarks MLS
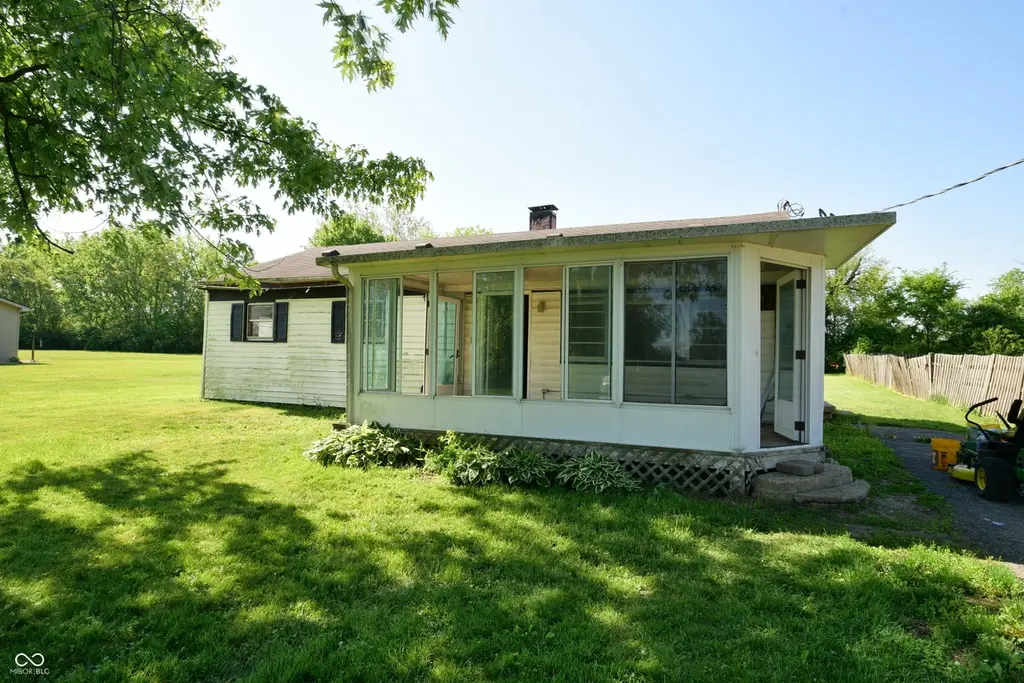
Bank owned ranch home being sold 'as-is'. You must submit proof of funds or pre-approval letter, copy of earnest money check and signed bank addendums w/ your offer. Sided home needing much repair. Home may have some mold on the interior. (G-cou)
Key facts
- Spacious lot
- Updated bathroom
- 0.33 acre lot
Tags
Property features AI
Finance
- Other: Approximately 0.33-acre lot
Exterior
- Utilities: Public water; Municipal sewer connected; No solid waste service listed
- Home design: Single-family residence; One level
- Construction: Vinyl siding; Crawl space foundation
- Exterior features: Glass-enclosed patio/porch; No fence
Interior
- Kitchen: Kitchen (21x8)
- Bedrooms: 3 bedrooms on the main level
- Bathrooms: 1 full bathroom (main level)
- Heating & cooling: Forced air heating (natural gas); No central cooling
- Interior features: Attic access
Neighborhood map
What this means for you Summary
Snapshot
- This is a 3-bed/1.0-bath single-family listed at $90k.
Deal economics
- At list price, monthly cash flow is $821 ($10k/yr) — positive.
- The deal already cash-flows at list — no discount required.
- Meets the 1% rule at list price ($2k rent vs $90k).
- Cap rate 17.3% vs local median 4.4% in Greenfield — top-decile yield for the area; either an underpriced asset or a hidden risk that comps aren't pricing in. Stress-test before assuming the spread holds.
Location & tenants
- Location reads 73/100 on livability (#88 in IN) — a middle-class / working-renter tenant base. Strengths: cost of living A+, housing A+, schools B; Watch: amenities F, commute F.
- Greenfield-Central Community Schools (other): math 47% / reading 45% proficiency, ranked #83 of 301 in IN (top 28%) — families likely to look elsewhere, expect single-tenant / working-renter base with shorter leases.
- Market conditions: Rents rising (+2.9%/yr); 481 active listings in the ZIP; 10 comparable units currently listed for rent nearby; rentals leasing fast (median 5d on market — plan ~1-2 weeks tenant-placement turnaround); solid renter incomes; 1,091 units permitted in Hancock County in 2024 (0 in 5+ unit buildings).
Forward outlook
- Local home prices are declining (-3.0%/yr); year-one equity from $622 of loan paydown is wiped out by about $3k of value loss. Plan a longer hold.
- Hancock County population projected at +7% by 2050 — modest demand growth; plan on rents tracking national, not racing it.
- At projected returns (-3.0% appreciation + 2.9% rent growth), your $25k cash investment doubles in ~4 years — after that, you're playing with house money.
Negotiation context
- Only 7 days on market — expect competitive offers; lowballing is unlikely to land.
- 2 sale attempts since 23y ago with the ask held roughly flat each time — persistent listings suggest the price (not the market) is what's stuck; bring a comps-based counter.
- Current owner paid $30k; list at $90k implies a 201% gain — meaningful room to come down on a strong offer.
Risks & watch-outs
- Watch-outs: built in 1950 — expect roof / HVAC / electrical / plumbing capex.
Questions for the listing agent
- Built in 1950 — when were the roof, HVAC, electrical panel, plumbing, and water heater last replaced?
- Is there a deadline driving the sale (1031 exchange, divorce, estate, relocation)? That informs how much negotiation room exists.
- Schools are B-rated — typically a magnet for longer-tenancy family renters. What's the average tenant stay here, and is there a school-zone premium baked into asking?
- What's the average days-on-market for RENTAL listings here right now (not sales)? A rising rental-DOM trend means longer vacancies and softer asking-rent achievability than the comps imply.
- What's the recent tenant-quality profile in this submarket — average credit score on applications, eviction rate, late-payment / NSF rate, and stable-employment percentage? A property-management company in the area should have these aggregated.
- How much new for-sale + rental construction is in the pipeline within 1–3 miles? Heavy new supply typically softens prices + rents 12–24 months out; constrained supply supports both.
Investment metrics
- 1% rule
- 1.94% ✓
- Cap rate
- 17.25%
- Cash-on-cash
- 39.14%
- DSCR
- 2.74
- GRM
- 4.3
CMA / ARV
- ARV (on-the-fly)
- $198,576
- Comps found
- 12
Show comp detail 12 sales within ~0.75 mi
| Address | Dist | Beds/Ba | Sqft | Sold | Price | $/sf | Match |
|---|---|---|---|---|---|---|---|
| 1083 E South St | 0.00mi | 3/1.0 | 1,008 (0%) | 1mo | $95,000 | $94 | 99 |
| 1214 E Third St | 0.31mi | 3/1.0 | 1,080 (+7%) | 0mo | $125,000 | $116 | 74 |
| 310 Cherry St | 0.29mi | 3/1.0 | 936 (-7%) | 5mo | $150,000 | $160 | 70 |
| 319 Brookstone Dr | 0.59mi | 3/2.0 | 1,110 (+10%) | 2mo | $237,500 | $214 | 50 |
| 131 Howard St | 0.40mi | 2/1.0 (-1) | 864 (-14%) | 3mo | $162,000 | $188 | 50 |
| 1652 Sweetwater Ln | 0.71mi | 2/2.0 (-1) | 1,022 (+1%) | 10mo | $200,000 | $196 | 47 |
| 1616 Sweetwater Ln | 0.68mi | 3/2.0 | 1,110 (+10%) | 1mo | $235,000 | $212 | 47 |
| 115 N Spring St | 0.67mi | 2/1.0 (-1) | 950 (-6%) | 13mo | $187,000 | $197 | 43 |
| 1647 Sweetwater Ln | 0.68mi | 3/2.0 | 1,110 (+10%) | 6mo | $229,900 | $207 | 42 |
| 1696 Carlton Dr | 0.67mi | 3/2.0 | 1,110 (+10%) | 13mo | $236,000 | $213 | 37 |
| 1683 Sweetwater Ln | 0.71mi | 3/2.0 | 1,110 (+10%) | 13mo | $232,000 | $209 | 35 |
| 604 Wood St | 0.73mi | 2/1.0 (-1) | 1,116 (+11%) | 12mo | $209,000 | $187 | 33 |
Match score weights: distance 35% · size 25% · config 20% · recency 20%. Top-matched comps best support the ARV.
Projected returns pro-forma
-3.0% appreciation · 2.88% rent growth · sell at horizon
- IRR
- 35.2%
- Equity multiple
- 2.49×
- Total profit
- $37,498
- Equity at exit
- $13,404
- IRR
- 41.9%
- Equity multiple
- 4.94×
- Total profit
- $99,064
- Equity at exit
- $7,773
Cash invested: $25,172 (down + closing). Projections, not guarantees.
Landlord ↔ Tenant lean methodology
- Overall (STATE)
- 90 Strongly Landlord-Friendly
- State Indiana
- 90 Strongly Landlord-Friendly · R+11
- County
- — inherits STATE
- City
- — inherits STATE
ZIP-level market 46140
- Rents YoY
- 2.9%
- Active inventory
- 481
- Price-to-rent
- 4.3×
Monthly cashflow live
- Estimated rent
- $1,741 high interval (Pro) →
- Mortgage (P&I)
- −$471
- Tax from tax record
- −$46 /mo · $546/yr
- Insurance
- −$37
- HOA
- −$0
- Vacancy / Maint / Mgmt
- −$366
- Net cashflow
- $821
Break-even live
Sensitivity live
| Price | -10% $872 | -5% $846 | +0% $821 | +5% $796 | +10% $770 |
|---|---|---|---|---|---|
| Rent | -10% $683 | -5% $752 | +0% $821 | +5% $890 | +10% $959 |
| Rate | -1.0pp $866 | -0.5pp $844 | base $821 | +0.5pp $798 | +1.0pp $774 |
UW: 25.0% down · 7.5% · 30yr · 1.5% tax · 5.0% vac · 8.0% maint · 8.0% mgmt
Financing live
Cash to close
- Down payment
- $22,475
- Closing costs
- $2,697
- Reserves months
- —
- Total cash needed
- —
Loan-product check · same deal, 3 products live
Conventional
25% down · 7.5% · 30yr
- Down + closing
- —
- Monthly P&I
- —
- Monthly cashflow
- —
- DSCR
- —
- Eligible?
- —
Personal DTI + credit; lowest rate.
DSCR
20% down · 8.5% · 30yr
- Down + closing
- —
- Monthly P&I
- —
- Monthly cashflow
- —
- DSCR
- —
- Eligible?
- —
No personal income docs; deal must DSCR.
Hard money
10% down · 12.0% · 12mo
- Down + closing
- —
- Monthly P&I
- —
- Monthly cashflow
- —
- DSCR
- —
- Eligible?
- —
Short-term bridge; refi at stabilization.
Rent comps 10 comps
| Address | Beds | Baths | Sqft | Rent | $/sqft | DOM | Units | Dist |
|---|---|---|---|---|---|---|---|---|
| 1027 E Fourth St Greenfield, IN | 3.0 | 2.0 | 1430 | $1,700 | $1.19 | 24d | 1 | 0.31mi |
| 210 Flagstone Dr Greenfield, IN | 1.0–3.0 | 1.0–2.5 | 1084 | $2,254 | $2.08 | 2d | 17 | 0.33mi |
| 1014 E Seventh St Greenfield, IN | 3.0 | 1.0 | 1192 | $1,400 | $1.17 | 5d | 1 | 0.52mi |
| 432 Baldwin St Greenfield, IN | 2.0 | 1.0 | 788 | $1,425 | $1.81 | 24d | 1 | 0.55mi |
| 550 Wood St Greenfield, IN | 2.0 | 1.0 | 1162 | $1,200 | $1.03 | 4d | 1 | 0.70mi |
| 220 Walker St Greenfield, IN | 3.0 | 1.0 | 1101 | $1,400 | $1.27 | 5d | 1 | 0.83mi |
| 917 E McKenzie Rd Greenfield, IN | 1.0–2.0 | 1.0–1.5 | 918 | $1,199 | $1.31 | 2d | 4 | 0.99mi |
| 685 Gondola Run Greenfield, IN | 3.0 | 2.0 | 1058 | $1,750 | $1.65 | 2d | 1 | 1.26mi |
| 713 Cattail Dr Greenfield, IN | 3.0 | 2.0 | 1498 | $2,045 | $1.37 | 3d | 1 | 1.34mi |
| 821 W 7th St Greenfield, IN | 2.0 | 2.0 | 1234 | $1,700 | $1.38 | 24d | 1 | 1.44mi |
Listing history 4 events
-
2026-05-19status Pending
-
2026-05-11$89,900 Active
-
2003-07-29soldstatus $29,900 248-char remark
Show marketing remark (248 chars)
Bank owned ranch home being sold 'as-is'. You must submit proof of funds or pre-approval letter, copy of earnest money check and signed bank addendums w/ your offer. Sided home needing much repair. Home may have some mold on the interior. (G-cou)
-
2003-07-12$29,900 248-char remark
Show marketing remark (248 chars)
Bank owned ranch home being sold 'as-is'. You must submit proof of funds or pre-approval letter, copy of earnest money check and signed bank addendums w/ your offer. Sided home needing much repair. Home may have some mold on the interior. (G-cou)
ⓘ Source: listings_history table (triggers on properties + properties_extension) + one-shot
backfill from property_details.listing_events for pre-trigger history.
Tax reassessment forecast IN · Partial reset (capped growth)
- Current annual tax
- $546 · $46/mo
- Projected year-2 tax
- $655 · $55/mo
- Expected delta
- +$109/yr (+$9/mo · 19.9%)
ⓘ Screening estimate from a state-policy table — verify with the county assessor before closing.
Climate risk First Street
- Flood 1/10 Low FEMA zone X (unshaded) · 0% chance over 30 yrs
- Wildfire 1/10 Low
- Heat 3/10 Moderate 7 d/yr ≥102°F today · 18 d/yr by 30 yrs out
- Wind 2/10 Low 100% chance of damaging wind over 30 yrs
- Air quality 2/10 Low 1 unhealthy d/yr today · 2 by 30 yrs out
Nearby sold comps map
Loading sold comps map…
Walkable amenities ~0.75 mi
Loading nearby amenities…
Taxation est. · year 1
- Rental income
- $20,893
- − Mortgage interest
- −$5,036
- − Property taxes
- −$546
- − Insurance
- −$450
- − Repairs & maintenance
- −$1,671
- − Management
- −$1,671
- − Depreciation
- −$2,615
- Taxable income
- $8,903
- Est. tax owed @ 24.0%
- −$2,137
- After-tax cash flow
- $7,715/yr
For passive investors: Depreciation is non-cash, so a rental often shows a tax loss while cash-flowing — sheltering income. Rental losses are passive: they offset passive income freely, and up to $25,000/yr can offset ordinary (W-2) income if you actively participate and your MAGI is under $100k (phasing out to $0 by $150k); unused losses carry forward. On sale, claimed depreciation is recaptured at up to 25%, and gains may owe capital-gains tax (a 1031 exchange can defer both). Figures are a year-1 estimate at your 24.0% rate — not tax advice; consult a CPA.
Schools (NCES district)
- District
- Greenfield-Central Community Schools
- NCES district ID
- 1804050
- Math proficiency
- 47% ▼ -12.00%
- Reading proficiency
- 45% ▼ -11.00%
- Median HH income
- $55,533
- Composite
- 40.01/100
- National rank
- #3827
- State rank
- #83 of 301 in IN
Livability — Greenfield
- Score
- 73/100
- State rank
- #88
- US rank
- #5094
Category grades
Schools grade is shown separately in the Schools card above.
Census & demographics
- Census place
- Greenfield, IN
- County
- Hancock County · 59,521 people
- City population
- 43,511
- Metro
- Indianapolis-Carmel-Anderson, IN
- Population (ZIP)
- 43,511
- Household income
- $83,056
- Rent vs Own
- Severe rent burden
- 795.0
Population outlook (Hancock County) Hauer SSP2
- Today (2025)
- 77,820 people
- By 2030
- 79,914 · +2.7%
- By 2040
- 82,734 · +6.3%
- By 2050
- 83,348 · +7.1%
- By 2075
- 82,439 · +5.9%
- By 2100
- 74,181 · -4.7%
Race, ethnicity, and origin ACS 2023
- Neighborhood character
- Predominantly White (92%)
- Race & ethnicity
- White 92% Two or more races 5% Hispanic / Latino 3% Black 1%
- Common ancestry
- Italian 3% Lithuanian 3% Slovak 1%
- Foreign-born
- 3% · Canada
- Languages at home
- 96% English-only · Spanish 2% Other Indo-European 1%
Political lean MEDSL · Hancock
- 2024 margin
- Solid R (+33.7) · D 32.2% · R 65.9% · Other 1.9%
- 2008→2024 swing
- -4.1pp toward R · 2008: -29.6pp · 2024: -33.7pp
- All cycles
- 2024: R+33.7 2020: R+37.5 2016: R+44.8 2012: R+41.0 2008: R+29.6
Not yet ingested
- Civics
- —
Market trends
- HPI YoY
- ▼ -131.67%
- Current HPI
- 225.0367
- Rent YoY
- ▲ 2.88%
- Metro
- Indianapolis-Carmel-Anderson, IN
- State GDP YoY
- ▲ 2.90%
- F500 in state
- 18
Industry mix (Fortune 500 HQ in IN)
| Industry | F500 HQs | Revenue |
|---|---|---|
| Industrial Machinery | 2 | $37B |
|
||
| Healthcare | 1 | $177B |
|
||
| Pharmaceuticals | 1 | $45B |
|
||
| Metals / Steel | 1 | $18B |
|
||
| Agriculture | 1 | $17B |
|
||
| Packaging | 1 | $12B |
|
||
Price history
+200.7% since first listed4 events — show timeline
- 2026-05-19 Pending — MIBOR as Distributed by MLS Grid
- 2026-05-11 Listed $89,900 MIBOR as Distributed by MLS Grid
- 2003-07-29 Sold (MLS) $29,900 MIBOR as Distributed by MLS Grid
- 2003-07-12 Listed $29,900 MIBOR as Distributed by MLS Grid
Property tax history
+10.6%/yrLatest (2025): $546 · -5.4% YoY. Source: county tax records.
Cash-flow waterfall
monthlySold comps — $/sqft
last 12 mo · ≤1 miLoading sold comps…