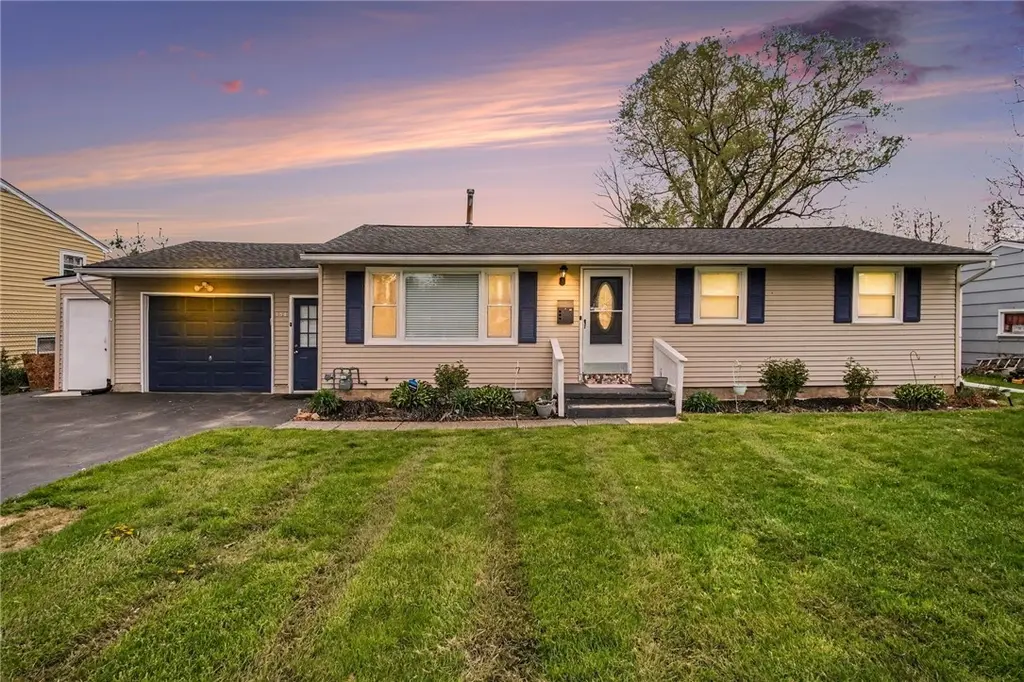
154 Burben Way · Rochester, NY
Flood risk 1/10 · Minimal
- FEMA flood zone
- X (unshaded)
- Chance of flooding over 30 yrs
- 0.0%
- Est. flood insurance / yr
- $473 – $860
Fire risk 2/10 · Minimal
- Est. fire insurance / yr
- $691 – $1,283
Heat risk 2/10 · Minimal
- Hot days now (above 96°F)
- 7 days/yr
- Hot days in 30 yrs
- 15 days/yr
Wind risk 1/10 · Minimal
- Chance of severe wind over 30 yrs
- —
Air-quality risk 2/10 · Minimal
- Unhealthy air days now
- 1 days/yr
- Unhealthy air days in 30 yrs
- 1 days/yr
Risk factors via First Street. Map © Google.
Why this score? — see what drove the C- grade
The composite is a weighted blend of 9 inputs, each scored 0–100. Each bar is that input's sub-score; the figure is the points it added to the 100-point composite (weight × sub-score).
- Cash flow +16.1/30.0
- ARV discount +14.0/15.0
- 1% rule +6.9/10.0
- DSCR +5.0/10.0
- Livability +3.8/5.0
- Schools +3.6/10.0
- Rent growth +2.5/5.0
- Condition / age +2.5/5.0
- Appreciation +0.0/10.0
$179,900
🖨 Deal sheet 📄 Offer letter ✓ Due diligence
Listing remarks MLS
PRICE JUST REDUCED $5K!!!! Priced below assessment. 3 Bedroom ranch on a dead end street. Close to airport, expressways, shopping. Price reflects some rehab needed. Good candidate for 203K loan. See attachment for foundation quote.
Key facts
- Large living area
- Heated garage
- Spacious backyard
Tags
Property features AI
Exterior
- Parking: Attached heated garage (1 car)
- Utilities: Public water (connected); Sewer connected
- Home design: Single-story existing home
- Construction: Vinyl siding; Asphalt roof; Block foundation
- Exterior features: Blacktop driveway; Rectangular residential lot (approx. 0.3 acres, 75 x 179); City street frontage
Interior
- Kitchen: Dishwasher; Electric oven; Electric range; Microwave; Refrigerator; Gas water heater
- Bedrooms: Four main-level bedrooms
- Flooring: Carpet; Ceramic tile; Varied flooring
- Bathrooms: One full bathroom (main level)
- Heating & cooling: Gas forced-air heating
- Interior features: Eat-in kitchen; Storage; Full basement with sump pump; Laundry in basement
- Laundry & utility: Washer/dryer area in basement
Neighborhood map
What this means for you Summary
Snapshot
- This is a 3-bed/1.5-bath single-family listed at $180k.
Deal economics
- At list price, monthly cash flow is $92 ($1k/yr) — positive.
- The deal already cash-flows at list — no discount required.
- Meets the 1% rule at list price ($2k rent vs $180k).
- Cap rate 6.9% vs local median 9.3% in Rochester — below-typical yield; the buyer is paying a premium for something (appreciation thesis, condition, location) that the cap rate doesn't capture.
Location & tenants
- Location reads 76/100 on livability (#222 in NY, #3,482 nationally) — a middle-class / working-renter tenant base. Strengths: commute A+, cost of living A+, housing A+; Watch: schools D+, crime F, employment F.
- Gates-Chili Central School District (suburban): math 41% / reading 42% proficiency, ranked #491 of 590 in NY (top 83%) — families likely to look elsewhere, expect single-tenant / working-renter base with shorter leases.
- Market conditions: 127 active listings in the ZIP; 2 comparable units currently listed for rent nearby; solid renter incomes; 1,169 units permitted in Monroe County in 2024 (591 in 5+ unit buildings).
Forward outlook
- Local home prices are declining (-3.0%/yr); year-one equity from $1k of loan paydown is wiped out by about $5k of value loss. Plan a longer hold.
- Monroe County population projected to shrink 6% by 2050 — rents likely to lag national; underwrite the cash flow, not the appreciation.
Negotiation context
- Only 8 days on market — expect competitive offers; lowballing is unlikely to land.
- 5 sale attempts since 13y ago with the ask held roughly flat each time — persistent listings suggest the price (not the market) is what's stuck; bring a comps-based counter.
- Current owner paid $50k; list at $180k implies a 260% gain — meaningful room to come down on a strong offer.
Risks & watch-outs
- Watch-outs: property tax is 3.9% of price; built in 1959 — expect roof / HVAC / electrical / plumbing capex.
Questions for the listing agent
- Built in 1959 — when were the roof, HVAC, electrical panel, plumbing, and water heater last replaced?
- Property tax is high relative to price — has the assessment been appealed recently, and will the sale trigger a re-assessment?
- Is there a deadline driving the sale (1031 exchange, divorce, estate, relocation)? That informs how much negotiation room exists.
- Schools are D-rated, which usually means shorter tenancies and higher turnover. Who's the typical renter profile here, and what's been the actual vacancy rate?
- Crime grade is F in this area — have there been break-ins, vandalism, or insurance claims at this property in the last 3 years? What carrier currently insures it and at what premium?
- What's the average days-on-market for RENTAL listings here right now (not sales)? A rising rental-DOM trend means longer vacancies and softer asking-rent achievability than the comps imply.
- What's the recent tenant-quality profile in this submarket — average credit score on applications, eviction rate, late-payment / NSF rate, and stable-employment percentage? A property-management company in the area should have these aggregated.
- How much new for-sale + rental construction is in the pipeline within 1–3 miles? Heavy new supply typically softens prices + rents 12–24 months out; constrained supply supports both.
Investment metrics
- 1% rule
- 1.19% ✓
- Cap rate
- 6.91%
- Cash-on-cash
- 2.20%
- DSCR
- 1.10
- GRM
- 7.0
CMA / ARV
- ARV (median comp)
- $210,197
- List price
- $179,900
- Delta
- -14.41%
- Verdict
- UNDERPRICED
- Comps
- 20 within 1.0 mi
Show comp detail 12 sales within ~0.75 mi
| Address | Dist | Beds/Ba | Sqft | Sold | Price | $/sf | Match |
|---|---|---|---|---|---|---|---|
| 107 Burben Way | 0.13mi | 2/2.0 (-1) | 1,360 (+1%) | 3mo | $114,000 | $84 | 83 |
| 148 Burben Way | 0.04mi | 3/1.0 | 1,220 (-9%) | 8mo | $212,000 | $174 | 74 |
| 30 Frostholm Dr | 0.29mi | 3/1.0 | 1,248 (-7%) | 11mo | $189,000 | $151 | 64 |
| 234 Fisher Rd | 0.51mi | 3/2.0 | 1,326 (-1%) | 11mo | $240,000 | $181 | 63 |
| 122 Fisher Rd | 0.58mi | 3/1.5 | 1,428 (+6%) | 7mo | $226,000 | $158 | 57 |
| 79 Mareeta Rd | 0.53mi | 3/1.5 | 1,189 (-12%) | 6mo | $245,000 | $206 | 51 |
| 90 Caroline Dr | 0.74mi | 3/1.5 | 1,453 (+8%) | 5mo | $220,000 | $151 | 48 |
| 203 Elham Rd | 0.59mi | 3/1.0 | 1,152 (-14%) | 0mo | $180,000 | $156 | 46 |
| 4 Ranch Village Ln | 0.59mi | 3/1.0 | 1,174 (-13%) | 7mo | $242,500 | $207 | 44 |
| 14 Fisher Rd | 0.66mi | 4/2.0 (+1) | 1,464 (+9%) | 9mo | $195,000 | $133 | 40 |
| 247 Dorstone Rd | 0.54mi | 2/1.0 (-1) | 1,176 (-12%) | 9mo | $150,000 | $128 | 40 |
| 114 Arrowhead Dr | 0.75mi | 3/1.0 | 1,144 (-15%) | 8mo | $172,500 | $151 | 31 |
Match score weights: distance 35% · size 25% · config 20% · recency 20%. Top-matched comps best support the ARV.
Projected returns pro-forma
-3.0% appreciation · 3.0% rent growth · sell at horizon
- IRR
- -12.6%
- Equity multiple
- 0.54×
- Total profit
- $-23,020
- Equity at exit
- $26,824
- IRR
- -3.4%
- Equity multiple
- 0.77×
- Total profit
- $-11,457
- Equity at exit
- $15,554
Cash invested: $50,372 (down + closing). Projections, not guarantees.
Landlord ↔ Tenant lean methodology
- Overall (STATE)
- 15 Strongly Tenant-Friendly
- State New York
- 15 Strongly Tenant-Friendly · D+10
- County
- — inherits STATE
- City
- — inherits STATE
ZIP-level market 14624
- Active inventory
- 127
- Price-to-rent
- 7.0×
Monthly cashflow live
- Estimated rent
- $2,139 medium interval (Pro) →
- Mortgage (P&I)
- −$943
- Tax from tax record
- −$579 /mo · $6,947/yr
- Insurance
- −$75
- HOA
- −$0
- Vacancy / Maint / Mgmt
- −$449
- Net cashflow
- $92
Break-even live
UW: 25.0% down · 7.5% · 30yr · 1.5% tax · 5.0% vac · 8.0% maint · 8.0% mgmt
Financing live
Cash to close
- Down payment
- $44,975
- Closing costs
- $5,397
- Reserves months
- —
- Total cash needed
- —
Loan-product check · same deal, 3 products live
Conventional
25% down · 7.5% · 30yr
- Down + closing
- —
- Monthly P&I
- —
- Monthly cashflow
- —
- DSCR
- —
- Eligible?
- —
Personal DTI + credit; lowest rate.
DSCR
20% down · 8.5% · 30yr
- Down + closing
- —
- Monthly P&I
- —
- Monthly cashflow
- —
- DSCR
- —
- Eligible?
- —
No personal income docs; deal must DSCR.
Hard money
10% down · 12.0% · 12mo
- Down + closing
- —
- Monthly P&I
- —
- Monthly cashflow
- —
- DSCR
- —
- Eligible?
- —
Short-term bridge; refi at stabilization.
Rent comps 2 comps
| Address | Beds | Baths | Sqft | Rent | $/sqft | DOM | Units | Dist |
|---|---|---|---|---|---|---|---|---|
| 254 Fisher Rd Rochester, NY | 2.0 | 1.0 | 1100 | $2,250 | $2.05 | 44d | 1 | 0.53mi |
| 266 Fisher Rd Rochester, NY | 2.0 | 2.0 | 1100 | $1,800 | $1.64 | 44d | 1 | 0.54mi |
Listing history 11 events
-
2026-05-14$179,900 Active 468-char remark
-
2015-10-06historical 232-char remark
Show marketing remark (232 chars)
PRICE JUST REDUCED $5K!!!! Priced below assessment. 3 Bedroom ranch on a dead end street. Close to airport, expressways, shopping. Price reflects some rehab needed. Good candidate for 203K loan. See attachment for foundation quote.
-
2015-09-16soldstatus $50,000 232-char remark
Show marketing remark (232 chars)
PRICE JUST REDUCED $5K!!!! Priced below assessment. 3 Bedroom ranch on a dead end street. Close to airport, expressways, shopping. Price reflects some rehab needed. Good candidate for 203K loan. See attachment for foundation quote.
-
2015-09-08soldstatus $50,000
-
2015-07-16price $49,500
-
2015-07-06price $55,900
-
2015-06-11$49,500 232-char remark
Show marketing remark (232 chars)
PRICE JUST REDUCED $5K!!!! Priced below assessment. 3 Bedroom ranch on a dead end street. Close to airport, expressways, shopping. Price reflects some rehab needed. Good candidate for 203K loan. See attachment for foundation quote.
-
2014-11-15$69,900
-
2013-10-02$84,900
-
2013-03-20$84,900
-
2000-12-21soldstatus $65,000
ⓘ Source: listings_history table (triggers on properties + properties_extension) + one-shot
backfill from property_details.listing_events for pre-trigger history.
Tax reassessment forecast NY · Partial reset (capped growth)
- Current annual tax
- $6,947 · $579/mo
- Projected year-2 tax
- $6,947 · $579/mo
- Expected delta
- $0/yr ($0/mo · 0.0%)
ⓘ Screening estimate from a state-policy table — verify with the county assessor before closing.
Climate risk First Street
- Flood 1/10 Low FEMA zone X (unshaded) · 0% chance over 30 yrs
- Wildfire 2/10 Low
- Heat 2/10 Low 7 d/yr ≥96°F today · 15 d/yr by 30 yrs out
- Wind 1/10 Low
- Air quality 2/10 Low 1 unhealthy d/yr today · 1 by 30 yrs out
Nearby sold comps map
Loading sold comps map…
Walkable amenities ~0.75 mi
Loading nearby amenities…
Taxation est. · year 1
- Rental income
- $25,665
- − Mortgage interest
- −$10,077
- − Property taxes
- −$6,947
- − Insurance
- −$900
- − Repairs & maintenance
- −$2,053
- − Management
- −$2,053
- − Depreciation
- −$5,233
- Taxable loss
- −$1,598
- Est. tax savings @ 24.0%
- +$384
- After-tax cash flow
- $1,492/yr
For passive investors: Depreciation is non-cash, so a rental often shows a tax loss while cash-flowing — sheltering income. Rental losses are passive: they offset passive income freely, and up to $25,000/yr can offset ordinary (W-2) income if you actively participate and your MAGI is under $100k (phasing out to $0 by $150k); unused losses carry forward. On sale, claimed depreciation is recaptured at up to 25%, and gains may owe capital-gains tax (a 1031 exchange can defer both). Figures are a year-1 estimate at your 24.0% rate — not tax advice; consult a CPA.
Schools (NCES district)
- District
- Gates-Chili Central School District
- NCES district ID
- 3611880
- Math proficiency
- 41% ▼ -12.00%
- Reading proficiency
- 42% ▼ -6.00%
- Median HH income
- $55,045
- Composite
- 36.23/100
- National rank
- #4719
- State rank
- #491 of 590 in NY
Livability — Rochester
- Score
- 76/100
- State rank
- #222
- US rank
- #3482
Category grades
Schools grade is shown separately in the Schools card above.
Census & demographics
- County
- Monroe County · 674,131 people
- City population
- 432,803
- Metro
- Rochester, NY
- Population (ZIP)
- 38,626
- Household income
- $87,989
- Rent vs Own
- Severe rent burden
- 584.0
Population outlook (Monroe County) Hauer SSP2
- Today (2025)
- 759,460 people
- By 2030
- 757,154 · -0.3%
- By 2040
- 740,644 · -2.5%
- By 2050
- 714,443 · -5.9%
- By 2075
- 645,883 · -15.0%
- By 2100
- 547,084 · -28.0%
Race, ethnicity, and origin ACS 2023
- Neighborhood character
- Predominantly White (78%)
- Race & ethnicity
- White 78% Black 9% Hispanic / Latino 6% Two or more races 5% Asian 3%
- Hispanic origin (detail)
- Puerto Rican 4%
- Common ancestry
- Romanian 6% Iranian 2% Lithuanian 2%
- Foreign-born
- 7% · Canada, China, India
- Languages at home
- 90% English-only · Spanish 3% Other Indo-European 3% Russian/Polish/Slavic 1%
Political lean MEDSL · Monroe
- 2024 margin
- D (+19.1) · D 59.5% · R 40.5%
- 2008→2024 swing
- +1.4pp toward D · 2008: 17.7pp · 2024: 19.1pp
- All cycles
- 2024: D+19.1 2020: D+21.0 2016: D+14.1 2012: D+17.4 2008: D+17.7
Not yet ingested
- Civics
- —
Market trends
- HPI YoY
- ▼ -151.26%
- Current HPI
- 267.356
- Rent YoY
- —
- Metro
- Rochester, NY
- State GDP YoY
- ▲ 2.60%
- F500 in state
- 92
Industry mix (Fortune 500 HQ in NY)
| Industry | F500 HQs | Revenue |
|---|---|---|
| Financial Services | 10 | $950B |
|
||
| Consumer Goods | 9 | $162B |
|
||
| Insurance | 4 | $225B |
|
||
| Telecommunications | 2 | $144B |
|
||
| Pharmaceuticals | 2 | $112B |
|
||
| Media / Entertainment | 2 | $69B |
|
||
Price history
+176.8% since first listed12 events — show timeline
- 2026-05-22 Pending — UNYREIS
- 2026-05-14 Listed $179,900 UNYREIS
- 2015-10-06 Listing Removed — UNYREIS
- 2015-09-16 Sold (MLS) $50,000 UNYREIS
- 2015-09-08 Sold (Public Records) $50,000 Public Records
- 2015-07-16 Price Changed $49,500 WNYREIS
- 2015-07-06 Price Changed $55,900 WNYREIS
- 2015-06-11 Listed $49,500 UNYREIS
- 2014-11-15 Listed $69,900 UNYREIS
- 2013-10-02 Listed $84,900 UNYREIS
- 2013-03-20 Listed $84,900 UNYREIS
- 2000-12-21 Sold (Public Records) $65,000 Public Records
Property tax history
+6.6%/yrLatest (2025): $6,947 · +57.6% YoY. Source: county tax records.
Cash-flow waterfall
monthlySold comps — $/sqft
last 12 mo · ≤1 miLoading sold comps…