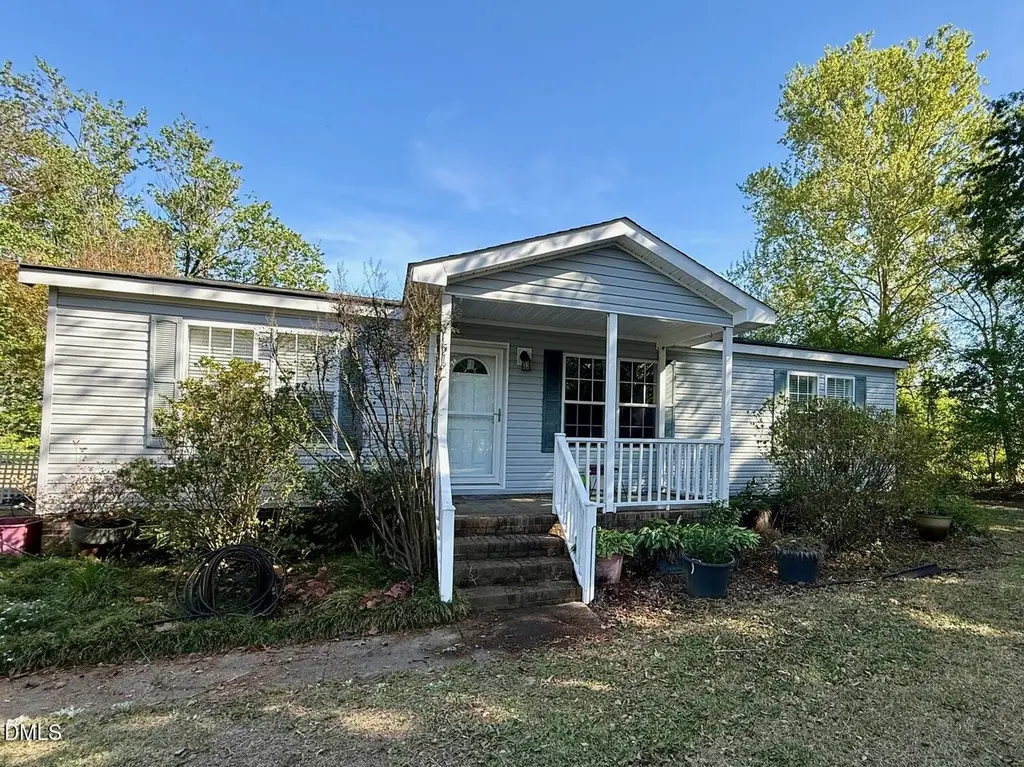
5176 Maxwell Rd · Stedman, NC
Flood risk 3/10 · Minor
- FEMA flood zone
- X (unshaded)
- Chance of flooding over 30 yrs
- 0.12%
- Est. flood insurance / yr
- $507 – $1,088
Fire risk 6/10 · Moderate
- Est. fire insurance / yr
- $906 – $1,684
Heat risk 7/10 · Major
- Hot days now (above 106°F)
- 7 days/yr
- Hot days in 30 yrs
- 16 days/yr
Wind risk 8/10 · Major
- Chance of severe wind over 30 yrs
- 80.0%
Air-quality risk 1/10 · Minimal
- Unhealthy air days now
- 0 days/yr
- Unhealthy air days in 30 yrs
- 0 days/yr
Risk factors via First Street. Map © Google.
Why this score? — see what drove the B grade
The composite is a weighted blend of 9 inputs, each scored 0–100. Each bar is that input's sub-score; the figure is the points it added to the 100-point composite (weight × sub-score).
- Cash flow +26.4/30.0
- Appreciation +10.0/10.0
- ARV discount +9.1/15.0
- DSCR +9.0/10.0
- 1% rule +6.4/10.0
- Livability +3.6/5.0
- Schools +3.1/10.0
- Rent growth +2.5/5.0
- Condition / age +2.5/5.0
$140,000
🖨 Deal sheet 📄 Offer letter ✓ Due diligence
Listing remarks
Oversized corner lot with perfectly sized starter home ready to shine again! Property is priced to sell AS-IS. 3bd/2ba with original, working appliances and washer/dryer set that conveys. 2 large bedrooms and a smaller 3rd that would make a great office surround a large central living area and kitchen. The in-ground pool has not been filled for many years, but was once the centerpiece to an amazing entertaining space that also includes a large, paved patio with pergola. Small rocking chair front porch overlooks a large front yard that still feels private. Owner spent countless hours working to beautify the 2/3 of an acre, that includes several fruit trees, native plants, and a fully fenced
Key facts
- 0.64 acre lot
- Pool
- Built 2003
Property features AI
Finance
- Other: Lot approximately 0.64 acre; Located on a corner with county road frontage (private and public maintained road access)
- HOA & community: No homeowners association
Exterior
- Utilities: Public water; Septic tank
- Home design: Manufactured double-wide home; One story / single level
- Construction: Brick and vinyl siding exterior; Block foundation; Shingle roof; Built as a manufactured house (double wide)
- Exterior features: Back yard fencing; Gazebo; Pergola; In-ground pool with liner; Shingle roof; Block foundation
Interior
- Kitchen: Built-in electric range; Dishwasher; Refrigerator
- Bedrooms: 3 bedrooms (all on the main level)
- Flooring: Carpet; Laminate
- Bathrooms: 2 full bathrooms
- Heating & cooling: Heat pump heating; Central air conditioning; Ceiling fans
- Interior features: Built-in electric range; Dishwasher; Refrigerator
Neighborhood map
What this means for you Summary
Snapshot
- This is a 3-bed/3.0-bath manufactured listed at $140k.
Deal economics
- At list price, monthly cash flow is $365 ($4k/yr) — positive.
- The deal already cash-flows at list — no discount required.
- Meets the 1% rule at list price ($2k rent vs $140k).
- Cap rate 9.4% vs local median 4.3% in Stedman — top-decile yield for the area; either an underpriced asset or a hidden risk that comps aren't pricing in. Stress-test before assuming the spread holds.
Location & tenants
- Location reads 71/100 on livability (#107 in NC) — a middle-class / working-renter tenant base. Strengths: crime A+, employment A+, cost of living A+; Watch: amenities F, commute F, health & safety F.
- Cumberland County Schools (urban): math 32% / reading 41% proficiency, ranked #126 of 178 in NC (top 71%) — families likely to look elsewhere, expect single-tenant / working-renter base with shorter leases.
- Market conditions: 33 active listings in the ZIP; 1 comparable units currently listed for rent nearby; 1,125 units permitted in Cumberland County in 2024 (104 in 5+ unit buildings).
Forward outlook
- In year one you build about $15k of equity ($968 loan paydown + $14k appreciation (10.0% local appreciation)).
- At projected returns (10.0% appreciation + 3.0% rent growth), your $39k cash investment doubles in ~2 years — after that, you're playing with house money.
- By year 3, paydown + projected appreciation supports a ~$38k cash-out refi (75% LTV) — recoverable capital for the next deal without selling this one.
Negotiation context
- Only 2 days on market — expect competitive offers; lowballing is unlikely to land.
Risks & watch-outs
- Climate carrying-cost: severe wind risk, 80% chance of damaging wind over 30y; major wildfire risk; extreme-heat days projected 7→16/yr by 2055 (HVAC capex compounding) — expect insurance premiums to compound above CPI over the hold.
Questions for the listing agent
- Is there a deadline driving the sale (1031 exchange, divorce, estate, relocation)? That informs how much negotiation room exists.
- What's the average days-on-market for RENTAL listings here right now (not sales)? A rising rental-DOM trend means longer vacancies and softer asking-rent achievability than the comps imply.
- What's the recent tenant-quality profile in this submarket — average credit score on applications, eviction rate, late-payment / NSF rate, and stable-employment percentage? A property-management company in the area should have these aggregated.
- How much new for-sale + rental construction is in the pipeline within 1–3 miles? Heavy new supply typically softens prices + rents 12–24 months out; constrained supply supports both.
Investment metrics
- 1% rule
- 1.14% ✓
- Cap rate
- 9.42%
- Cash-on-cash
- 11.18%
- DSCR
- 1.50
- GRM
- 7.3
CMA / ARV
- ARV (on-the-fly)
- $145,314
- Comps found
- 5
Show comp detail 5 sales within ~0.75 mi
| Address | Dist | Beds/Ba | Sqft | Sold | Price | $/sf | Match |
|---|---|---|---|---|---|---|---|
| 5176 Maxwell Rd | 0.00mi | 3/2.0 | 1,240 (-0%) | 0mo | $140,000 | $113 | 96 |
| 640 Rockinghorse Ct | 0.23mi | 3/2.0 | 1,238 (-0%) | 19mo | $251,500 | $203 | 69 |
| 4921 Sand Mine Rd | 0.14mi | 3/2.0 | 1,188 (-4%) | 17mo | $100,000 | $84 | 68 |
| 460 Shelton Beard Rd | 0.30mi | 3/2.0 | 1,345 (+8%) | 5mo | $169,000 | $126 | 64 |
| 5031 High Branch Ct | 0.27mi | 3/2.0 | 1,399 (+13%) | 23mo | $164,000 | $117 | 43 |
Match score weights: distance 35% · size 25% · config 20% · recency 20%. Top-matched comps best support the ARV.
Projected returns pro-forma
10.0% appreciation · 3.0% rent growth · sell at horizon
- IRR
- 32.5%
- Equity multiple
- 3.54×
- Total profit
- $99,481
- Equity at exit
- $126,123
- IRR
- 28.0%
- Equity multiple
- 8.01×
- Total profit
- $274,635
- Equity at exit
- $271,989
Cash invested: $39,200 (down + closing). Projections, not guarantees.
Landlord ↔ Tenant lean methodology
- Overall (STATE)
- 85 Strongly Landlord-Friendly
- State North Carolina
- 85 Strongly Landlord-Friendly · R+3
- County
- — inherits STATE
- City
- — inherits STATE
ZIP-level market 28391
- Home prices YoY
- 16.1%
- Active inventory
- 33
- Price-to-rent
- 7.3×
Monthly cashflow live
- Estimated rent
- $1,600 medium interval (Pro) →
- Mortgage (P&I)
- −$734
- Tax from tax record
- −$106 /mo · $1,277/yr
- Insurance
- −$58
- HOA
- −$0
- Vacancy / Maint / Mgmt
- −$336
- Net cashflow
- $365
Break-even live
UW: 25.0% down · 7.5% · 30yr · 1.5% tax · 5.0% vac · 8.0% maint · 8.0% mgmt
Financing live
Cash to close
- Down payment
- $35,000
- Closing costs
- $4,200
- Reserves months
- —
- Total cash needed
- —
Loan-product check · same deal, 3 products live
Conventional
25% down · 7.5% · 30yr
- Down + closing
- —
- Monthly P&I
- —
- Monthly cashflow
- —
- DSCR
- —
- Eligible?
- —
Personal DTI + credit; lowest rate.
DSCR
20% down · 8.5% · 30yr
- Down + closing
- —
- Monthly P&I
- —
- Monthly cashflow
- —
- DSCR
- —
- Eligible?
- —
No personal income docs; deal must DSCR.
Hard money
10% down · 12.0% · 12mo
- Down + closing
- —
- Monthly P&I
- —
- Monthly cashflow
- —
- DSCR
- —
- Eligible?
- —
Short-term bridge; refi at stabilization.
Rent comps 1 comps
| Address | Beds | Baths | Sqft | Rent | $/sqft | DOM | Units | Dist |
|---|---|---|---|---|---|---|---|---|
| 470 Shelton Beard Rd Stedman, NC | 3.0 | 2.0 | 1296 | $1,600 | $1.23 | 13d | 1 | 0.27mi |
Listing history 3 events
-
2026-05-09status Pending
-
2026-05-08$140,000 Active
-
2026-04-11historical $140,000
ⓘ Source: listings_history table (triggers on properties + properties_extension) + one-shot
backfill from property_details.listing_events for pre-trigger history.
Tax reassessment forecast NC · Resets to sale price
- Current annual tax
- $1,277 · $106/mo
- Projected year-2 tax
- $1,277 · $106/mo
- Expected delta
- $0/yr ($0/mo · -0.0%)
ⓘ Screening estimate from a state-policy table — verify with the county assessor before closing.
Climate risk First Street
- Flood 3/10 Moderate FEMA zone X (unshaded) · 12% chance over 30 yrs
- Wildfire 6/10 Major
- Heat 7/10 Severe 7 d/yr ≥106°F today · 16 d/yr by 30 yrs out
- Wind 8/10 Severe 80% chance of damaging wind over 30 yrs
- Air quality 1/10 Low 0 unhealthy d/yr today · 0 by 30 yrs out
Nearby sold comps map
Loading sold comps map…
Walkable amenities ~0.75 mi
Loading nearby amenities…
Taxation est. · year 1
- Rental income
- $19,200
- − Mortgage interest
- −$7,842
- − Property taxes
- −$1,277
- − Insurance
- −$700
- − Repairs & maintenance
- −$1,536
- − Management
- −$1,536
- − Depreciation
- −$4,073
- Taxable income
- $2,236
- Est. tax owed @ 24.0%
- −$537
- After-tax cash flow
- $3,844/yr
For passive investors: Depreciation is non-cash, so a rental often shows a tax loss while cash-flowing — sheltering income. Rental losses are passive: they offset passive income freely, and up to $25,000/yr can offset ordinary (W-2) income if you actively participate and your MAGI is under $100k (phasing out to $0 by $150k); unused losses carry forward. On sale, claimed depreciation is recaptured at up to 25%, and gains may owe capital-gains tax (a 1031 exchange can defer both). Figures are a year-1 estimate at your 24.0% rate — not tax advice; consult a CPA.
Schools (NCES district)
- District
- Cumberland County Schools
- NCES district ID
- 3700011
- Math proficiency
- 32% ▼ -2.00%
- Reading proficiency
- 41% ▼ -1.00%
- Median HH income
- $44,168
- Composite
- 31.0/100
- National rank
- #6096
- State rank
- #126 of 178 in NC
Livability — Stedman
- Score
- 71/100
- State rank
- #107
- US rank
- #6799
Category grades
Schools grade is shown separately in the Schools card above.
Census & demographics
- Population (ZIP)
- 5,956
Population outlook (Cumberland County) Hauer SSP2
- Today (2025)
- 330,855 people
- By 2030
- 333,523 · +0.8%
- By 2040
- 335,583 · +1.4%
- By 2050
- 335,325 · +1.4%
- By 2075
- 342,853 · +3.6%
- By 2100
- 340,698 · +3.0%
Race, ethnicity, and origin ACS 2023
- Neighborhood character
- Predominantly White (77%)
- Race & ethnicity
- White 77% Black 12% Two or more races 7% Hispanic / Latino 2% Native American 2%
- Common ancestry
- Slovak 4% Serbian 2% Iranian 2%
- Foreign-born
- 2% · Canada
- Languages at home
- 98% English-only · Spanish 1%
Political lean MEDSL · Cumberland
- 2024 margin
- D (+13.4) · D 56.1% · R 42.7% · Other 1.2%
- 2008→2024 swing
- -4.3pp toward R · 2008: 17.7pp · 2024: 13.4pp
- All cycles
- 2024: D+13.4 2020: D+16.6 2016: D+16.0 2012: D+19.7 2008: D+17.7
Not yet ingested
- Civics
- —
Market trends
- HPI YoY
- ▲ 46.06%
- Current HPI
- 331.7099
- Rent YoY
- —
- Metro
- —
- State GDP YoY
- ▲ 3.28%
- F500 in state
- 26
Industry mix (Fortune 500 HQ in NC)
| Industry | F500 HQs | Revenue |
|---|---|---|
| Financial Services | 2 | $213B |
|
||
| Retail | 2 | $95B |
|
||
| Industrial Conglomerate | 1 | $38B |
|
||
| Metals / Steel | 1 | $35B |
|
||
| Utilities | 1 | $30B |
|
||
| Industrial Machinery | 1 | $19B |
|
||
Price history
+0.0% since first listed3 events — show timeline
- 2026-05-09 Pending — TMLS
- 2026-05-08 Listed $140,000 TMLS
- 2026-04-11 Coming Soon $140,000 TMLS
Property tax history
+5.6%/yrLatest (2025): $1,277 · +73.4% YoY. Source: county tax records.
Cash-flow waterfall
monthlySold comps — $/sqft
last 12 mo · ≤1 miLoading sold comps…