 Duplex
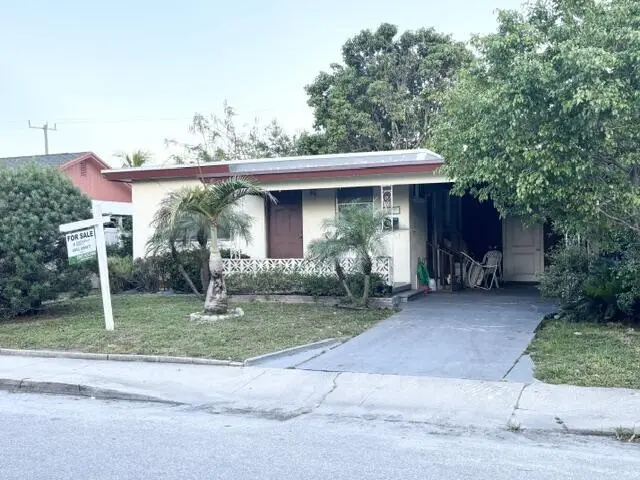
901 S F St · Lake Worth Beach, FL
Flood risk 4/10 · Minor
- FEMA flood zone
- X (unshaded)
- Chance of flooding over 30 yrs
- 0.22%
- Est. flood insurance / yr
- $507 – $1,088
Fire risk 1/10 · Minimal
- Est. fire insurance / yr
- $947 – $1,759
Heat risk 10/10 · Severe
- Hot days now (above 105°F)
- 7 days/yr
- Hot days in 30 yrs
- 27 days/yr
Wind risk 10/10 · Severe
- Chance of severe wind over 30 yrs
- 99.0%
Air-quality risk 2/10 · Minimal
- Unhealthy air days now
- 0 days/yr
- Unhealthy air days in 30 yrs
- 2 days/yr
Risk factors via First Street. Map © Google.
Why this score? — see what drove the C- grade
The composite is a weighted blend of 9 inputs, each scored 0–100. Each bar is that input's sub-score; the figure is the points it added to the 100-point composite (weight × sub-score).
- Cash flow +22.2/30.0
- ARV discount +7.5/15.0
- DSCR +7.1/10.0
- 1% rule +5.0/10.0
- Schools +4.3/10.0
- Rent growth +3.4/5.0
- Livability +2.5/5.0
- Condition / age +2.5/5.0
- Appreciation +0.0/10.0
$390,000
🖨 Deal sheet 📄 Offer letter ✓ Due diligence
Multi-family units
County records classify this as Multi-Family (2-4 Unit). Listing-text estimate: 2 units. confirmed
Listing remarks
Prime Lake Worth duplex offering amazing potential for investors or owner-occupants! This versatile property features a 3-Bedroom, 1 bath unit and a separate 1 Bedroom, 1 Bath Unit each with its own meters. With no rental restrictions, it's perfect for long-term tenants or short-term rentals. Located just 10 minutes from I-95 and downtown Lake Worth, and only 15 minutes from the iconic Lake Worth Pier. this property is nestled in a high-demand area. Enjoy the flexibility, convenience and income potential in one of South Florida's most vibrant communities!
Key facts
- Income potential
- Lake worth duplex
- High-demand area
Tags
Property features AI
Finance
- Financial info: Two total units; Gross income reported as $3,500; Net operating income reported as $6,000; Tenants pay cable TV, electricity and water; Pets allowed with no restrictions
Exterior
- Utilities: Public water; Public sewer; Three-phase electric; Cable available; Electricity available; Sewer available; Water available; Two separate electric meters
- Home design: Duplex; Single-story; Resale property
- Construction: Frame, wood siding and CBS construction; Built-up and tar/gravel roof; Total building area about 1,721; Living area about 1,252
- Exterior features: Shed(s); Fenced lot; Not waterfront
Interior
- Flooring: Carpet; Vinyl
- Heating & cooling: Window/wall heating; Wall/window cooling units
- Interior features: Carpet and vinyl flooring
Neighborhood map
What this means for you Summary
Snapshot
- This is a 1×3bd/1ba + 1×1bd/1ba units multifamily listed at $390k.
Deal economics
- At list price, monthly cash flow is $636 ($8k/yr) — positive. Per door: $318/mo.
- The deal already cash-flows at list — no discount required.
- Meets the 1% rule at list price ($4k rent vs $390k).
- Recommended offer: $378k (3.0% below list) — sets the bar for market timing.
Location & tenants
- Location reads: area grade C — affects rentability + tenant quality, not the cash-flow math above.
- Palm Beach (suburban): math 46% / reading 53% proficiency, ranked #34 of 73 in FL (top 47%) — families likely to look elsewhere, expect single-tenant / working-renter base with shorter leases.
- Zoned schools: Barton Elementary School (math 25% / reading 20%, grade F, #2,073 of 2,144 statewide, top 97%, 1,064 students, 80% FRL); Lake Worth Community Middle (math 17% / reading 23%, grade F, #558 of 571 statewide, top 98%, 1,249 students, 75% FRL); Lake Worth High School (math 16% / reading 27%, grade F, #546 of 667 statewide, top 82%, 2,683 students, 71% FRL) — zoned schools average 75% FRL vs 52% district-wide (23 pts higher); higher-poverty schools than district average — tighter screening recommended.
- Zoned-school proficiency averages 21% at this address vs 50% district-wide (-28 pts) — the specific schools serving this property underperform the Palm Beach average; the district grade overstates school quality for this exact location.
- Market conditions: Rents rising (+3.5%/yr); 249 active listings in the ZIP; 40 comparable units currently listed for rent nearby; rentals at typical pace (median 19d on market — plan ~3-4 weeks tenant-placement turnaround); 3,974 units permitted in Palm Beach County in 2024 (1,012 in 5+ unit buildings).
- At $3,900/mo this rent would consume 75% of the median local household income ($62k/yr) (locally 2429% of renters already pay >50% of income on rent) — very limited rent-growth headroom before tenants either downsize or default.
Forward outlook
- Local home prices are declining (-3.0%/yr); year-one equity from $3k of loan paydown is wiped out by about $12k of value loss. Plan a longer hold.
- Palm Beach County population projected at +30% by 2050 — long-run rental-demand tailwind backs the buy-and-hold thesis.
Negotiation context
- It's been on market 33 days — a 3% lower offer ($378k) is reasonable based on typical stale-listing flexibility.
- 3 sale attempts with the ask held roughly flat each time — persistent listings suggest the price (not the market) is what's stuck; bring a comps-based counter.
- Current owner paid $45k; list at $390k implies a 767% gain — meaningful room to come down on a strong offer.
Risks & watch-outs
- Watch-outs: built in 1958 — expect roof / HVAC / electrical / plumbing capex.
- Climate carrying-cost: severe wind risk, 99% chance of damaging wind over 30y; extreme-heat days projected 7→27/yr by 2055 (HVAC capex compounding) — expect insurance premiums to compound above CPI over the hold.
Questions for the listing agent
- It's been on market 33 days. Have you received any prior offers? Is the seller open to a 3% concession, seller financing, or rate buy-down credit?
- Can we see the unit-by-unit rent roll, current vacancy, and any below-market leases? What's the average tenancy length?
- What capital expenditures (roof, boiler, parking lot, exteriors) have been made in the last 5 years, and what's planned in the next 2?
- Built in 1958 — when were the roof, HVAC, electrical panel, plumbing, and water heater last replaced?
- Is there a deadline driving the sale (1031 exchange, divorce, estate, relocation)? That informs how much negotiation room exists.
- What's the average days-on-market for RENTAL listings here right now (not sales)? A rising rental-DOM trend means longer vacancies and softer asking-rent achievability than the comps imply.
- What's the recent tenant-quality profile in this submarket — average credit score on applications, eviction rate, late-payment / NSF rate, and stable-employment percentage? A property-management company in the area should have these aggregated.
- How much new apartment / multifamily construction is in the pipeline within 1–3 miles? Heavy new supply (>2% of stock underway) typically softens rents 12–24 months out; light construction supports rent growth.
Investment metrics
- 1% rule
- 1.00% ✓
- Cap rate
- 8.25%
- Cash-on-cash
- 6.99%
- DSCR
- 1.31
- GRM
- 8.3
CMA / ARV
No comps found within radius.
Projected returns pro-forma
-3.0% appreciation · 3.53% rent growth · sell at horizon
- IRR
- -5.1%
- Equity multiple
- 0.81×
- Total profit
- $-20,670
- Equity at exit
- $58,150
- IRR
- 5.2%
- Equity multiple
- 1.39×
- Total profit
- $42,476
- Equity at exit
- $33,720
Cash invested: $109,200 (down + closing). Projections, not guarantees.
Landlord ↔ Tenant lean methodology
- Overall (STATE)
- 87 Strongly Landlord-Friendly
- State Florida
- 87 Strongly Landlord-Friendly · R+3
- County
- — inherits STATE
- City
- — inherits STATE
ZIP-level market 33460
- Rents YoY
- 3.5%
- Active inventory
- 249
- Price-to-rent
- 14.7×
Monthly cashflow live
- Estimated rent
- $3,900 high interval (Pro) →
- Mortgage (P&I)
- −$2,045
- Tax from tax record
- −$237 /mo · $2,843/yr
- Insurance
- −$162
- HOA
- −$0
- Vacancy / Maint / Mgmt
- −$819
- Net cashflow
- $636
Break-even live
2-unit breakdown (identical units grouped — click to expand)
| Units | Beds | Baths | Est. rent |
|---|---|---|---|
| 1× unit | 3 | 1 | $2,218 |
| 1× unit | 1 | 1 | $1,682 |
| Total (2 units) | $3,900 | ||
UW: 25.0% down · 7.5% · 30yr · 1.5% tax · 5.0% vac · 8.0% maint · 8.0% mgmt
Financing live
Cash to close
- Down payment
- $97,500
- Closing costs
- $11,700
- Reserves months
- —
- Total cash needed
- —
Loan-product check · same deal, 3 products live
Conventional
25% down · 7.5% · 30yr
- Down + closing
- —
- Monthly P&I
- —
- Monthly cashflow
- —
- DSCR
- —
- Eligible?
- —
Personal DTI + credit; lowest rate.
DSCR
20% down · 8.5% · 30yr
- Down + closing
- —
- Monthly P&I
- —
- Monthly cashflow
- —
- DSCR
- —
- Eligible?
- —
No personal income docs; deal must DSCR.
Hard money
10% down · 12.0% · 12mo
- Down + closing
- —
- Monthly P&I
- —
- Monthly cashflow
- —
- DSCR
- —
- Eligible?
- —
Short-term bridge; refi at stabilization.
Rent comps 40 comps
| Address | Beds | Baths | Sqft | Rent | $/sqft | DOM | Units | Dist |
|---|---|---|---|---|---|---|---|---|
| 911 S D St Lake Worth Beach, FL | 2.0 | 2.0 | 1023 | $2,300 | $2.25 | 18d | 1 | 0.12mi |
| 701 S G St Lake Worth, FL | 3.0 | 1.0 | 1000 | $2,995 | $3.00 | 24d | 1 | 0.15mi |
| 701 S G St Unit 5 Lake Worth Beach, FL | 3.0 | 1.0 | 1000 | $2,495 | $2.50 | 24d | 1 | 0.15mi |
| 701 S G St Unit 7 Lake Worth Beach, FL | 3.0 | 1.0 | 1000 | $2,680 | $2.68 | 24d | 1 | 0.15mi |
| 911 S B St Lake Worth Beach, FL | 3.0 | 1.5 | 1140 | $2,800 | $2.46 | 24d | 1 | 0.24mi |
| 1029 S C St Lake Worth Beach, FL | 3.0 | 3.0 | 1502 | $3,000 | $2.00 | 24d | 1 | 0.24mi |
| 1015 S K St #1 Lake Worth, FL | 1.0 | 1.0 | 1160 | $1,850 | $1.59 | 18d | 1 | 0.31mi |
| 507 S D St Bldg 2 Lake Worth Beach, FL | 3.0 | 2.0 | 1012 | $2,200 | $2.17 | 24d | 1 | 0.34mi |
| 905 S L St Lake Worth Beach, FL | 2.0 | 1.0 | 893 | $3,300 | $3.70 | 2d | 1 | 0.35mi |
| 644 S Ridge St Lake Worth Beach, FL | 2.0 | 1.0 | 1000 | $2,500 | $2.50 | 24d | 1 | 0.44mi |
| 419 S J St Unit C Lake Worth Beach, FL | 2.0 | 1.0 | 1200 | $1,295 | $1.08 | 13d | 1 | 0.45mi |
| 419 S J St Unit C Lake Worth Beach, FL | 2.0 | 1.0 | 1200 | $1,295 | $1.08 | 12d | 1 | 0.45mi |
| 727 S N St Lake Worth Beach, FL | 3.0 | 1.0 | 1017 | $3,000 | $2.95 | 24d | 1 | 0.48mi |
| 1021 S N St Lake Worth Beach, FL | 3.0 | 3.0 | 1244 | $3,800 | $3.05 | 20d | 1 | 0.48mi |
| 713 S N St Lake Worth Beach, FL | 2.0 | 2.0 | 1116 | $2,390 | $2.14 | 24d | 1 | 0.48mi |
| 1122 S N St Lake Worth Beach, FL | 3.0 | 3.0 | 1845 | $11,500 | $6.23 | 13d | 1 | 0.54mi |
| 416 S L St Lake Worth, FL | 2.0 | 1.0 | 950 | $2,700 | $2.84 | 24d | 1 | 0.55mi |
| 414 S L St Lake Worth Beach, FL | 2.0 | 1.0 | 950 | $2,350 | $2.47 | 24d | 1 | 0.56mi |
| 531 S Federal Hwy #14 Lake Worth Beach, FL | 3.0 | 3.5 | 1727 | $3,099 | $1.79 | 24d | 1 | 0.56mi |
| 327 S L St Lake Worth Beach, FL | 3.0 | 2.0 | 936 | $3,000 | $3.21 | 24d | 1 | 0.58mi |
| 1420 Barton Rd Unit 1420w Lake Worth Beach, FL | 2.0 | 1.0 | 990 | $2,000 | $2.02 | 10d | 1 | 0.59mi |
| 206 S C St Lake Worth Beach, FL | 3.0 | 1.0 | 1000 | $2,500 | $2.50 | 24d | 1 | 0.59mi |
| 1301 S Federal Hwy #4 Lake Worth Beach, FL | 3.0 | 2.5 | 1823 | $2,800 | $1.54 | 13d | 1 | 0.62mi |
| 1301 S Federal Hwy #4 Lake Worth Beach, FL | 3.0 | 2.5 | 1823 | $3,300 | $1.81 | 16d | 1 | 0.62mi |
| 314 S L St Lake Worth Beach, FL | 3.0 | 1.0 | 1094 | $3,000 | $2.74 | 12d | 1 | 0.62mi |
| 1331 S Federal Hwy Lake Worth, FL | 2.0 | 2.0 | 1011 | $2,099 | $2.08 | 10d | 1 | 0.65mi |
| 1331 S Federal Hwy Lake Worth, FL | 2.0 | 2.0 | 1011 | $2,099 | $2.08 | 24d | 1 | 0.65mi |
| 1512 Barton Rd Unit A Lake Worth Beach, FL | 2.0 | 1.0 | 1710 | $1,800 | $1.05 | 3d | 1 | 0.67mi |
| 105 S D St Lake Worth Beach, FL | 3.0 | 2.0 | 1326 | $3,150 | $2.38 | 11d | 1 | 0.67mi |
| 105 S D St Lake Worth Beach, FL | 3.0 | 2.0 | 1326 | $3,300 | $2.49 | 24d | 1 | 0.67mi |
| 221 S M St Lake Worth Beach, FL | 3.0 | 2.0 | 1164 | $3,450 | $2.96 | 14d | 1 | 0.69mi |
| 112 S J St Lake Worth Beach, FL | 1.0 | 2.0 | 988 | $3,000 | $3.04 | 18d | 1 | 0.70mi |
| 204 S M St Unit Upstairs Unit Lake Worth Beach, FL | 3.0 | 1.0 | 1386 | $3,500 | $2.53 | 15d | 1 | 0.74mi |
| 224 S Federal Hwy #4 Lake Worth Beach, FL | 3.0 | 2.5 | 1640 | $3,200 | $1.95 | 10d | 1 | 0.75mi |
| 647 Latona Ave Lake Worth Beach, FL | 3.0 | 2.0 | 1609 | $2,800 | $1.74 | 24d | 1 | 0.75mi |
| 101 S East Coast St Lake Worth Beach, FL | 2.0 | 2.0 | 1029 | $2,500 | $2.43 | 16d | 1 | 0.75mi |
| 215 S Ocean Breeze Lake Worth Beach, FL | 2.0 | 2.0 | 1000 | $2,385 | $2.38 | 4d | 1 | 0.78mi |
| 702 Grove St Lake Worth Beach, FL | 3.0 | 2.0 | 1812 | $5,500 | $3.04 | 24d | 1 | 0.78mi |
| 216 Ocean Breeze Unit Upstairs Lake Worth Beach, FL | 2.0 | 1.0 | 958 | $2,250 | $2.35 | 2d | 1 | 0.80mi |
| 2022 Collier Ave Lake Worth, FL | 3.0 | 2.0 | 1512 | $3,500 | $2.31 | 10d | 1 | 0.83mi |
Listing history 21 events
-
2026-06-17status $390,000 Pending 33 DOM
-
2026-06-16days on market $390,000 Active 33 DOM
-
2026-06-15days on market $390,000 Active 32 DOM
-
2026-06-13days on market $390,000 Active 30 DOM
-
2026-06-09days on market $390,000 Active 26 DOM
-
2026-06-08days on market $390,000 Active 25 DOM
-
2026-06-07days on market $390,000 Active 24 DOM
-
2026-06-04days on market $390,000 Active 21 DOM
-
2026-06-03days on market $390,000 Active 20 DOM
-
2026-06-02days on market $390,000 Active 19 DOM
-
2026-06-01days on market $390,000 Active 18 DOM
-
2026-05-31days on market $390,000 Active 17 DOM
-
2026-05-14$410,000 Active
-
2025-08-19historical
-
2025-07-30price $405,000
-
2025-06-20status Active
-
2025-06-13status Pending
-
2025-06-06price $450,000
-
2025-04-23$490,000 Active
-
1986-12-01soldstatus $45,000
-
1982-12-01soldstatus $52,500
ⓘ Source: listings_history table (triggers on properties + properties_extension) + one-shot
backfill from property_details.listing_events for pre-trigger history.
Tax reassessment forecast FL · Resets to sale price
- Current annual tax
- $2,843 · $237/mo
- Projected year-2 tax
- $3,237 · $270/mo
- Expected delta
- +$394/yr (+$33/mo · 13.9%)
ⓘ Screening estimate from a state-policy table — verify with the county assessor before closing.
Climate risk First Street
- Flood 4/10 Moderate FEMA zone X (unshaded) · 22% chance over 30 yrs
- Wildfire 1/10 Low
- Heat 10/10 Extreme 7 d/yr ≥105°F today · 27 d/yr by 30 yrs out
- Wind 10/10 Extreme 99% chance of damaging wind over 30 yrs
- Air quality 2/10 Low 0 unhealthy d/yr today · 2 by 30 yrs out
Nearby sold comps map
Loading sold comps map…
Walkable amenities ~0.75 mi
Loading nearby amenities…
Taxation est. · year 1
- Rental income
- $46,800
- − Mortgage interest
- −$21,846
- − Property taxes
- −$2,843
- − Insurance
- −$1,950
- − Repairs & maintenance
- −$3,744
- − Management
- −$3,744
- − Depreciation
- −$11,345
- Taxable income
- $1,327
- Est. tax owed @ 24.0%
- −$319
- After-tax cash flow
- $7,318/yr
For passive investors: Depreciation is non-cash, so a rental often shows a tax loss while cash-flowing — sheltering income. Rental losses are passive: they offset passive income freely, and up to $25,000/yr can offset ordinary (W-2) income if you actively participate and your MAGI is under $100k (phasing out to $0 by $150k); unused losses carry forward. On sale, claimed depreciation is recaptured at up to 25%, and gains may owe capital-gains tax (a 1031 exchange can defer both). Figures are a year-1 estimate at your 24.0% rate — not tax advice; consult a CPA.
Schools (NCES district)
- District
- Palm Beach
- NCES district ID
- 1201500
- Math proficiency
- 46% ▼ -16.00%
- Reading proficiency
- 53% ▼ -4.00%
- Median HH income
- $53,943
- Composite
- 42.72/100
- National rank
- #3160
- State rank
- #34 of 73 in FL
Livability — Lake Worth Beach
No livability data for this city. (Only ~50 U.S. cities are tracked.)
Census & demographics
- Census place
- Lake Worth Beach, FL
- County
- Palm Beach County · 1,438,312 people
- City population
- 129,577
- Metro
- Miami-Fort Lauderdale-Pompano Beach, FL
- Population (ZIP)
- 37,795
- Household income
- $62,090
- Rent vs Own
- Severe rent burden
- 2429.0
Population outlook (Palm Beach County) Hauer SSP2
- Today (2025)
- 1,637,487 people
- By 2030
- 1,743,255 · +6.5%
- By 2040
- 1,948,712 · +19.0%
- By 2050
- 2,132,979 · +30.3%
- By 2075
- 2,530,027 · +54.5%
- By 2100
- 2,706,979 · +65.3%
Race, ethnicity, and origin ACS 2023
- Neighborhood character
- Diverse neighborhood (Simpson 0.64)
- Race & ethnicity
- Hispanic / Latino 49% White 30% Two or more races 21% Black 17%
- Hispanic origin (detail)
- Mexican 5% Puerto Rican 5% Cuban 5% Dominican 2%
- Common ancestry
- Hispanic 8% Lithuanian 2% Slovak 1%
- Foreign-born
- 40% · Canada, Jamaica
- Languages at home
- 44% English-only · Spanish 42% French/Haitian/Cajun 9% Other Indo-European 2%
Political lean MEDSL · Palm Beach
- 2024 margin
- Toss-up / Even · D 50.0% · R 49.2%
- 2008→2024 swing
- -22.1pp toward R · 2008: 22.9pp · 2024: 0.8pp
- All cycles
- 2024: D+0.8 2020: D+12.8 2016: D+15.3 2012: D+17.0 2008: D+22.9
Not yet ingested
- Civics
- —
Market trends
- HPI YoY
- ▼ -345.65%
- Current HPI
- 484.2793
- Rent YoY
- ▲ 3.53%
- Metro
- Miami-Fort Lauderdale-Pompano Beach, FL
- State GDP YoY
- ▲ 3.28%
- F500 in state
- 36
Industry mix (Fortune 500 HQ in FL)
| Industry | F500 HQs | Revenue |
|---|---|---|
| Industrial Technology | 2 | $29B |
|
||
| Insurance | 2 | $17B |
|
||
| Retail | 1 | $60B |
|
||
| Technology Distribution | 1 | $58B |
|
||
| Homebuilding | 1 | $35B |
|
||
| Technology Manufacturing | 1 | $35B |
|
||
Price history
+681.0% since first listed9 events — show timeline
- 2026-05-14 Listed $410,000 Beaches MLS
- 2025-08-19 Listing Removed — Beaches MLS
- 2025-07-30 Price Changed $405,000 Beaches MLS
- 2025-06-20 Relisted — Beaches MLS
- 2025-06-13 Pending — Beaches MLS
- 2025-06-06 Price Changed $450,000 Beaches MLS
- 2025-04-23 Listed $490,000 Beaches MLS
- 1986-12-01 Sold (Public Records) $45,000 Public Records
- 1982-12-01 Sold (Public Records) $52,500 Public Records
Property tax history
+5.9%/yrLatest (2025): $2,843 · +7.3% YoY. Source: county tax records.
Cash-flow waterfall
monthlySold comps — $/sqft
last 12 mo · ≤1 miLoading sold comps…