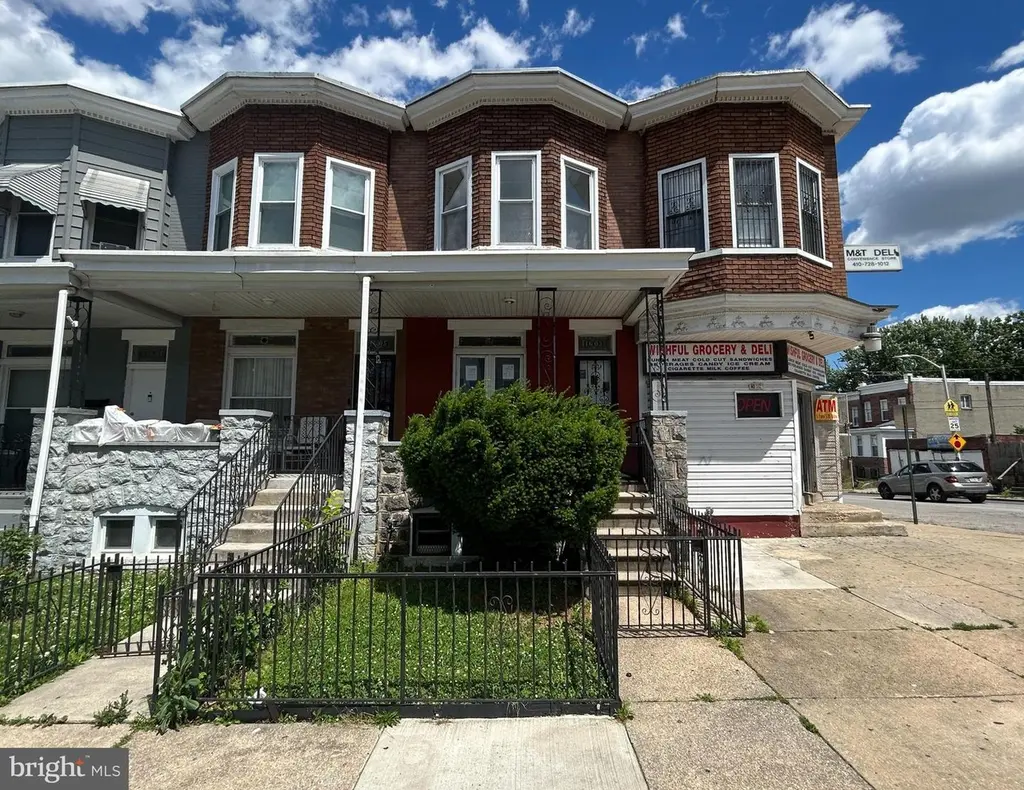
1603 N Smallwood St · Baltimore, MD
Flood risk 1/10 · Minimal
- FEMA flood zone
- X (unshaded)
- Chance of flooding over 30 yrs
- 0.0%
- Est. flood insurance / yr
- $473 – $860
Fire risk 1/10 · Minimal
- Est. fire insurance / yr
- $755 – $1,403
Heat risk 7/10 · Major
- Hot days now (above 103°F)
- 7 days/yr
- Hot days in 30 yrs
- 15 days/yr
Wind risk 6/10 · Moderate
- Chance of severe wind over 30 yrs
- 27.0%
Air-quality risk 3/10 · Minor
- Unhealthy air days now
- 3 days/yr
- Unhealthy air days in 30 yrs
- 4 days/yr
Risk factors via First Street. Map © Google.
Why this score? — see what drove the C+ grade
The composite is a weighted blend of 9 inputs, each scored 0–100. Each bar is that input's sub-score; the figure is the points it added to the 100-point composite (weight × sub-score).
- Cash flow +30.0/30.0
- 1% rule +10.0/10.0
- DSCR +10.0/10.0
- Rent growth +4.0/5.0
- Livability +3.8/5.0
- Condition / age +2.5/5.0
- Schools +1.0/10.0
- ARV discount +0.0/15.0
- Appreciation +0.0/10.0
$98,000
🖨 Deal sheet (PDF) 📄 Offer letter ✓ Due diligence
Listing remarks
HUD Owned Home, case number 241-774850. HUD Homes are sold "as is, " FHA insurable with repair escrow, subject to appraisal. This colonial townhouse, built in 1915, seamlessly blends historic style with modern comforts. Step inside to discover a thoughtfully designed open floor plan that invites natural light to dance across the carpeting and tile flooring. The eat-in kitchen equipped with custom-made wood cabinet & appliances is a culinary delight, featuring ample counter space and a layout that encourages creativity. The main level also features a convenient half bath, enhancing functionality for guests. Upstairs, two well-appointed bedrooms provide a serene retreat, compl
Key facts
- Open floor plan
- Half bath
- Eat-in kitchen
Tags
Property features AI
Finance
- Other: Fee simple ownership
- HOA & community: Ground rent paid annually
Exterior
- Parking: On-street parking
- Utilities: Public water; Public sewer; Hot water from 60+ gallon tank (natural gas); Heating fuel: oil and other; Cooling fuel: electric
- Home design: Interior townhouse/rowhouse; Level entry to main floor; Brick exterior with brick front
- Construction: Concrete perimeter foundation; Permanent foundation; Above-grade structures
- Exterior features: Front yard; Rear yard; Rear fencing; Deck(s); Porch(es); Sidewalks; Street lights
Interior
- Kitchen: Eat-in kitchen
- Bedrooms: Two bedrooms on the first upper level
- Flooring: Carpet; Ceramic tile
- Bathrooms: One full bathroom; One half bathroom
- Heating & cooling: Radiator heating; Ceiling fan cooling
- Interior features: Open floor plan; Eat-in kitchen; Dining area; Bar; Tub with shower; Ceiling fan(s); Drywall, paneled, plaster and wood wall finishes
- Laundry & utility: Laundry room
Neighborhood map
What this means for you Summary
Snapshot
- This is a 2-bed/1.5-bath townhouse listed at $98k.
Deal economics
- At list price, monthly cash flow is $582 ($7k/yr) — positive.
- The deal already cash-flows at list — no discount required.
- Meets the 1% rule at list price ($2k rent vs $98k).
- Recommended offer: $97k (1.5% below list) — sets the bar for market timing.
- Cap rate 13.4% vs local median 6.0% in Baltimore — top-decile yield for the area; either an underpriced asset or a hidden risk that comps aren't pricing in. Stress-test before assuming the spread holds.
Location & tenants
- Location reads 76/100 on livability (#90 in MD, #3,396 nationally) — a middle-class / working-renter tenant base. Strengths: amenities A+, commute A+, housing A+; Watch: schools D, crime F.
- Baltimore City Public Schools (urban): math 7% / reading 16% proficiency, ranked #24 of 24 in MD (top 100%) — low school quality limits family demand, transient renter base, plan for 1-2y turnover; 79% free/reduced lunch — lower-income household profile, screen leases tightly.
- Market conditions: Rents rising fast (+6.1%/yr); 252 active listings in the ZIP; 40 comparable units currently listed for rent nearby; rentals at typical pace (median 25d on market — plan ~3-4 weeks tenant-placement turnaround); 45% of comp listings sitting > 30 days — soft ceiling on asking rent; lower-income renter base — watch delinquency; 1,273 units permitted in Baltimore city in 2024 (1,104 in 5+ unit buildings).
- This rent runs 44% of the median local income ($42k/yr) — at the standard rent-burdened threshold; future hikes will face affordability resistance.
Forward outlook
- Local home prices are declining (-3.0%/yr); year-one equity from $678 of loan paydown is wiped out by about $3k of value loss. Plan a longer hold.
- Baltimore County population projected to shrink 4% by 2050 — rents likely to lag national; underwrite the cash flow, not the appreciation.
- At projected returns (-3.0% appreciation + 6.1% rent growth), your $27k cash investment doubles in ~5 years — after that, you're playing with house money.
Negotiation context
- It's been on market 19 days — a 2% lower offer ($97k) is reasonable based on typical stale-listing flexibility.
Risks & watch-outs
- Watch-outs: built in 1915 — expect roof / HVAC / electrical / plumbing capex.
- Climate carrying-cost: major wind risk, 27% chance of damaging wind over 30y; extreme-heat days projected 7→15/yr by 2055 (HVAC capex compounding) — expect insurance premiums to compound above CPI over the hold.
Questions for the listing agent
- Built in 1915 — when were the roof, HVAC, electrical panel, plumbing, and water heater last replaced?
- Is there a deadline driving the sale (1031 exchange, divorce, estate, relocation)? That informs how much negotiation room exists.
- Schools are D-rated, which usually means shorter tenancies and higher turnover. Who's the typical renter profile here, and what's been the actual vacancy rate?
- Crime grade is F in this area — have there been break-ins, vandalism, or insurance claims at this property in the last 3 years? What carrier currently insures it and at what premium?
- What's the average days-on-market for RENTAL listings here right now (not sales)? A rising rental-DOM trend means longer vacancies and softer asking-rent achievability than the comps imply.
- What's the recent tenant-quality profile in this submarket — average credit score on applications, eviction rate, late-payment / NSF rate, and stable-employment percentage? A property-management company in the area should have these aggregated.
- How much new for-sale + rental construction is in the pipeline within 1–3 miles? Heavy new supply typically softens prices + rents 12–24 months out; constrained supply supports both.
Investment metrics
- 1% rule
- 1.57% ✓
- Cap rate
- 13.42%
- Cash-on-cash
- 25.46%
- DSCR
- 2.13
- GRM
- 5.3
CMA / ARV
- ARV (on-the-fly)
- $75,900
- Comps found
- 12
Show comp detail 12 sales within ~0.75 mi
| Address | Dist | Beds/Ba | Sqft | Sold | Price | $/sf | Match |
|---|---|---|---|---|---|---|---|
| 1541 N Pulaski St | 0.08mi | 3/1.0 (+1) | 1,100 (0%) | 3mo | $115,000 | $105 | 87 |
| 1705 N Payson St | 0.17mi | 3/1.5 (+1) | 1,100 (0%) | 5mo | $38,000 | $35 | 83 |
| 1537 N Smallwood St | 0.03mi | 3/1.5 (+1) | 1,200 (+9%) | 3mo | $56,000 | $47 | 76 |
| 1552 N Fulton Ave | 0.31mi | 3/1.0 (+1) | 1,113 (+1%) | 4mo | $125,000 | $112 | 73 |
| 1603 Clifton Ave | 0.52mi | 3/1.0 (+1) | 1,100 (0%) | 2mo | $130,000 | $118 | 67 |
| 2109 N Fulton Ave N | 0.51mi | 3/1.0 (+1) | 1,100 (0%) | 4mo | $35,000 | $32 | 66 |
| 2727 Baker St | 0.51mi | 3/1.0 (+1) | 1,116 (+2%) | 3mo | $125,000 | $112 | 64 |
| 2418 Etting St | 0.67mi | 2/1.0 | 1,080 (-2%) | 4mo | $53,500 | $50 | 61 |
| 2210 Ashburton St | 0.70mi | 2/1.0 | 1,024 (-7%) | 2mo | $90,000 | $88 | 52 |
| 2801 Presbury St | 0.63mi | 3/1.0 (+1) | 1,200 (+9%) | 4mo | $60,000 | $50 | 46 |
| 2820 Woodbrook Ave | 0.62mi | 3/1.5 (+1) | 1,232 (+12%) | 2mo | $85,000 | $69 | 44 |
| 2818 Woodbrook Ave | 0.62mi | 3/1.0 (+1) | 1,232 (+12%) | 3mo | $45,500 | $37 | 41 |
Match score weights: distance 35% · size 25% · config 20% · recency 20%. Top-matched comps best support the ARV.
Projected returns pro-forma
-3.0% appreciation · 6.1% rent growth · sell at horizon
- IRR
- 22.4%
- Equity multiple
- 1.95×
- Total profit
- $26,137
- Equity at exit
- $14,612
- IRR
- 32.3%
- Equity multiple
- 4.36×
- Total profit
- $92,091
- Equity at exit
- $8,473
Cash invested: $27,440 (down + closing). Projections, not guarantees.
Landlord ↔ Tenant lean methodology
- Overall (CITY)
- 12 Strongly Tenant-Friendly
- State Maryland
- 27 Tenant-Leaning · D+14
- County
- — inherits STATE
- City Baltimore
- 12 Strongly Tenant-Friendly · D+58
ZIP-level market 21216
- Rents YoY
- 6.1%
- Active inventory
- 252
- Price-to-rent
- 5.3×
Monthly cashflow live
- Estimated rent
- $1,536 high interval (Pro) →
- Mortgage (P&I)
- −$514
- Tax from tax record
- −$76 /mo · $916/yr
- Insurance
- −$41
- HOA
- −$0
- Vacancy / Maint / Mgmt
- −$323
- Net cashflow
- $582
Break-even live
Sensitivity live
| Price | -10% $638 | -5% $610 | +0% $582 | +5% $555 | +10% $527 |
|---|---|---|---|---|---|
| Rent | -10% $461 | -5% $522 | +0% $582 | +5% $643 | +10% $704 |
| Rate | -1.0pp $632 | -0.5pp $607 | base $582 | +0.5pp $557 | +1.0pp $531 |
UW: 25.0% down · 7.5% · 30yr · 1.5% tax · 5.0% vac · 8.0% maint · 8.0% mgmt
Financing live
Cash to close
- Down payment
- $24,500
- Closing costs
- $2,940
- Reserves months
- —
- Total cash needed
- —
Loan-product check · same deal, 3 products live
Conventional
25% down · 7.5% · 30yr
- Down + closing
- —
- Monthly P&I
- —
- Monthly cashflow
- —
- DSCR
- —
- Eligible?
- —
Personal DTI + credit; lowest rate.
DSCR
20% down · 8.5% · 30yr
- Down + closing
- —
- Monthly P&I
- —
- Monthly cashflow
- —
- DSCR
- —
- Eligible?
- —
No personal income docs; deal must DSCR.
Hard money
10% down · 12.0% · 12mo
- Down + closing
- —
- Monthly P&I
- —
- Monthly cashflow
- —
- DSCR
- —
- Eligible?
- —
Short-term bridge; refi at stabilization.
Rent comps 40 comps
| Address | Beds | Baths | Sqft | Rent | $/sqft | DOM | Units | Dist |
|---|---|---|---|---|---|---|---|---|
| 1501 N Payson St Baltimore, MD | 3.0 | 1.0 | 1400 | $1,550 | $1.11 | 44d | 1 | 0.18mi |
| 1816 N Bentalou St Baltimore, MD | 3.0 | 2.0 | 1350 | $1,700 | $1.26 | 24d | 1 | 0.19mi |
| 1816 N Bentalou St Baltimore, MD | 3.0 | 2.0 | 1350 | $1,700 | $1.26 | 11d | 1 | 0.19mi |
| 1617 Moreland Ave Baltimore, MD | 2.0 | 1.0 | 900 | $1,450 | $1.61 | 24d | 1 | 0.19mi |
| 1617-A Moreland Ave Unit 2nd Flr Baltimore, MD | 2.0 | 1.0 | 1500 | $1,400 | $0.93 | 44d | 1 | 0.21mi |
| 1722 N Monroe St Baltimore, MD | 3.0 | 1.5 | 1000 | $1,350 | $1.35 | 24d | 1 | 0.22mi |
| 1930 N Payson St Baltimore, MD | 2.0 | 2.0 | 980 | $1,500 | $1.53 | 24d | 1 | 0.27mi |
| 1729 N Fulton Ave Baltimore, MD | 3.0 | 2.0 | 1081 | $1,795 | $1.66 | 44d | 1 | 0.34mi |
| 2204 Clifton Ave Baltimore, MD | 3.0 | 1.0 | 1400 | $1,450 | $1.04 | 5d | 1 | 0.35mi |
| 1433 N Fulton Ave Baltimore, MD | 2.0 | 1.0 | 1200 | $1,500 | $1.25 | 44d | 1 | 0.36mi |
| 1806 N Mount St Baltimore, MD | 3.0 | 3.0 | 1200 | $1,700 | $1.42 | 20d | 1 | 0.39mi |
| 1624 Westwood Ave Baltimore, MD | 3.0 | 2.0 | 1000 | $1,900 | $1.90 | 44d | 1 | 0.44mi |
| 2301 Riggs Ave Baltimore, MD | 3.0 | 2.0 | 1072 | $1,600 | $1.49 | 24d | 1 | 0.46mi |
| 1614 N Calhoun St Baltimore, MD | 2.0 | 1.0 | 950 | $1,300 | $1.37 | 44d | 1 | 0.49mi |
| 2636 W North Ave Baltimore, MD | 2.0–3.0 | 1.0–2.0 | 975 | $1,300 | $1.33 | 5d | 1 | 0.50mi |
| 2614 Pennsylvania Ave Baltimore, MD | 1.0–3.0 | 1.0–2.0 | 982 | $876 | $0.89 | 5d | 4 | 0.50mi |
| 2636 Pennsylvania Ave Baltimore, MD | 1.0–2.0 | 1.0 | 846 | $956 | $1.13 | 24d | 4 | 0.51mi |
| 1534 N Stricker St Baltimore, MD | 2.0 | 1.5 | 900 | $1,475 | $1.64 | 15d | 1 | 0.53mi |
| 918 N Bentalou St Baltimore, MD | 3.0 | 1.5 | 1485 | $1,750 | $1.18 | 44d | 1 | 0.55mi |
| 1562 N Woodyear St Baltimore, MD | 2.0 | 1.5 | 788 | $1,325 | $1.68 | 24d | 1 | 0.56mi |
| 1515 Retreat St Baltimore, MD | 3.0 | 2.0 | 1098 | $1,800 | $1.64 | 24d | 1 | 0.62mi |
| 519 Sanford Pl Baltimore, MD | 3.0 | 1.0 | 1300 | $1,650 | $1.27 | 17d | 1 | 0.64mi |
| 2231 Orem Ave Baltimore, MD | 3.0 | 1.5 | 1140 | $1,750 | $1.54 | 18d | 1 | 0.65mi |
| 1507 Retreat St Unit 1 Baltimore, MD | 3.0 | 3.0 | 1098 | $2,500 | $2.28 | 44d | 1 | 0.65mi |
| 2800 Presstman St Baltimore, MD | 3.0 | 2.5 | 1460 | $1,799 | $1.23 | 24d | 1 | 0.66mi |
| 2301 Whittier Ave Unit 2 Baltimore, MD | 2.0 | 2.0 | 1104 | $1,400 | $1.27 | 44d | 1 | 0.67mi |
| 2301 Whittier Ave Unit 3 Baltimore, MD | 2.0 | 2.0 | 1104 | $1,650 | $1.49 | 44d | 1 | 0.67mi |
| 2301 Whittier Ave Unit 1 Baltimore, MD | 2.0 | 1.0 | 1104 | $1,400 | $1.27 | 44d | 1 | 0.67mi |
| 2728 Winchester St Baltimore, MD | 3.0 | 1.5 | 1260 | $1,800 | $1.43 | 4d | 1 | 0.68mi |
| 2409 Francis St Baltimore, MD | 3.0 | 1.0 | 1298 | $1,500 | $1.16 | 44d | 1 | 0.70mi |
| 1346 N Carey St Baltimore, MD | 2.0 | 1.5 | 1100 | $1,500 | $1.36 | 44d | 1 | 0.70mi |
| 813 N Fulton Ave Unit 1 Baltimore, MD | 2.0 | 1.0 | 1200 | $1,350 | $1.12 | 44d | 1 | 0.71mi |
| 2449 Druid Hill Ave Baltimore, MD | 2.0 | 1.0 | 1100 | $1,800 | $1.64 | 44d | 1 | 0.74mi |
| 2433 Druid Hill Ave Baltimore, MD | 2.0 | 2.5 | 1092 | $1,999 | $1.83 | 44d | 1 | 0.74mi |
| 3401 Woodbrook Ave Unit 1 Baltimore, MD | 3.0 | 1.0 | 900 | $1,199 | $1.33 | 24d | 1 | 0.76mi |
| 2330 Bryant Ave Unit 2 Baltimore, MD | 1.0 | 1.0 | 900 | $1,350 | $1.50 | 44d | 1 | 0.76mi |
| 2330 Bryant Ave Unit 4 Baltimore, MD | 2.0 | 1.0 | 950 | $1,500 | $1.58 | 21d | 1 | 0.76mi |
| 2806 Riggs Ave Baltimore, MD | 3.0 | 2.5 | 1412 | $1,900 | $1.35 | 4d | 1 | 0.77mi |
| 1606 Gwynns Falls Pkwy Baltimore, MD | 2.0 | 1.0 | 748 | $1,200 | $1.60 | 24d | 1 | 0.80mi |
| 1121 Whitelock St Baltimore, MD | 2.0 | 1.0 | 1180 | $1,300 | $1.10 | 44d | 1 | 0.81mi |
Listing history 14 events
-
2026-06-18days on market $98,000 Active 19 DOM
-
2026-06-17days on market $98,000 Active 18 DOM
-
2026-06-16days on market $98,000 Active 17 DOM
-
2026-06-15days on market $98,000 Active 16 DOM
-
2026-06-13days on market $98,000 Active 14 DOM
-
2026-06-09days on market $98,000 Active 10 DOM
-
2026-06-08days on market $98,000 Active 9 DOM
-
2026-06-07days on market $98,000 Active 8 DOM
-
2026-06-04days on market $98,000 Active 5 DOM
-
2026-06-03days on market $98,000 Active 4 DOM
-
2026-06-02days on market $98,000 Active 3 DOM
-
2026-06-01days on market $98,000 Active 2 DOM
-
2026-05-31remarks 685-char remark
-
2026-05-31$98,000 Active 1 DOM
ⓘ Source: listings_history table (triggers on properties + properties_extension) + one-shot
backfill from property_details.listing_events for pre-trigger history.
Tax reassessment forecast MD · Partial reset (capped growth)
- Current annual tax
- $916 · $76/mo
- Projected year-2 tax
- $992 · $83/mo
- Expected delta
- +$76/yr (+$6/mo · 8.3%)
ⓘ Screening estimate from a state-policy table — verify with the county assessor before closing.
Climate risk First Street
- Flood 1/10 Low FEMA zone X (unshaded) · 0% chance over 30 yrs
- Wildfire 1/10 Low
- Heat 7/10 Severe 7 d/yr ≥103°F today · 15 d/yr by 30 yrs out
- Wind 6/10 Major 27% chance of damaging wind over 30 yrs
- Air quality 3/10 Moderate 3 unhealthy d/yr today · 4 by 30 yrs out
Nearby sold comps map
Loading sold comps map…
Walkable amenities ~0.75 mi
Loading nearby amenities…
Taxation est. · year 1
- Rental income
- $18,430
- − Mortgage interest
- −$5,490
- − Property taxes
- −$916
- − Insurance
- −$490
- − Repairs & maintenance
- −$1,474
- − Management
- −$1,474
- − Depreciation
- −$2,851
- Taxable income
- $5,735
- Est. tax owed @ 24.0%
- −$1,376
- After-tax cash flow
- $5,610/yr
For passive investors: Depreciation is non-cash, so a rental often shows a tax loss while cash-flowing — sheltering income. Rental losses are passive: they offset passive income freely, and up to $25,000/yr can offset ordinary (W-2) income if you actively participate and your MAGI is under $100k (phasing out to $0 by $150k); unused losses carry forward. On sale, claimed depreciation is recaptured at up to 25%, and gains may owe capital-gains tax (a 1031 exchange can defer both). Figures are a year-1 estimate at your 24.0% rate — not tax advice; consult a CPA.
Schools (NCES district)
- District
- Baltimore City Public Schools
- NCES district ID
- 2400090
- Math proficiency
- 7% ▼ -9.00%
- Reading proficiency
- 16% ▼ -5.00%
- Median HH income
- $42,108
- Composite
- 10.08/100
- National rank
- #9805
- State rank
- #24 of 24 in MD
Livability — Baltimore
- Score
- 76/100
- State rank
- #90
- US rank
- #3396
Category grades
Schools grade is shown separately in the Schools card above.
Census & demographics
- Census place
- Baltimore, MD
- County
- Baltimore City · 558,601 people
- City population
- 588,727
- Metro
- Baltimore-Columbia-Towson, MD
- Population (ZIP)
- 29,426
- Household income
- $42,031
- Rent vs Own
- Severe rent burden
- 2264.0
Population outlook (Baltimore County) Hauer SSP2
- Today (2025)
- 624,249 people
- By 2030
- 621,541 · -0.4%
- By 2040
- 609,756 · -2.3%
- By 2050
- 597,249 · -4.3%
- By 2075
- 552,236 · -11.5%
- By 2100
- 513,934 · -17.7%
Race, ethnicity, and origin ACS 2023
- Neighborhood character
- Predominantly Black (91%)
- Race & ethnicity
- Black 91% Hispanic / Latino 4% Two or more races 3% White 2%
- Foreign-born
- 3% · Canada
- Languages at home
- 96% English-only · Spanish 3% French/Haitian/Cajun 1%
Political lean MEDSL · Baltimore
- 2024 margin
- Solid D (+73.0) · D 85.2% · R 12.2% · Other 2.6%
- 2008→2024 swing
- -2.5pp toward R · 2008: 75.5pp · 2024: 73.0pp
- All cycles
- 2024: D+73.0 2020: D+76.6 2016: D+74.6 2012: D+76.4 2008: D+75.5
Not yet ingested
- Civics
- —
Market trends
- HPI YoY
- ▼ -107.42%
- Current HPI
- 164.3933
- Rent YoY
- ▲ 6.10%
- Metro
- Baltimore-Columbia-Towson, MD
- State GDP YoY
- ▲ 2.97%
- F500 in state
- 12
Industry mix (Fortune 500 HQ in MD)
| Industry | F500 HQs | Revenue |
|---|---|---|
| Aerospace / Defense | 1 | $71B |
|
||
| Utilities | 1 | $25B |
|
||
| Hotels | 1 | $24B |
|
||
| Consumer Goods | 1 | $7B |
|
||
| Real Estate | 1 | $6B |
|
||
| Chemicals | 1 | $2B |
|
||
Price history
1 event — show timeline
- 2026-05-30 Listed $98,000 BRIGHT MLS
Property tax history
-0.6%/yrLatest (2025): $916 · +4.9% YoY. Source: county tax records.
Cash-flow waterfall
monthlySold comps — $/sqft
last 12 mo · ≤1 miLoading sold comps…