 🏗️ New Construction
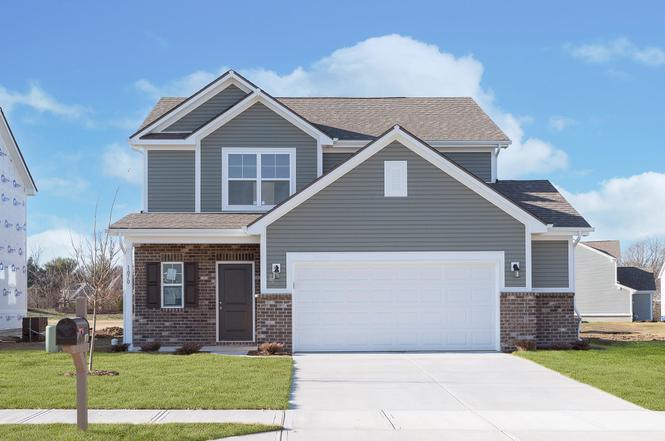
Juniper Plan · Louisville/Jefferson County metro government (balance), KY
Flood risk 1/10 · Minimal
- FEMA flood zone
- X (unshaded)
- Chance of flooding over 30 yrs
- 0.0%
- Est. flood insurance / yr
- $507 – $1,088
Fire risk 4/10 · Minor
- Est. fire insurance / yr
- $839 – $1,559
Heat risk 4/10 · Minor
- Hot days now (above 103°F)
- 7 days/yr
- Hot days in 30 yrs
- 20 days/yr
Wind risk 2/10 · Minimal
- Chance of severe wind over 30 yrs
- 2.0%
Air-quality risk 2/10 · Minimal
- Unhealthy air days now
- 1 days/yr
- Unhealthy air days in 30 yrs
- 3 days/yr
Risk factors via First Street. Map © Google.
Why this score? — see what drove the F grade
The composite is a weighted blend of 9 inputs, each scored 0–100. Each bar is that input's sub-score; the figure is the points it added to the 100-point composite (weight × sub-score).
- Cash flow +8.8/30.0
- ARV discount +7.5/15.0
- 1% rule +2.7/10.0
- Rent growth +2.5/5.0
- Livability +2.5/5.0
- Condition / age +2.5/5.0
- DSCR +2.4/10.0
- Schools +2.3/10.0
- Appreciation +0.0/10.0
$332,990
🖨 Deal sheet (PDF) 📄 Offer letter ✓ Due diligence
Listing remarks
Introducing The Juniper - one of Arbor Homes' newest two-story floorplans, offering beautiful exterior designs and flexible options to make it uniquely yours. Choose from multiple upgrades, add a basement for extra space, or expand your great room with a 2' rear and side extension. You can even add a third-car garage for more storage. Step inside to a welcoming hallway and convenient powder bath before entering the open-concept main floor. The spacious great room is perfect for entertaining, with an optional fireplace for cozy winter nights. The L-shaped kitchen features ample cabinetry, a walk-in pantry, and a large island ideal for meal prep or homework time. Enjoy family dinners in the c
Key facts
- L-shaped kitchen
- Walk-in closet
- Open layout
Tags
Property features AI
Finance
- Financial info: List price $332,990
Exterior
- Utilities: Heat pump heating; Central air conditioning
- Home design: Single-family plan located at Juniper Plan, Fisherville KY 40023; Active status
- Construction: New construction (plan inventory)
- Exterior features: Living area approximately 1760
Interior
- Bedrooms: 3 bedrooms
- Bathrooms: 2 full bathrooms and 1 half bathroom (2.5 total)
- Heating & cooling: Heat pump heating; Central air conditioning
- Interior features: Plan name: Juniper; New construction plan
Neighborhood map
What this means for you Summary
Snapshot
- This is a 3-bed/2.5-bath single-family listed at $333k.
Deal economics
- At list price, monthly cash flow is $-318 ($-4k/yr) — negative.
- The deal already cash-flows at list — no discount required.
- To meet the 1% rule (rent ≥ 1% of price), the offer needs to be $300k (9.9% below list).
- Recommended offer: $293k (12.0% below list) — sets the bar for market timing.
- Cap rate 5.3% vs local median 4.0% in Louisville/Jefferson County metro government (balance) — top-decile yield for the area; either an underpriced asset or a hidden risk that comps aren't pricing in. Stress-test before assuming the spread holds.
Location & tenants
- Location reads: area grade F — affects rentability + tenant quality, not the cash-flow math above.
- Jefferson County (urban): math 19% / reading 35% proficiency, ranked #121 of 165 in KY (top 73%) — low school quality limits family demand, transient renter base, plan for 1-2y turnover.
- Market conditions: 157 active listings in the ZIP; 1 comparable units currently listed for rent nearby; 2,836 units permitted in Jefferson County in 2024 (1,558 in 5+ unit buildings).
Forward outlook
- Local home prices are declining (-3.0%/yr); year-one equity from $3k of loan paydown is wiped out by about $12k of value loss. Plan a longer hold.
- Jefferson County population projected at +13% by 2050 — modest demand growth; plan on rents tracking national, not racing it.
Negotiation context
- It's been on market 522 days — a 12% lower offer ($293k) is reasonable based on typical stale-listing flexibility.
Questions for the listing agent
- What do current leases actually rent for vs. the listed asking? Can we see a recent rent roll and the last 12 months of T-12 income?
- It's been on market 522 days. Have you received any prior offers? Is the seller open to a 12% concession, seller financing, or rate buy-down credit?
- Why hasn't it sold? Are there any deal-killer items the seller is aware of (foundation, flood, title, zoning, code violations)?
- Is there a deadline driving the sale (1031 exchange, divorce, estate, relocation)? That informs how much negotiation room exists.
- The area grade is low — what's the realistic commute time and amenity access for the typical tenant pool here? Any planned neighborhood developments (good or bad) we should know about?
- What's the average days-on-market for RENTAL listings here right now (not sales)? A rising rental-DOM trend means longer vacancies and softer asking-rent achievability than the comps imply.
- What's the recent tenant-quality profile in this submarket — average credit score on applications, eviction rate, late-payment / NSF rate, and stable-employment percentage? A property-management company in the area should have these aggregated.
- How much new for-sale + rental construction is in the pipeline within 1–3 miles? Heavy new supply typically softens prices + rents 12–24 months out; constrained supply supports both.
Investment metrics
- 1% rule
- 0.77% ✗
- Cap rate
- 5.31%
- Cash-on-cash
- -3.50%
- DSCR
- 0.84
- GRM
- 10.8
CMA / ARV
- ARV (on-the-fly)
- $388,960
- Comps found
- 2
Show comp detail 2 sales within ~0.75 mi
| Address | Dist | Beds/Ba | Sqft | Sold | Price | $/sf | Match |
|---|---|---|---|---|---|---|---|
| 2218 Clark Station Rd | 0.44mi | 3/2.0 | 1,882 (+7%) | 15mo | $400,000 | $213 | 53 |
| 2212 Clark Station Rd | 0.46mi | 2/2.0 (-1) | 1,506 (-14%) | 10mo | $332,583 | $221 | 39 |
Match score weights: distance 35% · size 25% · config 20% · recency 20%. Top-matched comps best support the ARV.
Projected returns pro-forma
-3.0% appreciation · 3.0% rent growth · sell at horizon
- IRR
- -22.2%
- Equity multiple
- 0.24×
- Total profit
- $-83,238
- Equity at exit
- $57,995
- IRR
- -16.1%
- Equity multiple
- 0.10×
- Total profit
- $-98,379
- Equity at exit
- $33,630
Cash invested: $108,909 (down + closing). Projections, not guarantees.
Landlord ↔ Tenant lean methodology
- Overall (STATE)
- 83 Strongly Landlord-Friendly
- State Kentucky
- 83 Strongly Landlord-Friendly · R+16
- County
- — inherits STATE
- City
- — inherits STATE
ZIP-level market 40023
- Home prices YoY
- -17.5%
- Active inventory
- 157
- Price-to-rent
- 9.2×
Monthly cashflow live
- Estimated rent
- $3,000 medium interval (Pro) →
- Mortgage (P&I)
- −$2,040
- Tax est. 1.5%
- −$486 /mo · $5,834/yr
- Insurance
- −$162
- HOA
- −$0
- Vacancy / Maint / Mgmt
- −$630
- Net cashflow
- $-318
Break-even live
Sensitivity live
| Price | -10% $-49 | -5% $-184 | +0% $-318 | +5% $-452 | +10% $-587 |
|---|---|---|---|---|---|
| Rent | -10% $-555 | -5% $-437 | +0% $-318 | +5% $-200 | +10% $-81 |
| Rate | -1.0pp $-122 | -0.5pp $-219 | base $-318 | +0.5pp $-419 | +1.0pp $-521 |
UW: 25.0% down · 7.5% · 30yr · 1.5% tax · 5.0% vac · 8.0% maint · 8.0% mgmt
Financing live
Cash to close
- Down payment
- $97,240
- Closing costs
- $11,669
- Reserves months
- —
- Total cash needed
- —
Loan-product check · same deal, 3 products live
Conventional
25% down · 7.5% · 30yr
- Down + closing
- —
- Monthly P&I
- —
- Monthly cashflow
- —
- DSCR
- —
- Eligible?
- —
Personal DTI + credit; lowest rate.
DSCR
20% down · 8.5% · 30yr
- Down + closing
- —
- Monthly P&I
- —
- Monthly cashflow
- —
- DSCR
- —
- Eligible?
- —
No personal income docs; deal must DSCR.
Hard money
10% down · 12.0% · 12mo
- Down + closing
- —
- Monthly P&I
- —
- Monthly cashflow
- —
- DSCR
- —
- Eligible?
- —
Short-term bridge; refi at stabilization.
Rent comps 1 comps
| Address | Beds | Baths | Sqft | Rent | $/sqft | DOM | Units | Dist |
|---|---|---|---|---|---|---|---|---|
| 3222 Catalpa Farms Dr Fisherville, KY | 3.0 | 2.5 | 2004 | $3,000 | $1.50 | 24d | 1 | 0.29mi |
Listing history 14 events
-
2026-06-21days on market $332,990 Active 522 DOM
-
2026-06-18days on market $332,990 Active 519 DOM
-
2026-06-17days on market $332,990 Active 518 DOM
-
2026-06-16days on market $332,990 Active 517 DOM
-
2026-06-15days on market $332,990 Active 516 DOM
-
2026-06-13days on market $332,990 Active 514 DOM
-
2026-06-10days on market $332,990 Active 511 DOM
-
2026-06-09days on market $332,990 Active 510 DOM
-
2026-06-08days on market $332,990 Active 509 DOM
-
2026-06-07days on market $332,990 Active 508 DOM
-
2026-06-03days on market $332,990 Active 504 DOM
-
2026-06-02days on market $332,990 Active 503 DOM
-
2026-06-01days on market $332,990 Active 502 DOM
-
2026-05-31days on market $332,990 Active 501 DOM
ⓘ Source: listings_history table (triggers on properties + properties_extension) + one-shot
backfill from property_details.listing_events for pre-trigger history.
Climate risk First Street
- Flood 1/10 Low FEMA zone X (unshaded) · 0% chance over 30 yrs
- Wildfire 4/10 Moderate
- Heat 4/10 Moderate 7 d/yr ≥103°F today · 20 d/yr by 30 yrs out
- Wind 2/10 Low 2% chance of damaging wind over 30 yrs
- Air quality 2/10 Low 1 unhealthy d/yr today · 3 by 30 yrs out
Nearby sold comps map
Loading sold comps map…
Walkable amenities ~0.75 mi
Loading nearby amenities…
Taxation est. · year 1
- Rental income
- $36,000
- − Mortgage interest
- −$21,788
- − Property taxes
- −$5,834
- − Insurance
- −$1,945
- − Repairs & maintenance
- −$2,880
- − Management
- −$2,880
- − Depreciation
- −$11,315
- Taxable loss
- −$10,642
- Est. tax savings @ 24.0%
- +$2,554
- After-tax cash flow
- $-1,262/yr
For passive investors: Depreciation is non-cash, so a rental often shows a tax loss while cash-flowing — sheltering income. Rental losses are passive: they offset passive income freely, and up to $25,000/yr can offset ordinary (W-2) income if you actively participate and your MAGI is under $100k (phasing out to $0 by $150k); unused losses carry forward. On sale, claimed depreciation is recaptured at up to 25%, and gains may owe capital-gains tax (a 1031 exchange can defer both). Figures are a year-1 estimate at your 24.0% rate — not tax advice; consult a CPA.
Schools (NCES district)
- District
- Jefferson County
- NCES district ID
- 2102990
- Math proficiency
- 19% ▼ -17.00%
- Reading proficiency
- 35% ▼ -11.00%
- Median HH income
- $47,885
- Composite
- 23.45/100
- National rank
- #7884
- State rank
- #121 of 165 in KY
Livability — Louisville/Jefferson County metro government (balance)
No livability data for this city. (Only ~50 U.S. cities are tracked.)
Census & demographics
- Census place
- Louisville/Jefferson County metro government (balance), KY
- City population
- 419,741
- Population (ZIP)
- 6,484
Population outlook (Jefferson County) Hauer SSP2
- Today (2025)
- 823,112 people
- By 2030
- 849,343 · +3.2%
- By 2040
- 895,696 · +8.8%
- By 2050
- 933,630 · +13.4%
- By 2075
- 1,028,262 · +24.9%
- By 2100
- 1,072,675 · +30.3%
Race, ethnicity, and origin ACS 2023
- Neighborhood character
- Predominantly White (84%)
- Race & ethnicity
- White 84% Black 7% Hispanic / Latino 4% Asian 3% Two or more races 2%
- Common ancestry
- Slovak 4% Iranian 3% Romanian 2%
- Foreign-born
- 3% · Canada, South Korea, China
- Languages at home
- 95% English-only · Spanish 3% Korean 1% Other Indo-European 1%
Political lean MEDSL · Jefferson
- 2024 margin
- D (+16.6) · D 57.4% · R 40.9% · Other 1.7%
- 2008→2024 swing
- +4.5pp toward D · 2008: 12.0pp · 2024: 16.6pp
- All cycles
- 2024: D+16.6 2020: D+20.1 2016: D+13.3 2012: D+11.1 2008: D+12.0
Not yet ingested
- Civics
- —
Market trends
- HPI YoY
- ▼ -48.35%
- Current HPI
- 227.4205
- Rent YoY
- —
- Metro
- —
- State GDP YoY
- ▲ 1.81%
- F500 in state
- 4
Industry mix (Fortune 500 HQ in KY)
| Industry | F500 HQs | Revenue |
|---|---|---|
| Healthcare | 1 | $118B |
|
||
| Food / Beverage | 1 | $7B |
|
||
Cash-flow waterfall
monthlySold comps — $/sqft
last 12 mo · ≤1 miLoading sold comps…