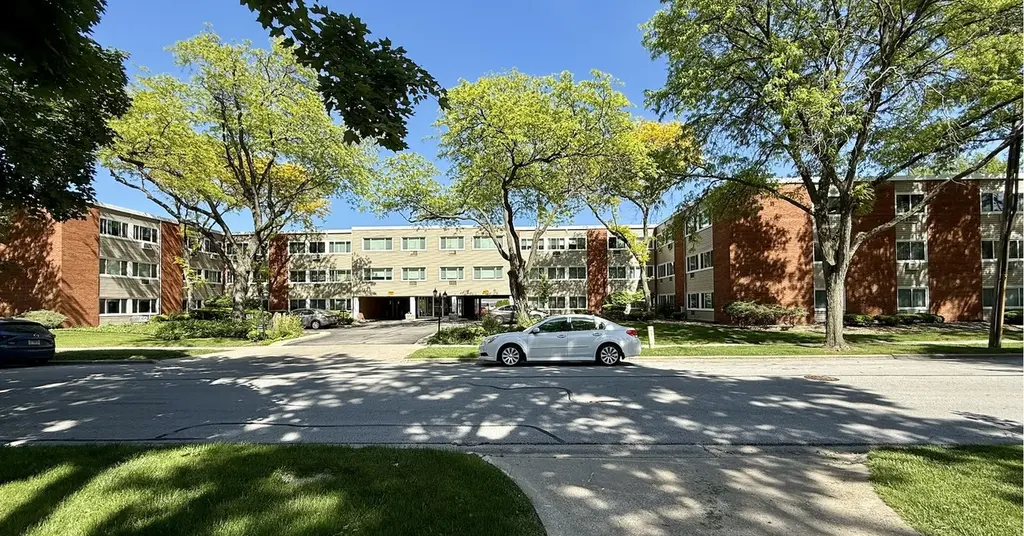
1139 Leavitt Ave #212 · Flossmoor, IL
Flood risk 4/10 · Minor
- FEMA flood zone
- X (unshaded)
- Chance of flooding over 30 yrs
- 0.22%
- Est. flood insurance / yr
- $507 – $1,088
Fire risk 1/10 · Minimal
- Est. fire insurance / yr
- $804 – $1,492
Heat risk 3/10 · Minor
- Hot days now (above 101°F)
- 7 days/yr
- Hot days in 30 yrs
- 15 days/yr
Wind risk 2/10 · Minimal
- Chance of severe wind over 30 yrs
- —
Air-quality risk 2/10 · Minimal
- Unhealthy air days now
- 1 days/yr
- Unhealthy air days in 30 yrs
- 1 days/yr
Risk factors via First Street. Map © Google.
Why this score? — see what drove the C+ grade
The composite is a weighted blend of 9 inputs, each scored 0–100. Each bar is that input's sub-score; the figure is the points it added to the 100-point composite (weight × sub-score).
- Cash flow +26.4/30.0
- 1% rule +10.0/10.0
- DSCR +9.0/10.0
- ARV discount +7.5/15.0
- Livability +4.0/5.0
- Rent growth +2.5/5.0
- Condition / age +2.5/5.0
- Schools +2.4/10.0
- Appreciation +0.0/10.0
$92,000
🖨 Deal sheet 📄 Offer letter ✓ Due diligence
Listing remarks
Great opportunity to own this spacious 1 bedroom, 1 bath condo offering approximately 950 sq ft on a quiet, tree lined street in the heart of Flossmoor. Own your home for less than the price of rent. This unit offers a generous layout with plenty of natural light and a large private storage unit conveniently located just outside your door on the same floor. Windows were replaced in 2023. Building features new Speed Queen coin-operated laundry and is an owner occupied building with no rentals allowed, providing a stable and well-maintained community. Enjoy an unbeatable location just a 5 minute walk to the Flossmoor Metra station, library, and downtown Flossmoor including Beyond Borders Cafe
Key facts
- $409 HOA
- Parking
- Built 1962
Property features AI
Finance
- Other: Six-unit building; Estimated living area 950; Not currently leased; Directions: Flossmoor Road to Leavitt south to property address
- HOA & community: Monthly association fee of $409; Association covers heat, water, gas, parking, insurance, lawn care, trash service, and snow removal; On-site coin laundry and storage available; No pets allowed
Exterior
- Parking: One assigned, owned parking space
- Utilities: Lake Michigan water source; Public sewer
- Home design: Attached single (condo); Condo ownership; Entry level 2; Disability accessible
- Construction: Brick construction; Approximately 61–70 years old; Built before 1978
- Exterior features: Common lot/grounds; School bus, commuter bus, and commuter train access
Interior
- Kitchen: Range; Dishwasher; Refrigerator; Kitchen on main level (19 x 9)
- Bedrooms: Master bedroom on main level (18 x 12); Three additional bedrooms
- Bathrooms: One full bathroom
- Heating & cooling: Natural gas heating; Baseboard heating; Wall cooling unit(s)
- Interior features: Four total rooms; Separate dining room; Family room; Living room
- Laundry & utility: Laundry room; Common area laundry
Neighborhood map
What this means for you Summary
Snapshot
- This is a 1-bed/1.0-bath condo listed at $92k.
Deal economics
- At list price, monthly cash flow is $240 ($3k/yr) — positive.
- The deal already cash-flows at list — no discount required.
- Meets the 1% rule at list price ($2k rent vs $92k).
- Recommended offer: $89k (3.0% below list) — sets the bar for market timing.
- Cap rate 9.4% vs local median 4.4% in Flossmoor — top-decile yield for the area; either an underpriced asset or a hidden risk that comps aren't pricing in. Stress-test before assuming the spread holds.
Location & tenants
- Location reads 80/100 on livability (#107 in IL, #1,718 nationally) — a professional / high-income tenant draw. Strengths: employment A+, housing A+, crime B+; Watch: cost of living D, amenities F.
- Homewood Flossmoor Chsd 233 (suburban): math 21% / reading 27% proficiency, ranked #272 of 620 in IL (top 44%) — low school quality limits family demand, transient renter base, plan for 1-2y turnover.
- Zoned schools: Homewood-Flossmoor High School (math 21% / reading 27%, grade F, #304 of 693 statewide, top 44%, 2,798 students, 0% FRL).
- Market conditions: 94 active listings in the ZIP; 2 comparable units currently listed for rent nearby; 6,272 units permitted in Cook County in 2024 (4,658 in 5+ unit buildings).
Forward outlook
- Local home prices are declining (-3.0%/yr); year-one equity from $636 of loan paydown is wiped out by about $3k of value loss. Plan a longer hold.
- At projected returns (-3.0% appreciation + 3.0% rent growth), your $26k cash investment doubles in ~10 years — after that, you're playing with house money.
Negotiation context
- It's been on market 31 days — a 3% lower offer ($89k) is reasonable based on typical stale-listing flexibility.
- 5 sale attempts since 7y ago; this cycle's ask has dropped $8k (8%) from the opening price — seller is motivated, your offer sets the floor, not the list.
- Current owner paid $44k; list at $92k implies a 111% gain — meaningful room to come down on a strong offer.
Risks & watch-outs
- Watch-outs: property tax is 3.3% of price; HOA is 23% of rent.
Questions for the listing agent
- It's been on market 31 days. Have you received any prior offers? Is the seller open to a 3% concession, seller financing, or rate buy-down credit?
- Built in 1962 — when were the roof, HVAC, electrical panel, plumbing, and water heater last replaced?
- Property tax is high relative to price — has the assessment been appealed recently, and will the sale trigger a re-assessment?
- What does the HOA fee cover, when was the last increase, and are there any pending special assessments or reserve-fund shortfalls?
- Any open or pending special assessments — roof, HVAC, plumbing, elevator, façade? What's the per-unit balance and payoff schedule, and is the seller paying it off at close or rolling it to the buyer?
- Is there a deadline driving the sale (1031 exchange, divorce, estate, relocation)? That informs how much negotiation room exists.
- Schools are B-rated — typically a magnet for longer-tenancy family renters. What's the average tenant stay here, and is there a school-zone premium baked into asking?
- What's the average days-on-market for RENTAL listings here right now (not sales)? A rising rental-DOM trend means longer vacancies and softer asking-rent achievability than the comps imply.
- What's the recent tenant-quality profile in this submarket — average credit score on applications, eviction rate, late-payment / NSF rate, and stable-employment percentage? A property-management company in the area should have these aggregated.
- How much new apartment / multifamily construction is in the pipeline within 1–3 miles? Heavy new supply (>2% of stock underway) typically softens rents 12–24 months out; light construction supports rent growth.
Investment metrics
- 1% rule
- 1.95% ✓
- Cap rate
- 9.42%
- Cash-on-cash
- 11.17%
- DSCR
- 1.50
- GRM
- 4.3
CMA / ARV
No comps found within radius.
Projected returns pro-forma
-3.0% appreciation · 3.0% rent growth · sell at horizon
- IRR
- 0.7%
- Equity multiple
- 1.03×
- Total profit
- $725
- Equity at exit
- $13,717
- IRR
- 10.7%
- Equity multiple
- 1.84×
- Total profit
- $21,762
- Equity at exit
- $7,954
Cash invested: $25,760 (down + closing). Projections, not guarantees.
Landlord ↔ Tenant lean methodology
- Overall (STATE)
- 43 Moderately Tenant-Leaning
- State Illinois
- 43 Moderately Tenant-Leaning · D+7
- County
- — inherits STATE
- City
- — inherits STATE
ZIP-level market 60422
- Home prices YoY
- -26.3%
- Active inventory
- 94
- Price-to-rent
- 4.3×
Monthly cashflow live
- Estimated rent
- $1,796 medium interval (Pro) →
- Mortgage (P&I)
- −$482
- Tax from tax record
- −$249 /mo · $2,992/yr
- Insurance
- −$38
- HOA
- −$409
- Vacancy / Maint / Mgmt
- −$377
- Net cashflow
- $240
Break-even live
UW: 25.0% down · 7.5% · 30yr · 1.5% tax · 5.0% vac · 8.0% maint · 8.0% mgmt
Financing live
Cash to close
- Down payment
- $23,000
- Closing costs
- $2,760
- Reserves months
- —
- Total cash needed
- —
Loan-product check · same deal, 3 products live
Conventional
25% down · 7.5% · 30yr
- Down + closing
- —
- Monthly P&I
- —
- Monthly cashflow
- —
- DSCR
- —
- Eligible?
- —
Personal DTI + credit; lowest rate.
DSCR
20% down · 8.5% · 30yr
- Down + closing
- —
- Monthly P&I
- —
- Monthly cashflow
- —
- DSCR
- —
- Eligible?
- —
No personal income docs; deal must DSCR.
Hard money
10% down · 12.0% · 12mo
- Down + closing
- —
- Monthly P&I
- —
- Monthly cashflow
- —
- DSCR
- —
- Eligible?
- —
Short-term bridge; refi at stabilization.
Rent comps 2 comps
| Address | Beds | Baths | Sqft | Rent | $/sqft | DOM | Units | Dist |
|---|---|---|---|---|---|---|---|---|
| 2640 Flossmoor Rd Unit 2S Flossmoor, IL | 2.0 | 1.5 | 800 | $1,800 | $2.25 | 15d | 1 | 0.10mi |
| 2420 183rd St Homewood, IL | 2.0 | 1.0 | 1100 | $1,750 | $1.59 | 11d | 1 | 1.21mi |
HOA detail condo
- Monthly dues
- $409 · $4,908/yr
- Assessments
- None detected in remarks — confirm with the listing agent.
Listing history 28 events
-
2026-06-18days on market $92,000 Active 31 DOM
-
2026-06-17pricedays on market $92,000 Active 30 DOM
-
2026-06-16days on market $99,900 Active 29 DOM
-
2026-06-15days on market $99,900 Active 28 DOM
-
2026-06-13days on market $99,900 Active 26 DOM
-
2026-06-09days on market $99,900 Active 22 DOM
-
2026-06-08days on market $99,900 Active 21 DOM
-
2026-06-07days on market $99,900 Active 20 DOM
-
2026-06-04days on market $99,900 Active 17 DOM
-
2026-06-03days on market $99,900 Active 16 DOM
-
2026-06-02days on market $99,900 Active 15 DOM
-
2026-06-01days on market $99,900 Active 14 DOM
-
2026-05-31days on market $99,900 Active 13 DOM
-
2026-05-18$99,900 Active
-
2026-05-12historical
-
2026-04-14price
-
2026-03-12Active
-
2025-12-12historical
-
2025-11-20price
-
2025-11-07Active
-
2020-04-27soldstatus $43,500
-
2020-03-31soldstatus $43,500 Closed Sale
-
2020-03-10status Contingent
-
2020-03-04status Reactivated
-
2020-02-18historical Contingent
-
2019-10-22$49,900 New
-
1993-04-27soldstatus $50,000
-
1983-10-01soldstatus $39,000
ⓘ Source: listings_history table (triggers on properties + properties_extension) + one-shot
backfill from property_details.listing_events for pre-trigger history.
Tax reassessment forecast IL · Partial reset (capped growth)
- Current annual tax
- $2,992 · $249/mo
- Projected year-2 tax
- $2,992 · $249/mo
- Expected delta
- $0/yr ($0/mo · 0.0%)
ⓘ Screening estimate from a state-policy table — verify with the county assessor before closing.
Climate risk First Street
- Flood 4/10 Moderate FEMA zone X (unshaded) · 22% chance over 30 yrs
- Wildfire 1/10 Low
- Heat 3/10 Moderate 7 d/yr ≥101°F today · 15 d/yr by 30 yrs out
- Wind 2/10 Low
- Air quality 2/10 Low 1 unhealthy d/yr today · 1 by 30 yrs out
Nearby sold comps map
Loading sold comps map…
Walkable amenities ~0.75 mi
Loading nearby amenities…
Taxation est. · year 1
- Rental income
- $21,553
- − Mortgage interest
- −$5,153
- − Property taxes
- −$2,992
- − Insurance
- −$460
- − Repairs & maintenance
- −$1,724
- − Management
- −$1,724
- − HOA
- −$4,908
- − Depreciation
- −$2,676
- Taxable income
- $1,915
- Est. tax owed @ 24.0%
- −$460
- After-tax cash flow
- $2,418/yr
For passive investors: Depreciation is non-cash, so a rental often shows a tax loss while cash-flowing — sheltering income. Rental losses are passive: they offset passive income freely, and up to $25,000/yr can offset ordinary (W-2) income if you actively participate and your MAGI is under $100k (phasing out to $0 by $150k); unused losses carry forward. On sale, claimed depreciation is recaptured at up to 25%, and gains may owe capital-gains tax (a 1031 exchange can defer both). Figures are a year-1 estimate at your 24.0% rate — not tax advice; consult a CPA.
Schools (NCES district)
- District
- Homewood Flossmoor Chsd 233
- NCES district ID
- 1719560
- Math proficiency
- 21% ▼ -15.00%
- Reading proficiency
- 27% ▼ -13.00%
- Median HH income
- $83,564
- Composite
- 24.42/100
- National rank
- #7681
- State rank
- #272 of 620 in IL
Livability — Flossmoor
- Score
- 80/100
- State rank
- #107
- US rank
- #1718
Category grades
Schools grade is shown separately in the Schools card above.
Census & demographics
- Census place
- Flossmoor, IL
- City population
- 9,885
- Population (ZIP)
- 9,885
Population outlook (Cook County) Hauer SSP2
- Today (2025)
- 5,347,519 people
- By 2030
- 5,357,703 · +0.2%
- By 2040
- 5,324,924 · -0.4%
- By 2050
- 5,230,762 · -2.2%
- By 2075
- 4,785,735 · -10.5%
- By 2100
- 4,188,836 · -21.7%
Race, ethnicity, and origin ACS 2023
- Neighborhood character
- Majority Black (63%)
- Race & ethnicity
- Black 63% White 28% Hispanic / Latino 5% Two or more races 4% Asian 2%
- Common ancestry
- Iranian 3% Romanian 3% Portuguese 2%
- Foreign-born
- 5% · Canada
- Languages at home
- 92% English-only · Spanish 4% Other Asian/Pacific 2% Other Indo-European 1%
Political lean MEDSL · Cook
- 2024 margin
- Solid D (+42.0) · D 70.4% · R 28.4% · Other 1.2%
- 2008→2024 swing
- -11.4pp toward R · 2008: 53.4pp · 2024: 42.0pp
- All cycles
- 2024: D+42.0 2020: D+50.3 2016: D+53.0 2012: D+49.4 2008: D+53.4
Not yet ingested
- Civics
- —
Market trends
- HPI YoY
- ▼ -67.78%
- Current HPI
- 189.5534
- Rent YoY
- —
- Metro
- —
- State GDP YoY
- ▲ 1.59%
- F500 in state
- 60
Industry mix (Fortune 500 HQ in IL)
| Industry | F500 HQs | Revenue |
|---|---|---|
| Insurance | 4 | $201B |
|
||
| Consumer Goods | 4 | $87B |
|
||
| Industrial Machinery | 3 | $64B |
|
||
| Healthcare | 2 | $55B |
|
||
| Retail / Pharmacy | 1 | $148B |
|
||
| Agriculture / Food | 1 | $86B |
|
||
Price history
+156.2% since first listed15 events — show timeline
- 2026-05-18 Listed $99,900 MRED as Distributed by MLS Grid
- 2026-05-12 Listing Removed — MRED as Distributed by MLS Grid
- 2026-04-14 Price Changed — MRED as Distributed by MLS Grid
- 2026-03-12 Listed — MRED as Distributed by MLS Grid
- 2025-12-12 Listing Removed — MRED as Distributed by MLS Grid
- 2025-11-20 Price Changed — MRED as Distributed by MLS Grid
- 2025-11-07 Listed — MRED as Distributed by MLS Grid
- 2020-04-27 Sold (Public Records) $43,500 Public Records
- 2020-03-31 Sold (MLS) $43,500 MRED as Distributed by MLS Grid
- 2020-03-10 Pending — MRED as Distributed by MLS Grid
- 2020-03-04 Relisted — MRED as Distributed by MLS Grid
- 2020-02-18 Contingent — MRED as Distributed by MLS Grid
- 2019-10-22 Listed $49,900 MRED as Distributed by MLS Grid
- 1993-04-27 Sold (Public Records) $50,000 Public Records
- 1983-10-01 Sold (Public Records) $39,000 Public Records
Property tax history
+7.8%/yrLatest (2023): $2,992 · +87.9% YoY. Source: county tax records.
Cash-flow waterfall
monthlySold comps — $/sqft
last 12 mo · ≤1 miLoading sold comps…