18506 Camellia Terrace Dr · Houston, TX
Flood risk No data
- FEMA flood zone
- —
- Chance of flooding over 30 yrs
- —
- Est. flood insurance / yr
- —
Fire risk No data
- Est. fire insurance / yr
- —
Heat risk No data
- Hot days now (above threshold)
- —
- Hot days in 30 yrs
- —
Wind risk No data
- Chance of severe wind over 30 yrs
- —
Air-quality risk No data
- Unhealthy air days now
- —
- Unhealthy air days in 30 yrs
- —
Risk factors via First Street. Map © Google.
Why this score? — see what drove the C+ grade
The composite is a weighted blend of 9 inputs, each scored 0–100. Each bar is that input's sub-score; the figure is the points it added to the 100-point composite (weight × sub-score).
- Cash flow +21.0/30.0
- ARV discount +15.0/15.0
- 1% rule +6.7/10.0
- DSCR +6.7/10.0
- Condition / age +4.0/5.0
- Livability +3.7/5.0
- Schools +3.5/10.0
- Rent growth +2.9/5.0
- Appreciation +0.0/10.0
$205,790
🖨 Deal sheet (PDF) 📄 Offer letter ✓ Due diligence
Listing remarks MLS
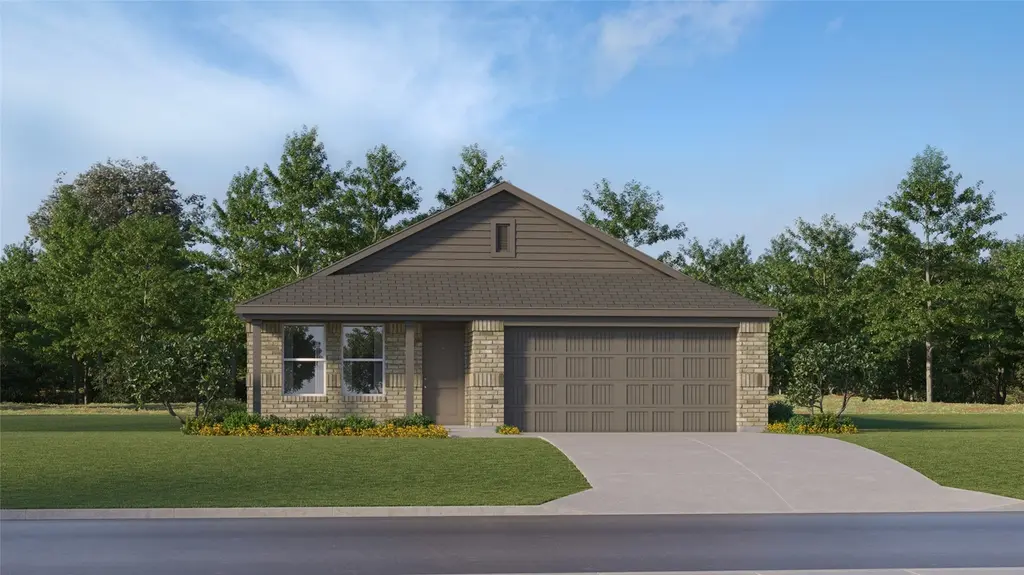
The Oxford Floor Plan - This single-level home showcases a spacious open floorplan shared between the kitchen, dining area and family room for easy entertaining. An owner’s suite enjoys a private location in a rear corner of the home, complemented by an en-suite bathroom and walk-in closet. There are three secondary bedrooms at the front of the home, which are comfortable spaces for household members and overnight guests. The completion date, prices and features may vary and are subject to change. Please verify with Lennar directly. Photos are for illustrative purposes only.
Key facts
- Walk-in closet
- Open floorplan
- Secondary bedrooms
Tags
Neighborhood map
What this means for you Summary
Snapshot
- This is a 4-bed/2.0-bath single-family listed at $206k. Condition is rated good.
Deal economics
- At list price, monthly cash flow is $291 ($3k/yr) — positive.
- The deal already cash-flows at list — no discount required.
- Meets the 1% rule at list price ($2k rent vs $206k).
- Recommended offer: $203k (1.5% below list) — sets the bar for market timing.
- Cap rate 8.0% vs local median 3.1% in Houston — top-decile yield for the area; either an underpriced asset or a hidden risk that comps aren't pricing in. Stress-test before assuming the spread holds.
Location & tenants
- Location reads 74/100 on livability (#184 in TX, #4,771 nationally) — a middle-class / working-renter tenant base. Strengths: amenities A+, cost of living A+, housing A+; Watch: schools D, crime F.
- Crosby ISD (rural): math 39% / reading 40% proficiency, ranked #369 of 826 in TX (top 45%) — families likely to look elsewhere, expect single-tenant / working-renter base with shorter leases.
- Market conditions: Rents rising (+1.5%/yr); 1188 active listings in the ZIP; 2 comparable units currently listed for rent nearby; solid renter incomes; 29,883 units permitted in Harris County in 2024 (8,621 in 5+ unit buildings).
- This rent runs 31% of the median local income ($92k/yr) — at the standard rent-burdened threshold; future hikes will face affordability resistance.
Forward outlook
- Local home prices are declining (-3.0%/yr); year-one equity from $1k of loan paydown is wiped out by about $6k of value loss. Plan a longer hold.
- Harris County population projected at +47% by 2050 — long-run rental-demand tailwind backs the buy-and-hold thesis.
Negotiation context
- It's been on market 25 days — a 2% lower offer ($203k) is reasonable based on typical stale-listing flexibility.
- 2 sale attempts; this cycle's ask has dropped $14k (6%) from the opening price — seller is motivated, your offer sets the floor, not the list.
Questions for the listing agent
- What does the HOA fee cover, when was the last increase, and are there any pending special assessments or reserve-fund shortfalls?
- Is there a deadline driving the sale (1031 exchange, divorce, estate, relocation)? That informs how much negotiation room exists.
- Schools are D-rated, which usually means shorter tenancies and higher turnover. Who's the typical renter profile here, and what's been the actual vacancy rate?
- Crime grade is F in this area — have there been break-ins, vandalism, or insurance claims at this property in the last 3 years? What carrier currently insures it and at what premium?
- What's the average days-on-market for RENTAL listings here right now (not sales)? A rising rental-DOM trend means longer vacancies and softer asking-rent achievability than the comps imply.
- What's the recent tenant-quality profile in this submarket — average credit score on applications, eviction rate, late-payment / NSF rate, and stable-employment percentage? A property-management company in the area should have these aggregated.
- How much new for-sale + rental construction is in the pipeline within 1–3 miles? Heavy new supply typically softens prices + rents 12–24 months out; constrained supply supports both.
Investment metrics
- 1% rule
- 1.17% ✓
- Cap rate
- 7.99%
- Cash-on-cash
- 6.05%
- DSCR
- 1.27
- GRM
- 7.1
CMA / ARV
- ARV (median comp)
- $269,990
- List price
- $205,790
- Delta
- -23.78%
- Verdict
- UNDERPRICED
- Comps
- 20 within 1.0 mi
Show comp detail 12 sales within ~0.75 mi
| Address | Dist | Beds/Ba | Sqft | Sold | Price | $/sf | Match |
|---|---|---|---|---|---|---|---|
| 18506 Camellia Terrace Dr | 0.00mi | 4/2.0 | 1,760 (0%) | 1mo | $205,790 | $117 | 99 |
| 1530 Gardenia Grove Ln | 0.11mi | 4/2.0 | 1,760 (0%) | 0mo | $223,990 | $127 | 95 |
| 1511 Gardenia Grove Ln | 0.06mi | 4/2.0 | 1,720 (-2%) | 1mo | $205,290 | $119 | 93 |
| 1542 Marigold Bend Dr | 0.26mi | 3/2.0 (-1) | 1,724 (-2%) | 1mo | $246,990 | $143 | 79 |
| 18502 Camellia Terrace Dr | 0.01mi | 4/2.5 | 1,968 (+12%) | 1mo | $231,990 | $118 | 77 |
| 18530 Camellia Terrace Dr | 0.05mi | 4/2.5 | 1,968 (+12%) | 1mo | $238,990 | $121 | 75 |
| 18327 Ginger Glen Ln | 0.36mi | 4/2.0 | 1,859 (+6%) | 1mo | $308,990 | $166 | 73 |
| 1734 Indigo Chase Dr | 0.30mi | 4/2.0 | 1,900 (+8%) | 1mo | $235,140 | $124 | 72 |
| 1602 Marigold Bend Dr | 0.27mi | 3/2.0 (-1) | 1,635 (-7%) | 1mo | $246,190 | $151 | 70 |
| 1531 Gardenia Grove Ln | 0.08mi | 3/2.0 (-1) | 1,522 (-14%) | 1mo | $270,990 | $178 | 68 |
| 1719 Indigo Chase Dr | 0.28mi | 3/2.0 (-1) | 1,602 (-9%) | 0mo | $290,990 | $182 | 67 |
| 1730 Indigo Chase Dr | 0.30mi | 3/2.0 (-1) | 1,949 (+11%) | 1mo | $309,990 | $159 | 63 |
Match score weights: distance 35% · size 25% · config 20% · recency 20%. Top-matched comps best support the ARV.
Projected returns pro-forma
-3.0% appreciation · 1.48% rent growth · sell at horizon
- IRR
- -8.8%
- Equity multiple
- 0.68×
- Total profit
- $-18,317
- Equity at exit
- $30,684
- IRR
- -1.6%
- Equity multiple
- 0.90×
- Total profit
- $-5,948
- Equity at exit
- $17,793
Cash invested: $57,621 (down + closing). Projections, not guarantees.
Landlord ↔ Tenant lean methodology
- Overall (STATE)
- 87 Strongly Landlord-Friendly
- State Texas
- 87 Strongly Landlord-Friendly · R+5
- County
- — inherits STATE
- City
- — inherits STATE
ZIP-level market 77532
- Home prices YoY
- -28.6%
- Rents YoY
- 1.5%
- Active inventory
- 1188
- Price-to-rent
- 7.1×
Monthly cashflow live
- Estimated rent
- $2,411 medium interval (Pro) →
- Mortgage (P&I)
- −$1,079
- Tax est. 1.5%
- −$257 /mo · $3,087/yr
- Insurance
- −$86
- HOA
- −$192
- Vacancy / Maint / Mgmt
- −$506
- Net cashflow
- $291
Break-even live
Sensitivity live
| Price | -10% $433 | -5% $362 | +0% $291 | +5% $219 | +10% $148 |
|---|---|---|---|---|---|
| Rent | -10% $100 | -5% $195 | +0% $291 | +5% $386 | +10% $481 |
| Rate | -1.0pp $394 | -0.5pp $343 | base $291 | +0.5pp $237 | +1.0pp $183 |
UW: 25.0% down · 7.5% · 30yr · 1.5% tax · 5.0% vac · 8.0% maint · 8.0% mgmt
Financing live
Cash to close
- Down payment
- $51,448
- Closing costs
- $6,174
- Reserves months
- —
- Total cash needed
- —
Loan-product check · same deal, 3 products live
Conventional
25% down · 7.5% · 30yr
- Down + closing
- —
- Monthly P&I
- —
- Monthly cashflow
- —
- DSCR
- —
- Eligible?
- —
Personal DTI + credit; lowest rate.
DSCR
20% down · 8.5% · 30yr
- Down + closing
- —
- Monthly P&I
- —
- Monthly cashflow
- —
- DSCR
- —
- Eligible?
- —
No personal income docs; deal must DSCR.
Hard money
10% down · 12.0% · 12mo
- Down + closing
- —
- Monthly P&I
- —
- Monthly cashflow
- —
- DSCR
- —
- Eligible?
- —
Short-term bridge; refi at stabilization.
Rent comps 2 comps
| Address | Beds | Baths | Sqft | Rent | $/sqft | DOM | Units | Dist |
|---|---|---|---|---|---|---|---|---|
| 1519 Gardenia Grove Ln Crosby, TX | 3.0 | 2.0 | 1461 | $1,800 | $1.23 | 25d | 1 | 0.06mi |
| 18707 Antler Trails Ct Crosby, TX | 4.0 | 2.5 | 2547 | $2,361 | $0.93 | 25d | 1 | 0.86mi |
HOA detail
- Monthly dues
- $192 · $2,304/yr
Listing history 8 events
-
2026-05-11status Pending 587-char remark
Show marketing remark (587 chars)
The Oxford Floor Plan - This single-level home showcases a spacious open floorplan shared between the kitchen, dining area and family room for easy entertaining. An owner’s suite enjoys a private location in a rear corner of the home, complemented by an en-suite bathroom and walk-in closet. There are three secondary bedrooms at the front of the home, which are comfortable spaces for household members and overnight guests. The completion date, prices and features may vary and are subject to change. Please verify with Lennar directly. Photos are for illustrative purposes only.
-
2026-05-07price $205,790 587-char remark
Show marketing remark (587 chars)
The Oxford Floor Plan - This single-level home showcases a spacious open floorplan shared between the kitchen, dining area and family room for easy entertaining. An owner’s suite enjoys a private location in a rear corner of the home, complemented by an en-suite bathroom and walk-in closet. There are three secondary bedrooms at the front of the home, which are comfortable spaces for household members and overnight guests. The completion date, prices and features may vary and are subject to change. Please verify with Lennar directly. Photos are for illustrative purposes only.
-
2026-05-04price $217,990 587-char remark
Show marketing remark (587 chars)
The Oxford Floor Plan - This single-level home showcases a spacious open floorplan shared between the kitchen, dining area and family room for easy entertaining. An owner’s suite enjoys a private location in a rear corner of the home, complemented by an en-suite bathroom and walk-in closet. There are three secondary bedrooms at the front of the home, which are comfortable spaces for household members and overnight guests. The completion date, prices and features may vary and are subject to change. Please verify with Lennar directly. Photos are for illustrative purposes only.
-
2026-04-16$219,990 Active 587-char remark
Show marketing remark (587 chars)
The Oxford Floor Plan - This single-level home showcases a spacious open floorplan shared between the kitchen, dining area and family room for easy entertaining. An owner’s suite enjoys a private location in a rear corner of the home, complemented by an en-suite bathroom and walk-in closet. There are three secondary bedrooms at the front of the home, which are comfortable spaces for household members and overnight guests. The completion date, prices and features may vary and are subject to change. Please verify with Lennar directly. Photos are for illustrative purposes only.
-
2026-04-16historical
Show marketing remark (587 chars)
The Oxford Floor Plan - This single-level home showcases a spacious open floorplan shared between the kitchen, dining area and family room for easy entertaining. An owner’s suite enjoys a private location in a rear corner of the home, complemented by an en-suite bathroom and walk-in closet. There are three secondary bedrooms at the front of the home, which are comfortable spaces for household members and overnight guests. The completion date, prices and features may vary and are subject to change. Please verify with Lennar directly. Photos are for illustrative purposes only.
-
2026-04-10price $219,990
-
2026-04-01price $225,990
-
2026-04-01$289,990 Active
ⓘ Source: listings_history table (triggers on properties + properties_extension) + one-shot
backfill from property_details.listing_events for pre-trigger history.
Nearby sold comps map
Loading sold comps map…
Walkable amenities ~0.75 mi
Loading nearby amenities…
Taxation est. · year 1
- Rental income
- $28,933
- − Mortgage interest
- −$11,527
- − Property taxes
- −$3,087
- − Insurance
- −$1,029
- − Repairs & maintenance
- −$2,315
- − Management
- −$2,315
- − HOA
- −$2,304
- − Depreciation
- −$5,987
- Taxable income
- $370
- Est. tax owed @ 24.0%
- −$89
- After-tax cash flow
- $3,398/yr
For passive investors: Depreciation is non-cash, so a rental often shows a tax loss while cash-flowing — sheltering income. Rental losses are passive: they offset passive income freely, and up to $25,000/yr can offset ordinary (W-2) income if you actively participate and your MAGI is under $100k (phasing out to $0 by $150k); unused losses carry forward. On sale, claimed depreciation is recaptured at up to 25%, and gains may owe capital-gains tax (a 1031 exchange can defer both). Figures are a year-1 estimate at your 24.0% rate — not tax advice; consult a CPA.
Condition & rehab AI · 12 photos
This single-family home presents as move-in ready with a good condition score and minimal repairs needed. The property offers a spacious open floorplan and modern finishes, making it an attractive option for both buyers and renters.
Value-add opportunities
- Both Painting exterior siding — Fresh paint can enhance curb appeal and property value.
- Both Landscaping improvements — Enhanced landscaping can boost curb appeal and attract potential buyers/tenants.
- Resale Kitchen appliances — Upgrading appliances can make the kitchen more appealing to potential buyers.
- Resale Bathroom fixtures — Modernizing bathrooms can improve the home's appeal and value.
- Resale Flooring in bathrooms — Replacing dated flooring can make bathrooms more appealing and increase value.
- Both Lighting fixtures — Upgrading lighting can improve the home's curb appeal and interior ambiance.
- Both Window treatments — Fresh window treatments can enhance curb appeal and interior aesthetics.
- Both Painting interior walls — Fresh paint can improve the home's curb appeal and interior ambiance.
- Both HVAC maintenance — Regular maintenance can improve air quality and energy efficiency, enhancing the home's appeal.
- Both Landscaping maintenance — Regular maintenance can keep the landscaping looking its best and attract potential buyers/tenants.
Renovation cost estimate screening
Value-add ROI direction
- Both Painting exterior siding — Fresh paint can enhance curb appeal and property value. ↑
- Both Landscaping improvements — Enhanced landscaping can boost curb appeal and attract potential buyers/tenants. ↑
- Resale Kitchen appliances — Upgrading appliances can make the kitchen more appealing to potential buyers. ↑
- Resale Bathroom fixtures — Modernizing bathrooms can improve the home's appeal and value. ↑
- Resale Flooring in bathrooms — Replacing dated flooring can make bathrooms more appealing and increase value. ↑
- Both Lighting fixtures — Upgrading lighting can improve the home's curb appeal and interior ambiance. ↑
- Both Window treatments — Fresh window treatments can enhance curb appeal and interior aesthetics. ↑
- Both Painting interior walls — Fresh paint can improve the home's curb appeal and interior ambiance. ↑
- Both HVAC maintenance — Regular maintenance can improve air quality and energy efficiency, enhancing the home's appeal. ↑
- Both Landscaping maintenance — Regular maintenance can keep the landscaping looking its best and attract potential buyers/tenants. ↑
ⓘ Cost ranges are severity-bucket heuristics (US national rule-of-thumb). Get contractor quotes + a written scope before underwriting a rehab budget.
Schools (NCES district)
- District
- Crosby ISD
- NCES district ID
- 4815750
- Math proficiency
- 39% ▼ -13.00%
- Reading proficiency
- 40% ▼ -5.00%
- Median HH income
- $61,079
- Composite
- 35.14/100
- National rank
- #5012
- State rank
- #369 of 826 in TX
Livability — Houston
- Score
- 74/100
- State rank
- #184
- US rank
- #4771
Category grades
Schools grade is shown separately in the Schools card above.
Census & demographics
- County
- Harris County · 4,702,590 people
- City population
- 3,226,434
- Metro
- Houston-The Woodlands-Sugar Land, TX
- Population (ZIP)
- 33,780
- Household income
- $92,201
- Rent vs Own
- Severe rent burden
- 382.0
Population outlook (Harris County) Hauer SSP2
- Today (2025)
- 5,571,493 people
- By 2030
- 6,089,821 · +9.3%
- By 2040
- 7,142,806 · +28.2%
- By 2050
- 8,185,864 · +46.9%
- By 2075
- 10,574,329 · +89.8%
- By 2100
- 12,109,958 · +117.4%
Race, ethnicity, and origin ACS 2023
- Neighborhood character
- Diverse neighborhood (Simpson 0.60)
- Race & ethnicity
- White 54% Hispanic / Latino 31% Two or more races 16% Black 9%
- Hispanic origin (detail)
- Mexican 24%
- Common ancestry
- Lithuanian 4% Romanian 3% Italian 2%
- Foreign-born
- 10% · Canada
- Languages at home
- 78% English-only · Spanish 21%
Political lean MEDSL · Harris
- 2024 margin
- Lean D (+5.5) · D 52.0% · R 46.4% · Other 1.6%
- 2008→2024 swing
- +3.9pp toward D · 2008: 1.6pp · 2024: 5.5pp
- All cycles
- 2024: D+5.5 2020: D+13.3 2016: D+12.4 2012: D+0.1 2008: D+1.6
Not yet ingested
- Civics
- —
Market trends
- HPI YoY
- ▼ -105.63%
- Current HPI
- 264.0126
- Rent YoY
- ▲ 1.48%
- Metro
- Houston-The Woodlands-Sugar Land, TX
- State GDP YoY
- ▲ 3.95%
- F500 in state
- 110
Industry mix (Fortune 500 HQ in TX)
| Industry | F500 HQs | Revenue |
|---|---|---|
| Energy | 16 | $1,198B |
|
||
| Technology | 5 | $198B |
|
||
| Engineering / Construction | 4 | $72B |
|
||
| Energy Services | 3 | $60B |
|
||
| Utilities | 3 | $41B |
|
||
| Healthcare | 2 | $330B |
|
||
Price history
-29.0% since first listed8 events — show timeline
- 2026-05-11 Pending — HARMLS
- 2026-05-07 Price Changed $205,790 HARMLS
- 2026-05-04 Price Changed $217,990 HARMLS
- 2026-04-16 Listing Removed — HARMLS
- 2026-04-16 Listed $219,990 HARMLS
- 2026-04-10 Price Changed $219,990 HARMLS
- 2026-04-01 Price Changed $225,990 HARMLS
- 2026-04-01 Listed $289,990 HARMLS
Cash-flow waterfall
monthlySold comps — $/sqft
last 12 mo · ≤1 miLoading sold comps…