 Duplex
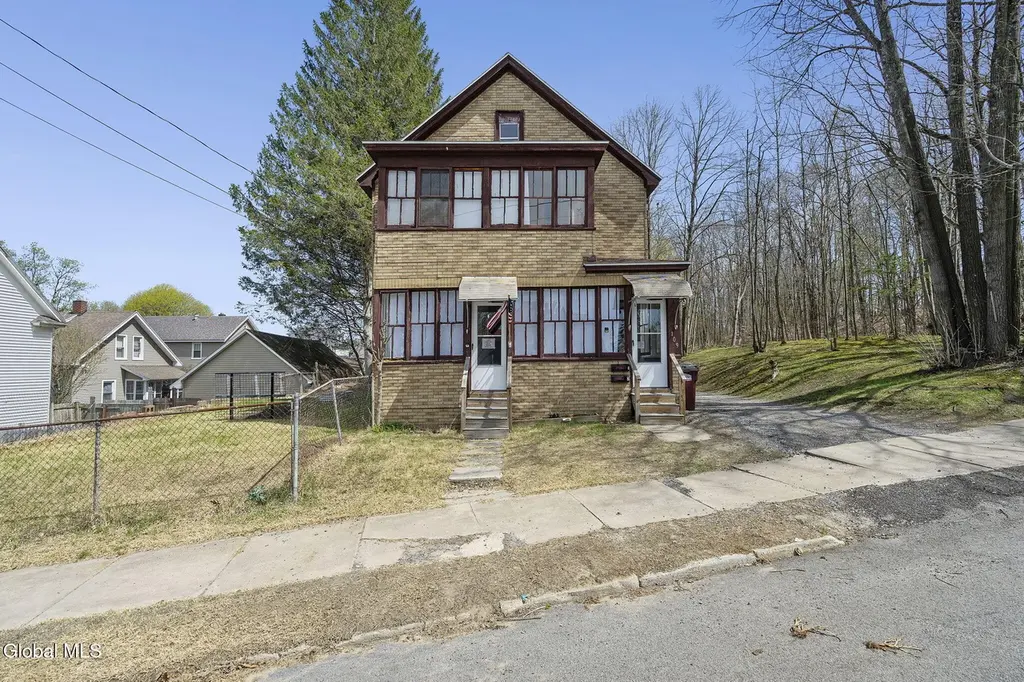
109 S Judson St · Gloversville, NY
Flood risk 1/10 · Minimal
- FEMA flood zone
- X
- Chance of flooding over 30 yrs
- 0.0%
- Est. flood insurance / yr
- $473 – $860
Fire risk 1/10 · Minimal
- Est. fire insurance / yr
- $691 – $1,283
Heat risk 2/10 · Minimal
- Hot days now (above 93°F)
- 7 days/yr
- Hot days in 30 yrs
- 16 days/yr
Wind risk 2/10 · Minimal
- Chance of severe wind over 30 yrs
- 3.0%
Air-quality risk 1/10 · Minimal
- Unhealthy air days now
- 0 days/yr
- Unhealthy air days in 30 yrs
- 0 days/yr
Risk factors via First Street. Map © Google.
Why this score? — see what drove the A- grade
The composite is a weighted blend of 9 inputs, each scored 0–100. Each bar is that input's sub-score; the figure is the points it added to the 100-point composite (weight × sub-score).
- Cash flow +30.0/30.0
- ARV discount +11.5/15.0
- 1% rule +10.0/10.0
- DSCR +10.0/10.0
- Appreciation +10.0/10.0
- Livability +4.1/5.0
- Schools +2.8/10.0
- Rent growth +2.5/5.0
- Condition / age +2.5/5.0
$134,900
🖨 Deal sheet (PDF) 📄 Offer letter ✓ Due diligence
Multi-family units
County records classify this as Multi-Family (2-4 Unit). Listing-text estimate: 2 units. confirmed
Listing remarks MLS
PRICE DROP!-TURN KEY Investment Property w/LONG TERM TENANTS & Extra Wooded Lots! Main property, you'll own two additional lots(113 S Judson St and 55 Eagle St).Property already generates a strong gross rental income of $17,700 per year from long-term renters & there's room for growth. Low taxes make this an even more attractive investment. Roof is +/-5yrs w/ new wood. New tub surronds in both units, +/-2years gravel driveway. Unattached two car garage. Great potential for increased returns. Contact us today to make this exceptional investment property yours! Agent related to the seller.
Key facts
- Detached garage
- 5,662 sq ft lot
- 2 garage spots
Tags
Property features AI
Finance
- Financial info: Multifamily with 2 total units
Exterior
- Parking: Detached garage; 2 garage spaces; 6 total parking spaces
- Utilities: Public water; Public sewer
- Home design: Duplex; Two-unit property
- Construction: Shingle siding
- Exterior features: Lot approximately 0.13 acre
Interior
- Kitchen: Unit 1: 1 kitchen (1st floor); Unit 2: 1 kitchen (2nd floor)
- Bedrooms: Unit 1: 2 bedrooms (both on the 1st floor); Unit 2: 2 bedrooms (both on the 2nd floor)
- Bathrooms: 2 full bathrooms total; Unit 1: 1 full bath (1st floor); Unit 2: 1 full bath (2nd floor)
- Heating & cooling: Forced air heating; Natural gas heating
- Interior features: High-speed internet available; Unfinished basement
Neighborhood map
What this means for you Summary
Snapshot
- This is a 2 × 2-bed/1.0-bath units multifamily listed at $135k.
Deal economics
- At list price, monthly cash flow is $1k ($13k/yr) — positive. Per door: $555/mo.
- The deal already cash-flows at list — no discount required.
- Meets the 1% rule at list price ($3k rent vs $135k).
- Recommended offer: $131k (3.0% below list) — sets the bar for market timing.
Location & tenants
- Location reads 82/100 on livability (#70 in NY, #1,048 nationally) — a professional / high-income tenant draw. Strengths: amenities A+, commute A+, cost of living A+; Watch: employment F.
- Gloversville City School District (town): math 26% / reading 42% proficiency, ranked #565 of 590 in NY (top 96%) — families likely to look elsewhere, expect single-tenant / working-renter base with shorter leases.
- Zoned schools: Gloversville High School (math 82% / reading 77%, grade A-, #518 of 1,100 statewide, top 51%, 697 students, 71% FRL) — zoned schools average 71% FRL vs 54% district-wide (17 pts higher); higher-poverty schools than district average — tighter screening recommended.
- Zoned-school proficiency averages 80% at this address vs 34% district-wide (+46 pts) — the actual schools serving this property are materially stronger than the Gloversville City School District average implies; a family-tenant draw the district grade alone would hide.
- Market conditions: 172 active listings in the ZIP; 1 comparable units currently listed for rent nearby; 112 units permitted in Fulton County in 2024 (50 in 5+ unit buildings).
Forward outlook
- In year one you build about $14k of equity ($933 loan paydown + $13k appreciation (10.0% local appreciation)).
- Fulton County population projected at -23% by 2050 — secular population decline; favor cash flow + early exit over multi-decade hold.
- At projected returns (10.0% appreciation + 3.0% rent growth), your $38k cash investment doubles in ~2 years — after that, you're playing with house money.
- By year 3, paydown + projected appreciation supports a ~$37k cash-out refi (75% LTV) — recoverable capital for the next deal without selling this one.
Negotiation context
- It's been on market 52 days — a 3% lower offer ($131k) is reasonable based on typical stale-listing flexibility.
- 6 sale attempts since 9y ago with the ask held roughly flat each time — persistent listings suggest the price (not the market) is what's stuck; bring a comps-based counter.
- Current owner paid $105k; 28% above their basis — modest negotiation headroom, anchor on the comps not their cost.
Risks & watch-outs
- Watch-outs: built in 1900 — expect roof / HVAC / electrical / plumbing capex.
Questions for the listing agent
- It's been on market 52 days. Have you received any prior offers? Is the seller open to a 3% concession, seller financing, or rate buy-down credit?
- Can we see the unit-by-unit rent roll, current vacancy, and any below-market leases? What's the average tenancy length?
- What capital expenditures (roof, boiler, parking lot, exteriors) have been made in the last 5 years, and what's planned in the next 2?
- Built in 1900 — when were the roof, HVAC, electrical panel, plumbing, and water heater last replaced?
- Is there a deadline driving the sale (1031 exchange, divorce, estate, relocation)? That informs how much negotiation room exists.
- Schools are D-rated, which usually means shorter tenancies and higher turnover. Who's the typical renter profile here, and what's been the actual vacancy rate?
- What's the average days-on-market for RENTAL listings here right now (not sales)? A rising rental-DOM trend means longer vacancies and softer asking-rent achievability than the comps imply.
- What's the recent tenant-quality profile in this submarket — average credit score on applications, eviction rate, late-payment / NSF rate, and stable-employment percentage? A property-management company in the area should have these aggregated.
- How much new apartment / multifamily construction is in the pipeline within 1–3 miles? Heavy new supply (>2% of stock underway) typically softens rents 12–24 months out; light construction supports rent growth.
Investment metrics
- 1% rule
- 1.90% ✓
- Cap rate
- 16.17%
- Cash-on-cash
- 35.29%
- DSCR
- 2.57
- GRM
- 4.4
CMA / ARV
- ARV (median comp)
- $147,900
- List price
- $134,900
- Delta
- -8.79%
- Verdict
- FAIR
- Comps
- 20 within 1.0 mi
Show comp detail 8 sales within ~0.75 mi
| Address | Dist | Beds/Ba | Sqft | Sold | Price | $/sf | Match |
|---|---|---|---|---|---|---|---|
| 136 Prospect Ave | 0.69mi | 4/2.0 | 2,632 (-0%) | 6mo | $216,000 | $82 | 62 |
| 31 Steele Ave | 0.11mi | 5/2.0 (+1) | 2,886 (+9%) | 20mo | $90,000 | $31 | 58 |
| 53 Steele Ave | 0.04mi | 5/3.0 (+1) | 2,892 (+10%) | 19mo | $153,000 | $53 | 57 |
| 226 E Fulton St | 0.59mi | 3/1.5 (-1) | 2,345 (-11%) | 4mo | $137,000 | $58 | 44 |
| 128 Broad St | 0.73mi | 4/2.0 | 2,336 (-12%) | 6mo | $150,000 | $64 | 41 |
| 253 S Main St | 0.71mi | 5/2.0 (+1) | 2,400 (-9%) | 7mo | $110,000 | $46 | 41 |
| 63 W Pine St | 0.72mi | 5/3.0 (+1) | 2,749 (+4%) | 16mo | $219,000 | $80 | 37 |
| 5 Littauer Pl | 0.48mi | 4/3.0 | 3,032 (+15%) | 20mo | $165,000 | $54 | 33 |
Match score weights: distance 35% · size 25% · config 20% · recency 20%. Top-matched comps best support the ARV.
Projected returns pro-forma
10.0% appreciation · 3.0% rent growth · sell at horizon
- IRR
- 51.4%
- Equity multiple
- 4.82×
- Total profit
- $144,235
- Equity at exit
- $121,529
- IRR
- 45.0%
- Equity multiple
- 10.77×
- Total profit
- $369,169
- Equity at exit
- $262,081
Cash invested: $37,772 (down + closing). Projections, not guarantees.
Landlord ↔ Tenant lean methodology
- Overall (STATE)
- 15 Strongly Tenant-Friendly
- State New York
- 15 Strongly Tenant-Friendly · D+10
- County
- — inherits STATE
- City
- — inherits STATE
ZIP-level market 12078
- Home prices YoY
- 12.2%
- Active inventory
- 172
- Price-to-rent
- 8.8×
Monthly cashflow live
- Estimated rent
- $2,558 medium interval (Pro) →
- Mortgage (P&I)
- −$707
- Tax from tax record
- −$146 /mo · $1,758/yr
- Insurance
- −$56
- HOA
- −$0
- Vacancy / Maint / Mgmt
- −$537
- Net cashflow
- $1,111
Break-even live
Sensitivity live
| Price | -10% $1,187 | -5% $1,149 | +0% $1,111 | +5% $1,073 | +10% $1,034 |
|---|---|---|---|---|---|
| Rent | -10% $909 | -5% $1,010 | +0% $1,111 | +5% $1,212 | +10% $1,313 |
| Rate | -1.0pp $1,179 | -0.5pp $1,145 | base $1,111 | +0.5pp $1,076 | +1.0pp $1,040 |
2-unit breakdown (identical units grouped — click to expand)
| Units | Beds | Baths | Est. rent |
|---|---|---|---|
| 2× units | 2 | 1 | $2,558 |
| #1 | 2 | 1 | $1,279 |
| #2 | 2 | 1 | $1,279 |
| Total (2 units) | $2,558 | ||
UW: 25.0% down · 7.5% · 30yr · 1.5% tax · 5.0% vac · 8.0% maint · 8.0% mgmt
Financing live
Cash to close
- Down payment
- $33,725
- Closing costs
- $4,047
- Reserves months
- —
- Total cash needed
- —
Loan-product check · same deal, 3 products live
Conventional
25% down · 7.5% · 30yr
- Down + closing
- —
- Monthly P&I
- —
- Monthly cashflow
- —
- DSCR
- —
- Eligible?
- —
Personal DTI + credit; lowest rate.
DSCR
20% down · 8.5% · 30yr
- Down + closing
- —
- Monthly P&I
- —
- Monthly cashflow
- —
- DSCR
- —
- Eligible?
- —
No personal income docs; deal must DSCR.
Hard money
10% down · 12.0% · 12mo
- Down + closing
- —
- Monthly P&I
- —
- Monthly cashflow
- —
- DSCR
- —
- Eligible?
- —
Short-term bridge; refi at stabilization.
Rent comps 1 comps
| Address | Beds | Baths | Sqft | Rent | $/sqft | DOM | Units | Dist |
|---|---|---|---|---|---|---|---|---|
| 11 Fremont St Gloversville, NY | 2.0–3.0 | 1.5–2.0 | 1612 | $1,650 | $1.02 | 44d | 3 | 0.53mi |
Listing history 30 events
-
2026-06-16status $134,900 Pending 52 DOM
-
2026-06-15days on market $134,900 Active 52 DOM
-
2026-06-13days on market $134,900 Active 50 DOM
-
2026-06-12days on market $134,900 Active 49 DOM
-
2026-06-09days on market $134,900 Active 46 DOM
-
2026-06-08days on market $134,900 Active 45 DOM
-
2026-06-07days on market $134,900 Active 44 DOM
-
2026-06-07days on market $134,900 Active 43 DOM
-
2026-06-04days on market $134,900 Active 40 DOM
-
2026-06-02days on market $134,900 Active 39 DOM
-
2026-06-01days on market $134,900 Active 38 DOM
-
2026-05-31days on market $134,900 Active 37 DOM
-
2026-04-24$139,900 Active 405-char remark
-
2023-11-22soldstatus $105,000
-
2023-10-18soldstatus $105,000 Closed 602-char remark
Show marketing remark (602 chars)
PRICE DROP!-TURN KEY Investment Property w/LONG TERM TENANTS & Extra Wooded Lots! Main property, you'll own two additional lots(113 S Judson St and 55 Eagle St).Property already generates a strong gross rental income of $17,700 per year from long-term renters & there's room for growth. Low taxes make this an even more attractive investment. Roof is +/-5yrs w/ new wood. New tub surronds in both units, +/-2years gravel driveway. Unattached two car garage. Great potential for increased returns. Contact us today to make this exceptional investment property yours! Agent related to the seller.
-
2023-08-27historical Contingent 602-char remark
Show marketing remark (602 chars)
PRICE DROP!-TURN KEY Investment Property w/LONG TERM TENANTS & Extra Wooded Lots! Main property, you'll own two additional lots(113 S Judson St and 55 Eagle St).Property already generates a strong gross rental income of $17,700 per year from long-term renters & there's room for growth. Low taxes make this an even more attractive investment. Roof is +/-5yrs w/ new wood. New tub surronds in both units, +/-2years gravel driveway. Unattached two car garage. Great potential for increased returns. Contact us today to make this exceptional investment property yours! Agent related to the seller.
-
2023-08-05price $109,900 602-char remark
Show marketing remark (602 chars)
PRICE DROP!-TURN KEY Investment Property w/LONG TERM TENANTS & Extra Wooded Lots! Main property, you'll own two additional lots(113 S Judson St and 55 Eagle St).Property already generates a strong gross rental income of $17,700 per year from long-term renters & there's room for growth. Low taxes make this an even more attractive investment. Roof is +/-5yrs w/ new wood. New tub surronds in both units, +/-2years gravel driveway. Unattached two car garage. Great potential for increased returns. Contact us today to make this exceptional investment property yours! Agent related to the seller.
-
2023-07-06price $119,900 602-char remark
Show marketing remark (602 chars)
PRICE DROP!-TURN KEY Investment Property w/LONG TERM TENANTS & Extra Wooded Lots! Main property, you'll own two additional lots(113 S Judson St and 55 Eagle St).Property already generates a strong gross rental income of $17,700 per year from long-term renters & there's room for growth. Low taxes make this an even more attractive investment. Roof is +/-5yrs w/ new wood. New tub surronds in both units, +/-2years gravel driveway. Unattached two car garage. Great potential for increased returns. Contact us today to make this exceptional investment property yours! Agent related to the seller.
-
2023-06-15$129,900 Active 602-char remark
Show marketing remark (602 chars)
PRICE DROP!-TURN KEY Investment Property w/LONG TERM TENANTS & Extra Wooded Lots! Main property, you'll own two additional lots(113 S Judson St and 55 Eagle St).Property already generates a strong gross rental income of $17,700 per year from long-term renters & there's room for growth. Low taxes make this an even more attractive investment. Roof is +/-5yrs w/ new wood. New tub surronds in both units, +/-2years gravel driveway. Unattached two car garage. Great potential for increased returns. Contact us today to make this exceptional investment property yours! Agent related to the seller.
-
2022-11-16historical
-
2022-09-25price $119,000
-
2022-09-02$124,999 Active
-
2020-01-10historical
-
2020-01-10status Back On Market
-
2019-11-11historical
-
2019-09-23$42,900 New
-
2017-08-08soldstatus $33,000
-
2017-08-01soldstatus $33,000 Closed (Final Sale)
-
2017-07-05status Pend (Under Cntr)
-
2017-06-09$39,000 New
ⓘ Source: listings_history table (triggers on properties + properties_extension) + one-shot
backfill from property_details.listing_events for pre-trigger history.
Tax reassessment forecast NY · Partial reset (capped growth)
- Current annual tax
- $1,758 · $146/mo
- Projected year-2 tax
- $2,019 · $168/mo
- Expected delta
- +$261/yr (+$22/mo · 14.8%)
ⓘ Screening estimate from a state-policy table — verify with the county assessor before closing.
Climate risk First Street
- Flood 1/10 Low FEMA zone X · 0% chance over 30 yrs
- Wildfire 1/10 Low
- Heat 2/10 Low 7 d/yr ≥93°F today · 16 d/yr by 30 yrs out
- Wind 2/10 Low 3% chance of damaging wind over 30 yrs
- Air quality 1/10 Low 0 unhealthy d/yr today · 0 by 30 yrs out
Nearby sold comps map
Loading sold comps map…
Walkable amenities ~0.75 mi
Loading nearby amenities…
Taxation est. · year 1
- Rental income
- $30,696
- − Mortgage interest
- −$7,556
- − Property taxes
- −$1,758
- − Insurance
- −$674
- − Repairs & maintenance
- −$2,456
- − Management
- −$2,456
- − Depreciation
- −$3,924
- Taxable income
- $11,871
- Est. tax owed @ 24.0%
- −$2,849
- After-tax cash flow
- $10,479/yr
For passive investors: Depreciation is non-cash, so a rental often shows a tax loss while cash-flowing — sheltering income. Rental losses are passive: they offset passive income freely, and up to $25,000/yr can offset ordinary (W-2) income if you actively participate and your MAGI is under $100k (phasing out to $0 by $150k); unused losses carry forward. On sale, claimed depreciation is recaptured at up to 25%, and gains may owe capital-gains tax (a 1031 exchange can defer both). Figures are a year-1 estimate at your 24.0% rate — not tax advice; consult a CPA.
Schools (NCES district)
- District
- Gloversville City School District
- NCES district ID
- 3612270
- Math proficiency
- 26% ▼ -6.00%
- Reading proficiency
- 42% ▲ 7.00%
- Median HH income
- $36,775
- Composite
- 28.2/100
- National rank
- #6806
- State rank
- #565 of 590 in NY
Livability — Gloversville
- Score
- 82/100
- State rank
- #70
- US rank
- #1048
Category grades
Schools grade is shown separately in the Schools card above.
Census & demographics
- Census place
- Gloversville, NY
- Population (ZIP)
- 23,087
Population outlook (Fulton County) Hauer SSP2
- Today (2025)
- 51,132 people
- By 2030
- 49,114 · -3.9%
- By 2040
- 44,373 · -13.2%
- By 2050
- 39,321 · -23.1%
- By 2075
- 28,503 · -44.3%
- By 2100
- 19,268 · -62.3%
Race, ethnicity, and origin ACS 2023
- Neighborhood character
- Predominantly White (86%)
- Race & ethnicity
- White 86% Two or more races 8% Hispanic / Latino 5% Black 2% Asian 1%
- Hispanic origin (detail)
- Puerto Rican 3%
- Common ancestry
- Lithuanian 5% Romanian 4% Iranian 4%
- Foreign-born
- 2% · Canada, China
- Languages at home
- 97% English-only · Spanish 2%
Political lean MEDSL · Fulton
- 2024 margin
- Solid R (+35.9) · D 32.1% · R 67.9%
- 2008→2024 swing
- -26.6pp toward R · 2008: -9.2pp · 2024: -35.9pp
- All cycles
- 2024: R+35.9 2020: R+31.4 2016: R+35.5 2012: R+10.5 2008: R+9.2
Not yet ingested
- Civics
- —
Market trends
- HPI YoY
- ▲ 34.22%
- Current HPI
- 315.1368
- Rent YoY
- —
- Metro
- —
- State GDP YoY
- ▲ 2.60%
- F500 in state
- 92
Industry mix (Fortune 500 HQ in NY)
| Industry | F500 HQs | Revenue |
|---|---|---|
| Financial Services | 10 | $950B |
|
||
| Consumer Goods | 9 | $162B |
|
||
| Insurance | 4 | $225B |
|
||
| Telecommunications | 2 | $144B |
|
||
| Pharmaceuticals | 2 | $112B |
|
||
| Media / Entertainment | 2 | $69B |
|
||
Price history
+245.9% since first listed20 events — show timeline
- 2026-06-15 Pending — Global MLS
- 2026-05-27 Price Changed $134,900 Global MLS
- 2026-04-24 Listed $139,900 Global MLS
- 2023-11-22 Sold (Public Records) $105,000 Public Records
- 2023-10-18 Sold (MLS) $105,000 Global MLS
- 2023-08-27 Contingent — Global MLS
- 2023-08-05 Price Changed $109,900 Global MLS
- 2023-07-06 Price Changed $119,900 Global MLS
- 2023-06-15 Listed $129,900 Global MLS
- 2022-11-16 Listing Removed — Global MLS
- 2022-09-25 Price Changed $119,000 Global MLS
- 2022-09-02 Listed $124,999 Global MLS
- 2020-01-10 Listing Removed — Global MLS
- 2020-01-10 Relisted — Global MLS
- 2019-11-11 Listing Removed — Global MLS
- 2019-09-23 Listed $42,900 Global MLS
- 2017-08-08 Sold (Public Records) $33,000 Public Records
- 2017-08-01 Sold (MLS) $33,000 Global MLS
- 2017-07-05 Pending — Global MLS
- 2017-06-09 Listed $39,000 Global MLS
Property tax history
+1.1%/yrLatest (2025): $1,758 · +5.4% YoY. Source: county tax records.
Cash-flow waterfall
monthlySold comps — $/sqft
last 12 mo · ≤1 miLoading sold comps…