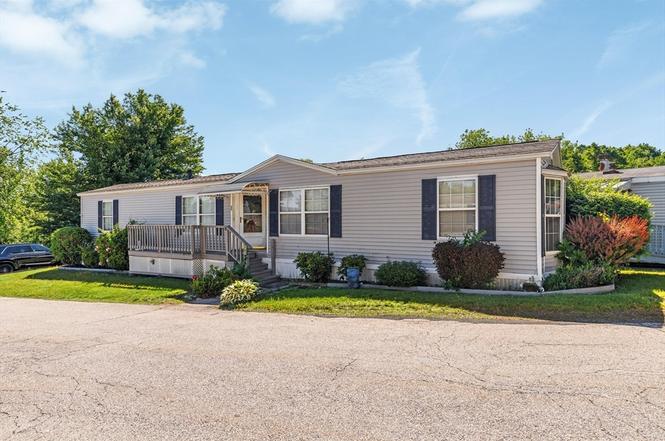
47 Washington St #1 · Auburn, MA
Flood risk 1/10 · Minimal
- FEMA flood zone
- X (unshaded)
- Chance of flooding over 30 yrs
- 0.0%
- Est. flood insurance / yr
- $507 – $1,088
Fire risk 1/10 · Minimal
- Est. fire insurance / yr
- $915 – $1,699
Heat risk 4/10 · Minor
- Hot days now (above 92°F)
- 7 days/yr
- Hot days in 30 yrs
- 16 days/yr
Wind risk 6/10 · Moderate
- Chance of severe wind over 30 yrs
- 27.0%
Air-quality risk 2/10 · Minimal
- Unhealthy air days now
- 1 days/yr
- Unhealthy air days in 30 yrs
- 2 days/yr
Risk factors via First Street. Map © Google.
Why this score? — see what drove the D grade
The composite is a weighted blend of 9 inputs, each scored 0–100. Each bar is that input's sub-score; the figure is the points it added to the 100-point composite (weight × sub-score).
- Cash flow +17.4/30.0
- DSCR +5.4/10.0
- 1% rule +4.7/10.0
- Schools +4.4/10.0
- Rent growth +2.5/5.0
- Livability +2.5/5.0
- Condition / age +2.5/5.0
- ARV discount +1.0/15.0
- Appreciation +0.0/10.0
$219,000
🖨 Deal sheet 📄 Offer letter ✓ Due diligence
Listing remarks MLS
Light, bright and airy, this nicely updated mobile home is being offered for sale! Conveniently located in the desirable over 55 community of Whispering Pines, you'll enjoy the ease of one level living and the unique affordability of a mobile home. Tastefully decorated, this home features vaulted ceilings, skylights and newer stainless steel appliances. Roof and central air done within past 5 years. Enjoy the new front porch and back deck with Durabuilt roof. The recent energy audit completed by Mass Save includes insulation, new fan, lighting and thermostats that added $13,000 worth of improvements! Laundry room off of kitchen includes washer and dryer. HOA fee is $615. Buyer is subject to park approval. 24 hour notice requested.
Key facts
- Updated mobile home
- Open floor plan
- One-level living
Tags
Property features AI
Finance
- HOA & community: Community amenities nearby: public transportation, shopping, pool, tennis courts, parks, walk/jog trails, stables, golf, medical facility, laundromat, bike path, conservation area, highway access, house of worship, marina, private and public schools, T-Station, university
Exterior
- Parking: Off-street paved parking; Deeded parking; 2 open parking spaces (total 2 spaces)
- Utilities: Public water; Public sewer; Electric with circuit breakers
- Home design: Modular mobile home; Gray exterior; Shingle roof
- Construction: Modular construction; Built per public records; No lead paint reported
- Exterior features: Porch; Wood deck; Exterior storage; Level lot; Paved road; Private road frontage; Publicly maintained road
Interior
- Kitchen: Range; Dishwasher; Refrigerator
- Flooring: Laminate
- Bathrooms: 1 full bathroom; 1 half bathroom
- Heating & cooling: Forced air heating (propane); Central air conditioning
- Interior features: Total of 4 rooms; Laminate flooring
- Laundry & utility: Washer hookup; Washer; Dryer
Neighborhood map
What this means for you Summary
Snapshot
- This is a 2-bed/1.5-bath manufactured listed at $219k.
Deal economics
- At list price, monthly cash flow is $165 ($2k/yr) — positive.
- The deal already cash-flows at list — no discount required.
- To meet the 1% rule (rent ≥ 1% of price), the offer needs to be $213k (3.0% below list).
- Recommended offer: $213k (3.0% below list) — sets the bar for 1% rule.
Location & tenants
- Location reads: area grade D — affects rentability + tenant quality, not the cash-flow math above.
- Auburn (suburban): math 45% / reading 54% proficiency, ranked #127 of 302 in MA (top 42%) — families likely to look elsewhere, expect single-tenant / working-renter base with shorter leases; only 18% free/reduced lunch — higher-income household profile.
- Market conditions: 28 active listings in the ZIP; 18 comparable units currently listed for rent nearby; rentals at typical pace (median 24d on market — plan ~3-4 weeks tenant-placement turnaround); 2,293 units permitted in Worcester County in 2024 (1,205 in 5+ unit buildings).
Forward outlook
- Local home prices are declining (-3.0%/yr); year-one equity from $2k of loan paydown is wiped out by about $7k of value loss. Plan a longer hold.
Negotiation context
- Only 6 days on market — expect competitive offers; lowballing is unlikely to land.
- 5 sale attempts since 19y ago with the ask held roughly flat each time — persistent listings suggest the price (not the market) is what's stuck; bring a comps-based counter.
Risks & watch-outs
- Climate carrying-cost: major wind risk, 27% chance of damaging wind over 30y — expect insurance premiums to compound above CPI over the hold.
Questions for the listing agent
- Is there a deadline driving the sale (1031 exchange, divorce, estate, relocation)? That informs how much negotiation room exists.
- The area grade is low — what's the realistic commute time and amenity access for the typical tenant pool here? Any planned neighborhood developments (good or bad) we should know about?
- What's the average days-on-market for RENTAL listings here right now (not sales)? A rising rental-DOM trend means longer vacancies and softer asking-rent achievability than the comps imply.
- What's the recent tenant-quality profile in this submarket — average credit score on applications, eviction rate, late-payment / NSF rate, and stable-employment percentage? A property-management company in the area should have these aggregated.
- How much new for-sale + rental construction is in the pipeline within 1–3 miles? Heavy new supply typically softens prices + rents 12–24 months out; constrained supply supports both.
Investment metrics
- 1% rule
- 0.97% ✗
- Cap rate
- 7.20%
- Cash-on-cash
- 3.23%
- DSCR
- 1.14
- GRM
- 8.6
CMA / ARV
- ARV (on-the-fly)
- $191,520
- Comps found
- 9
Show comp detail 9 sales within ~0.75 mi
| Address | Dist | Beds/Ba | Sqft | Sold | Price | $/sf | Match |
|---|---|---|---|---|---|---|---|
| 47 Washington St #16 | 0.00mi | 2/2.0 | 980 (-3%) | 12mo | $180,000 | $184 | 83 |
| 47 Washington St #7 | 0.00mi | 2/2.0 | 980 (-3%) | 14mo | $130,000 | $133 | 82 |
| 47 Washington St #47 | 0.13mi | 2/2.0 | 1,056 (+5%) | 4mo | $204,000 | $193 | 80 |
| 47 Washington St #45 | 0.13mi | 2/2.0 | 1,008 (0%) | 16mo | $195,000 | $193 | 78 |
| 47 Washington St #33 | 0.13mi | 2/1.0 | 924 (-8%) | 1mo | $199,900 | $216 | 77 |
| 47 Washington St #54 | 0.00mi | 2/2.0 | 1,100 (+9%) | 9mo | $199,000 | $181 | 75 |
| 113 Washington St #17 | 0.07mi | 2/2.0 | 1,064 (+6%) | 19mo | $190,000 | $179 | 69 |
| 3 Washington St #70 | 0.37mi | 2/2.0 | 924 (-8%) | 10mo | $195,000 | $211 | 59 |
| 557 Southwest Cutoff #70 | 0.36mi | 2/2.0 | 896 (-11%) | 23mo | $170,000 | $190 | 44 |
Match score weights: distance 35% · size 25% · config 20% · recency 20%. Top-matched comps best support the ARV.
Projected returns pro-forma
-3.0% appreciation · 3.0% rent growth · sell at horizon
- IRR
- -11.2%
- Equity multiple
- 0.59×
- Total profit
- $-24,927
- Equity at exit
- $32,654
- IRR
- -1.9%
- Equity multiple
- 0.87×
- Total profit
- $-8,020
- Equity at exit
- $18,935
Cash invested: $61,320 (down + closing). Projections, not guarantees.
Landlord ↔ Tenant lean methodology
- Overall (STATE)
- 20 Strongly Tenant-Friendly
- State Massachusetts
- 20 Strongly Tenant-Friendly · D+15
- County
- — inherits STATE
- City
- — inherits STATE
ZIP-level market 01501
- Active inventory
- 28
- Price-to-rent
- 8.6×
Monthly cashflow live
- Estimated rent
- $2,125 high interval (Pro) →
- Mortgage (P&I)
- −$1,148
- Tax est. 1.5%
- −$274 /mo · $3,285/yr
- Insurance
- −$91
- HOA
- −$0
- Vacancy / Maint / Mgmt
- −$446
- Net cashflow
- $165
Break-even live
UW: 25.0% down · 7.5% · 30yr · 1.5% tax · 5.0% vac · 8.0% maint · 8.0% mgmt
Financing live
Cash to close
- Down payment
- $54,750
- Closing costs
- $6,570
- Reserves months
- —
- Total cash needed
- —
Loan-product check · same deal, 3 products live
Conventional
25% down · 7.5% · 30yr
- Down + closing
- —
- Monthly P&I
- —
- Monthly cashflow
- —
- DSCR
- —
- Eligible?
- —
Personal DTI + credit; lowest rate.
DSCR
20% down · 8.5% · 30yr
- Down + closing
- —
- Monthly P&I
- —
- Monthly cashflow
- —
- DSCR
- —
- Eligible?
- —
No personal income docs; deal must DSCR.
Hard money
10% down · 12.0% · 12mo
- Down + closing
- —
- Monthly P&I
- —
- Monthly cashflow
- —
- DSCR
- —
- Eligible?
- —
Short-term bridge; refi at stabilization.
Rent comps 18 comps
| Address | Beds | Baths | Sqft | Rent | $/sqft | DOM | Units | Dist |
|---|---|---|---|---|---|---|---|---|
| 394 Greenwood St Unit B Millbury, MA | 2.0 | 1.0 | 900 | $2,200 | $2.44 | 14d | 1 | 1.15mi |
| 19 Kosta St Unit 3 Worcester, MA | 2.0 | 1.0 | 1055 | $1,700 | $1.61 | 44d | 1 | 1.21mi |
| 78 Greenwood St Unit 2 Worcester, MA | 3.0 | 1.0 | 1000 | $2,200 | $2.20 | 14d | 1 | 1.25mi |
| 28 Ekman St Apt 1 Worcester, MA | 3.0 | 1.0 | 900 | $2,200 | $2.44 | 44d | 1 | 1.30mi |
| 8 Beckman St Unit 2 Worcester, MA | 2.0 | 1.0 | 1300 | $2,350 | $1.81 | 44d | 1 | 1.31mi |
| 50 Whipple St Unit 1 Worcester, MA | 3.0 | 1.0 | 1292 | $2,600 | $2.01 | 14d | 1 | 1.31mi |
| 50 Whipple St Unit 2 Worcester, MA | 3.0 | 1.0 | 1292 | $2,500 | $1.93 | 14d | 1 | 1.31mi |
| 19 Reeves St Unit 3 Worcester, MA | 2.0 | 1.0 | 1100 | $2,199 | $2.00 | 23d | 1 | 1.33mi |
| 19 Reeves St Unit 1 Worcester, MA | 3.0 | 1.0 | 1100 | $2,300 | $2.09 | 23d | 1 | 1.33mi |
| 19 Reeves St Unit 2 Worcester, MA | 2.0 | 1.0 | 1100 | $2,200 | $2.00 | 23d | 1 | 1.33mi |
| 6 Ekman St Unit 3 Worcester, MA | 2.0 | 1.0 | 900 | $1,700 | $1.89 | 23d | 1 | 1.34mi |
| 10 Henry Ter Worcester, MA | 2.0 | 1.0 | 875 | $1,975 | $2.26 | 23d | 1 | 1.35mi |
| 9 Reeves St Unit C Worcester, MA | 2.0 | 1.0 | 1000 | $2,000 | $2.00 | 44d | 1 | 1.36mi |
| 9 Reeves St Unit B Worcester, MA | 2.0 | 1.0 | 935 | $2,100 | $2.25 | 44d | 1 | 1.36mi |
| 21 Whipple St #3 Worcester, MA | 2.0 | 1.0 | 1100 | $1,900 | $1.73 | 23d | 1 | 1.36mi |
| 10 Oswald St Unit 1 Worcester, MA | 2.0 | 1.0 | 835 | $1,700 | $2.04 | 14d | 1 | 1.37mi |
| 6 Oswald St Unit 1 Worcester, MA | 1.0 | 1.0 | 800 | $1,500 | $1.88 | 14d | 1 | 1.39mi |
| 7 Southbridge Street Ct Auburn, MA | 3.0 | 2.0 | 1372 | $3,250 | $2.37 | 21d | 1 | 1.48mi |
Listing history 6 events
-
2026-06-18days on market $219,000 Active 6 DOM
-
2026-06-17days on market $219,000 Active 5 DOM
-
2026-06-16statusdays on market $219,000 Active 4 DOM
-
2026-06-15days on market $219,000 New 3 DOM
-
2026-06-14remarks 699-char remark
-
2026-06-14$219,000 New 1 DOM
ⓘ Source: listings_history table (triggers on properties + properties_extension) + one-shot
backfill from property_details.listing_events for pre-trigger history.
Climate risk First Street
- Flood 1/10 Low FEMA zone X (unshaded) · 0% chance over 30 yrs
- Wildfire 1/10 Low
- Heat 4/10 Moderate 7 d/yr ≥92°F today · 16 d/yr by 30 yrs out
- Wind 6/10 Major 27% chance of damaging wind over 30 yrs
- Air quality 2/10 Low 1 unhealthy d/yr today · 2 by 30 yrs out
Nearby sold comps map
Loading sold comps map…
Walkable amenities ~0.75 mi
Loading nearby amenities…
Taxation est. · year 1
- Rental income
- $25,500
- − Mortgage interest
- −$12,267
- − Property taxes
- −$3,285
- − Insurance
- −$1,095
- − Repairs & maintenance
- −$2,040
- − Management
- −$2,040
- − Depreciation
- −$6,371
- Taxable loss
- −$1,598
- Est. tax savings @ 24.0%
- +$384
- After-tax cash flow
- $2,367/yr
For passive investors: Depreciation is non-cash, so a rental often shows a tax loss while cash-flowing — sheltering income. Rental losses are passive: they offset passive income freely, and up to $25,000/yr can offset ordinary (W-2) income if you actively participate and your MAGI is under $100k (phasing out to $0 by $150k); unused losses carry forward. On sale, claimed depreciation is recaptured at up to 25%, and gains may owe capital-gains tax (a 1031 exchange can defer both). Figures are a year-1 estimate at your 24.0% rate — not tax advice; consult a CPA.
Schools (NCES district)
- District
- Auburn
- NCES district ID
- 2502220
- Math proficiency
- 45% ▼ -12.00%
- Reading proficiency
- 54% ▼ -10.00%
- Median HH income
- $72,258
- Composite
- 44.47/100
- National rank
- #2801
- State rank
- #127 of 302 in MA
Livability — Auburn
No livability data for this city. (Only ~50 U.S. cities are tracked.)
Census & demographics
- Population (ZIP)
- 16,780
Population outlook (Worcester County) Hauer SSP2
- Today (2025)
- 850,858 people
- By 2030
- 860,403 · +1.1%
- By 2040
- 869,902 · +2.2%
- By 2050
- 869,110 · +2.1%
- By 2075
- 870,120 · +2.3%
- By 2100
- 829,703 · -2.5%
Race, ethnicity, and origin ACS 2023
- Neighborhood character
- Predominantly White (88%)
- Race & ethnicity
- White 88% Hispanic / Latino 5% Two or more races 5% Asian 3%
- Hispanic origin (detail)
- Puerto Rican 3%
- Common ancestry
- Lithuanian 12% Romanian 8% Slovak 2%
- Foreign-born
- 7% · Canada, Vietnam, China
- Languages at home
- 90% English-only · Spanish 3% Other Indo-European 2% Vietnamese 1%
Political lean MEDSL · Worcester
- 2024 margin
- D (+10.0) · D 53.9% · R 43.9% · Other 2.2%
- 2008→2024 swing
- -3.8pp toward R · 2008: 13.8pp · 2024: 10.0pp
- All cycles
- 2024: D+10.0 2020: D+17.8 2016: D+10.5 2012: D+9.2 2008: D+13.8
Not yet ingested
- Civics
- —
Market trends
- HPI YoY
- ▼ -225.04%
- Current HPI
- 270.6131
- Rent YoY
- —
- Metro
- —
- State GDP YoY
- ▲ 2.28%
- F500 in state
- 38
Industry mix (Fortune 500 HQ in MA)
| Industry | F500 HQs | Revenue |
|---|---|---|
| Technology | 3 | $17B |
|
||
| Insurance | 2 | $84B |
|
||
| Retail | 2 | $76B |
|
||
| Life Sciences | 1 | $43B |
|
||
| Energy Technology | 1 | $31B |
|
||
| Aerospace / Defense | 1 | $18B |
|
||
Price history
+119.2% since first listed16 events — show timeline
- 2026-06-12 Listed $219,000 MLS PIN
- 2024-02-22 Sold (MLS) $201,000 MLS PIN
- 2024-01-05 Pending — MLS PIN
- 2023-12-22 Contingent — MLS PIN
- 2023-12-09 Listed $210,000 MLS PIN
- 2020-05-20 Sold (MLS) $104,900 MLS PIN
- 2020-05-12 Pending — MLS PIN
- 2020-05-04 Contingent — MLS PIN
- 2020-04-13 Price Changed $114,900 MLS PIN
- 2020-04-13 Relisted — MLS PIN
- 2020-04-01 Listing Removed — MLS PIN
- 2020-01-15 Price Changed $119,500 MLS PIN
- 2019-12-09 Listed $122,500 MLS PIN
- 2007-08-29 Sold (MLS) $85,000 MLS PIN
- 2007-07-28 Listing Removed — MLS PIN
- 2007-01-18 Listed $99,900 MLS PIN
Cash-flow waterfall
monthlySold comps — $/sqft
last 12 mo · ≤1 miLoading sold comps…