4210 Allston St · Houston, TX
Flood risk 1/10 · Minimal
- FEMA flood zone
- X (unshaded)
- Chance of flooding over 30 yrs
- 0.0%
- Est. flood insurance / yr
- $507 – $1,088
Fire risk 1/10 · Minimal
- Est. fire insurance / yr
- $1,222 – $2,270
Heat risk 9/10 · Severe
- Hot days now (above 109°F)
- 7 days/yr
- Hot days in 30 yrs
- 24 days/yr
Wind risk 9/10 · Severe
- Chance of severe wind over 30 yrs
- 99.0%
Air-quality risk 3/10 · Minor
- Unhealthy air days now
- 2 days/yr
- Unhealthy air days in 30 yrs
- 3 days/yr
Risk factors via First Street. Map © Google.
Why this score? — see what drove the C- grade
The composite is a weighted blend of 9 inputs, each scored 0–100. Each bar is that input's sub-score; the figure is the points it added to the 100-point composite (weight × sub-score).
- Cash flow +23.0/30.0
- DSCR +7.4/10.0
- ARV discount +7.1/15.0
- 1% rule +5.2/10.0
- Livability +3.7/5.0
- Rent growth +2.8/5.0
- Schools +2.7/10.0
- Condition / age +2.5/5.0
- Appreciation +0.0/10.0
$200,000
🖨 Deal sheet (PDF) 📄 Offer letter ✓ Due diligence
Listing remarks MLS
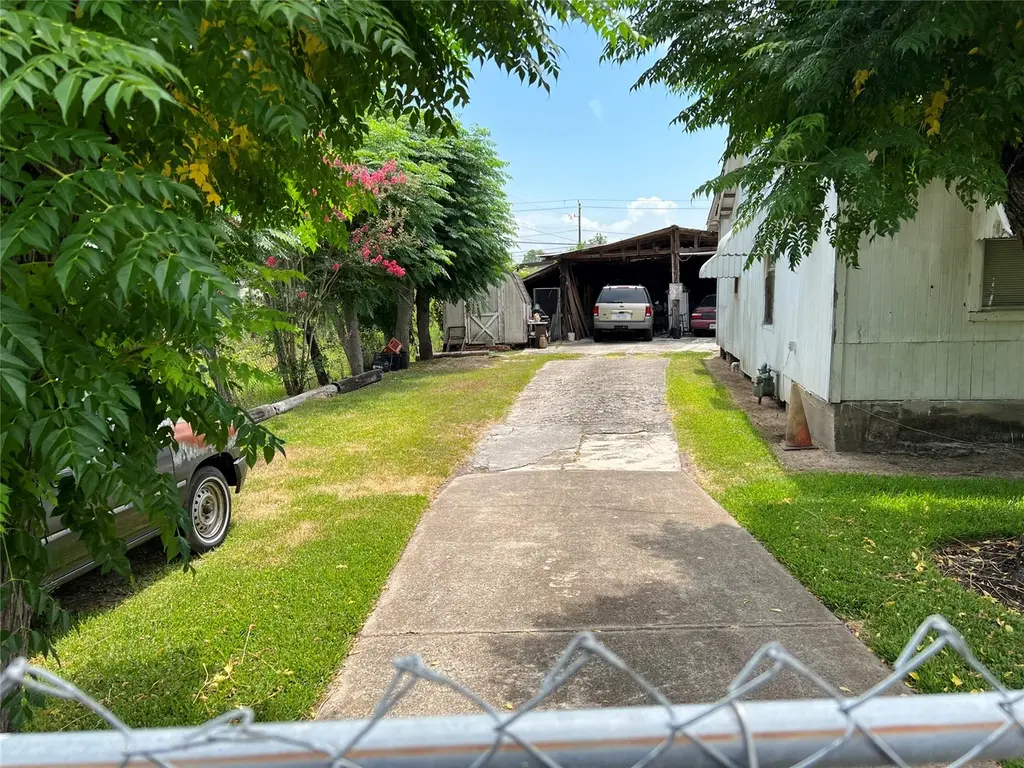
LOCATION Location L O C A T I O N !!! This is a rare opportunity to get in this super HOT neighborhood. 5,250+ sft lot, 0.8 mi from 610 Loop, Whole Foods Market, surrounded by new high-end construction. Reno or new construction value add. Present your offer. This will NOT last long.
Key facts
- 5,248 sq ft lot
- Built 1938
- Listed 746 days
Tags
Neighborhood map
What this means for you Summary
Snapshot
- This is a 2-bed/1.0-bath single-family listed at $200k.
Deal economics
- At list price, monthly cash flow is $356 ($4k/yr) — positive.
- The deal already cash-flows at list — no discount required.
- Meets the 1% rule at list price ($2k rent vs $200k).
- Recommended offer: $176k (12.0% below list) — sets the bar for market timing.
- Cap rate 8.4% vs local median 3.2% in Houston — top-decile yield for the area; either an underpriced asset or a hidden risk that comps aren't pricing in. Stress-test before assuming the spread holds.
Location & tenants
- Location reads 74/100 on livability (#184 in TX, #4,771 nationally) — a middle-class / working-renter tenant base. Strengths: amenities A+, cost of living A+, housing A+; Watch: crime F.
- Houston ISD (urban): math 27% / reading 35% proficiency, ranked #593 of 826 in TX (top 72%) — families likely to look elsewhere, expect single-tenant / working-renter base with shorter leases; 71% free/reduced lunch — lower-income household profile, screen leases tightly.
- Zoned schools: Kennedy El (math 16% / reading 25%, grade F, #3,515 of 4,322 statewide, top 82%, 517 students, 96% FRL); Williams Middle (math 9% / reading 15%, grade F, #1,623 of 1,662 statewide, top 98%, 411 students, 98% FRL); Washington B T H S (math 27% / reading 25%, grade F, #1,234 of 1,632 statewide, top 76%, 878 students, 96% FRL) — zoned schools average 97% FRL vs 71% district-wide (25 pts higher); higher-poverty schools than district average — tighter screening recommended.
- Market conditions: Rents rising (+1.1%/yr); 508 active listings in the ZIP; 40 comparable units currently listed for rent nearby; rentals at typical pace (median 17d on market — plan ~3-4 weeks tenant-placement turnaround); high-income renter base; 29,883 units permitted in Harris County in 2024 (8,621 in 5+ unit buildings).
Forward outlook
- Local home prices are declining (-3.0%/yr); year-one equity from $1k of loan paydown is wiped out by about $6k of value loss. Plan a longer hold.
- Harris County population projected at +47% by 2050 — long-run rental-demand tailwind backs the buy-and-hold thesis.
Negotiation context
- It's been on market 746 days — a 12% lower offer ($176k) is reasonable based on typical stale-listing flexibility.
- 2 sale attempts since 4y ago; this cycle's ask has dropped $100k (33%) from the opening price — seller is motivated, your offer sets the floor, not the list.
Risks & watch-outs
- Watch-outs: built in 1938 — expect roof / HVAC / electrical / plumbing capex.
- Climate carrying-cost: severe wind risk, 99% chance of damaging wind over 30y; extreme-heat days projected 7→24/yr by 2055 (HVAC capex compounding) — expect insurance premiums to compound above CPI over the hold.
Questions for the listing agent
- It's been on market 746 days. Have you received any prior offers? Is the seller open to a 12% concession, seller financing, or rate buy-down credit?
- Built in 1938 — when were the roof, HVAC, electrical panel, plumbing, and water heater last replaced?
- Why hasn't it sold? Are there any deal-killer items the seller is aware of (foundation, flood, title, zoning, code violations)?
- Is there a deadline driving the sale (1031 exchange, divorce, estate, relocation)? That informs how much negotiation room exists.
- Schools are D-rated, which usually means shorter tenancies and higher turnover. Who's the typical renter profile here, and what's been the actual vacancy rate?
- Crime grade is F in this area — have there been break-ins, vandalism, or insurance claims at this property in the last 3 years? What carrier currently insures it and at what premium?
- What's the average days-on-market for RENTAL listings here right now (not sales)? A rising rental-DOM trend means longer vacancies and softer asking-rent achievability than the comps imply.
- What's the recent tenant-quality profile in this submarket — average credit score on applications, eviction rate, late-payment / NSF rate, and stable-employment percentage? A property-management company in the area should have these aggregated.
- How much new for-sale + rental construction is in the pipeline within 1–3 miles? Heavy new supply typically softens prices + rents 12–24 months out; constrained supply supports both.
Investment metrics
- 1% rule
- 1.02% ✓
- Cap rate
- 8.43%
- Cash-on-cash
- 7.64%
- DSCR
- 1.34
- GRM
- 8.1
CMA / ARV
- ARV (median comp)
- $198,144
- List price
- $200,000
- Delta
- 0.94%
- Verdict
- FAIR
- Comps
- 20 within 1.0 mi
Show comp detail 12 sales within ~0.75 mi
| Address | Dist | Beds/Ba | Sqft | Sold | Price | $/sf | Match |
|---|---|---|---|---|---|---|---|
| 4330 Heite St | 0.37mi | 3/2.0 (+1) | 1,292 (+1%) | 7mo | $295,000 | $228 | 67 |
| 218 Victoria Dr | 0.71mi | 3/1.0 (+1) | 1,276 (-0%) | 1mo | $135,000 | $106 | 60 |
| 713 E 37th St | 0.69mi | 2/1.0 | 1,240 (-3%) | 4mo | $235,000 | $190 | 59 |
| 102 E 44th st St Unit B | 0.08mi | 3/2.5 (+1) | 1,406 (+10%) | 12mo | $315,000 | $224 | 58 |
| 330 Neyland St | 0.31mi | 3/2.5 (+1) | 1,427 (+12%) | 0mo | $309,900 | $217 | 55 |
| 312 W 32nd St | 0.61mi | 2/1.0 | 1,196 (-7%) | 6mo | $725,000 | $606 | 55 |
| 328 Neyland St | 0.30mi | 3/2.5 (+1) | 1,427 (+12%) | 1mo | $319,900 | $224 | 55 |
| 706 Jerry St | 0.58mi | 3/2.0 (+1) | 1,255 (-2%) | 8mo | $265,000 | $211 | 54 |
| 714 E 43rd St | 0.57mi | 3/1.0 (+1) | 1,327 (+4%) | 10mo | $199,000 | $150 | 54 |
| 411 E 37th St | 0.50mi | 3/2.0 (+1) | 1,365 (+7%) | 6mo | $230,000 | $168 | 51 |
| 4310 Busiek St | 0.66mi | 3/1.0 (+1) | 1,332 (+4%) | 9mo | $139,900 | $105 | 50 |
| 4305 Castor St | 0.73mi | 3/1.0 (+1) | 1,125 (-12%) | 6mo | $109,000 | $97 | 36 |
Match score weights: distance 35% · size 25% · config 20% · recency 20%. Top-matched comps best support the ARV.
Projected returns pro-forma
-3.0% appreciation · 1.08% rent growth · sell at horizon
- IRR
- -6.7%
- Equity multiple
- 0.76×
- Total profit
- $-13,634
- Equity at exit
- $29,821
- IRR
- 0.5%
- Equity multiple
- 1.03×
- Total profit
- $1,861
- Equity at exit
- $17,292
Cash invested: $56,000 (down + closing). Projections, not guarantees.
Landlord ↔ Tenant lean methodology
- Overall (STATE)
- 87 Strongly Landlord-Friendly
- State Texas
- 87 Strongly Landlord-Friendly · R+5
- County
- — inherits STATE
- City
- — inherits STATE
ZIP-level market 77018
- Rents YoY
- 1.1%
- Active inventory
- 508
- Price-to-rent
- 8.1×
Monthly cashflow live
- Estimated rent
- $2,046 high interval (Pro) →
- Mortgage (P&I)
- −$1,049
- Tax from tax record
- −$128 /mo · $1,534/yr
- Insurance
- −$83
- HOA
- −$0
- Vacancy / Maint / Mgmt
- −$430
- Net cashflow
- $356
Break-even live
Sensitivity live
| Price | -10% $470 | -5% $413 | +0% $356 | +5% $300 | +10% $243 |
|---|---|---|---|---|---|
| Rent | -10% $195 | -5% $276 | +0% $356 | +5% $437 | +10% $518 |
| Rate | -1.0pp $457 | -0.5pp $407 | base $356 | +0.5pp $305 | +1.0pp $252 |
UW: 25.0% down · 7.5% · 30yr · 1.5% tax · 5.0% vac · 8.0% maint · 8.0% mgmt
Financing live
Cash to close
- Down payment
- $50,000
- Closing costs
- $6,000
- Reserves months
- —
- Total cash needed
- —
Loan-product check · same deal, 3 products live
Conventional
25% down · 7.5% · 30yr
- Down + closing
- —
- Monthly P&I
- —
- Monthly cashflow
- —
- DSCR
- —
- Eligible?
- —
Personal DTI + credit; lowest rate.
DSCR
20% down · 8.5% · 30yr
- Down + closing
- —
- Monthly P&I
- —
- Monthly cashflow
- —
- DSCR
- —
- Eligible?
- —
No personal income docs; deal must DSCR.
Hard money
10% down · 12.0% · 12mo
- Down + closing
- —
- Monthly P&I
- —
- Monthly cashflow
- —
- DSCR
- —
- Eligible?
- —
Short-term bridge; refi at stabilization.
Rent comps 40 comps
| Address | Beds | Baths | Sqft | Rent | $/sqft | DOM | Units | Dist |
|---|---|---|---|---|---|---|---|---|
| 221 W 44th St Houston, TX | 3.0 | 2.0 | 1300 | $1,600 | $1.23 | 45d | 1 | 0.10mi |
| 221 Oriole St Houston, TX | 3.0 | 2.5 | 1461 | $2,083 | $1.43 | 26d | 1 | 0.12mi |
| 8502 N Main St Houston, TX | 3.0 | 2.0 | 1514 | $1,685 | $1.11 | 22d | 1 | 0.25mi |
| 268 W Crosstimbers St Houston, TX | 2.0 | 2.0 | 965 | $1,850 | $1.92 | 20d | 1 | 0.27mi |
| 148 Knightsbridge Park Ln Houston, TX | 3.0 | 2.5 | 1580 | $2,500 | $1.58 | 45d | 1 | 0.49mi |
| 641 W Crosstimbers St Houston, TX | 1.0–2.0 | 1.0–2.0 | 866 | $2,237 | $2.58 | 1d | 38 | 0.50mi |
| 611 E 39th St Houston, TX | 2.0 | 2.0 | 1326 | $2,099 | $1.58 | 45d | 1 | 0.53mi |
| 538 E 38th St Houston, TX | 3.0 | 2.5 | 1521 | $2,300 | $1.51 | 45d | 1 | 0.54mi |
| 4515 Oxford St Houston, TX | 2.0 | 1.0 | 950 | $950 | $1.00 | 45d | 1 | 0.58mi |
| 316 Thornton Rd Houston, TX | 3.0 | 3.5 | 1828 | $2,500 | $1.37 | 45d | 1 | 0.58mi |
| 4513 Oxford St Houston, TX | 2.0 | 1.0 | 950 | $980 | $1.03 | 26d | 1 | 0.59mi |
| 4605 Lavatera St Houston, TX | 3.0 | 2.5 | 1686 | $2,265 | $1.34 | 1d | 1 | 0.63mi |
| 4605 Lavatera St Houston, TX | 3.0 | 2.5 | 1686 | $2,265 | $1.34 | 23d | 1 | 0.63mi |
| 322 E 33rd St Houston, TX | 2.0 | 1.0 | 1100 | $1,500 | $1.36 | 45d | 1 | 0.68mi |
| 3514 Ajax St Unit 1047956P Houston, TX | 3.0 | 2.5 | 1689 | $3,114 | $1.84 | 9d | 1 | 0.72mi |
| 619 Thornton Oaks Ln Unit Labs Houston, TX | 3.0 | 2.5 | 1657 | $2,200 | $1.33 | 9d | 1 | 0.80mi |
| 3411 N Shepherd Dr Houston, TX | 3.0 | 2.0 | 1165 | $1,910 | $1.64 | 45d | 1 | 0.82mi |
| 3405 N Shepherd Dr Houston, TX | 1.0–3.0 | 1.0–2.0 | 910 | $1,573 | $1.73 | 0d | 15 | 0.82mi |
| 4132 Europa St Houston, TX | 3.0 | 2.0 | 1259 | $1,430 | $1.14 | 14d | 1 | 0.82mi |
| 228 W 27th St Unit House Houston, TX | 3.0 | 2.0 | 1200 | $2,550 | $2.12 | 16d | 1 | 0.97mi |
| 823 North Loop Unit A Houston, TX | 3.0 | 2.0 | 1532 | $2,500 | $1.63 | 26d | 1 | 1.00mi |
| 880 W 34th St Unit 903 Houston, TX | 2.0 | 2.0 | 1027 | $2,255 | $2.20 | 13d | 1 | 1.03mi |
| 880 W 34th St Unit 2148 Houston, TX | 2.0 | 2.0 | 1027 | $2,255 | $2.20 | 0d | 1 | 1.03mi |
| 880 W 34th St Unit 3187 Houston, TX | 3.0 | 2.0 | 1512 | $2,858 | $1.89 | 4d | 1 | 1.03mi |
| 880 W 34th St Unit 2187 Houston, TX | 2.0 | 2.0 | 1027 | $2,306 | $2.25 | 6d | 1 | 1.03mi |
| 880 W 34th St Unit 3165 Houston, TX | 3.0 | 2.0 | 1512 | $2,818 | $1.86 | 0d | 1 | 1.03mi |
| 880 W 34th St Unit 2165 Houston, TX | 2.0 | 2.0 | 1027 | $2,296 | $2.24 | 0d | 1 | 1.03mi |
| 880 W 34th St Unit 422 Houston, TX | 2.0 | 2.0 | 1027 | $2,271 | $2.21 | 9d | 1 | 1.03mi |
| 880 W 34th St Unit 917 Houston, TX | 2.0 | 2.0 | 1027 | $2,295 | $2.23 | 12d | 1 | 1.03mi |
| 880 W 34th St Unit 3174 Houston, TX | 3.0 | 2.0 | 1512 | $2,858 | $1.89 | 12d | 1 | 1.03mi |
| 880 W 34th St Unit 2174 Houston, TX | 2.0 | 2.0 | 1027 | $2,306 | $2.25 | 12d | 1 | 1.03mi |
| 880 W 34th St Unit 913 Houston, TX | 3.0 | 2.0 | 1512 | $2,761 | $1.83 | 17d | 1 | 1.03mi |
| 4840 N Shepherd Dr Houston, TX | 3.0 | 1.0–2.0 | 870 | $2,057 | $2.36 | 5d | 21 | 1.04mi |
| 622 Janisch Rd Houston, TX | 3.0 | 4.0 | 1785 | $2,650 | $1.48 | 45d | 1 | 1.05mi |
| 5050 Yale St Unit 510 Houston, TX | 3.0 | 2.0 | 1020 | $1,200 | $1.18 | 0d | 1 | 1.06mi |
| 3409 Brinkman St Houston, TX | 1.0–2.0 | 1.0–2.0 | 982 | $2,445 | $2.49 | 0d | 38 | 1.09mi |
| 401 W 25th St Houston, TX | 1.0–2.0 | 1.0–2.0 | 974 | $3,481 | $3.57 | 3d | 19 | 1.09mi |
| 3014 Attridge Rd Houston, TX | 3.0 | 1.0 | 1300 | $2,100 | $1.62 | 45d | 1 | 1.14mi |
| 717 Janisch Rd Unit B Houston, TX | 3.0 | 3.5 | 1821 | $2,750 | $1.51 | 45d | 1 | 1.14mi |
| 717 Janisch Rd Unit B Houston, TX | 3.0 | 3.5 | 1821 | $2,750 | $1.51 | 26d | 1 | 1.14mi |
Listing history 32 events
-
2026-06-21days on market $200,000 Active 746 DOM
-
2026-06-18days on market $200,000 Active 743 DOM
-
2026-06-17days on market $200,000 Active 742 DOM
-
2026-06-16days on market $200,000 Active 741 DOM
-
2026-06-15days on market $200,000 Active 740 DOM
-
2026-06-13days on market $200,000 Active 738 DOM
-
2026-06-10days on market $200,000 Active 734 DOM
-
2026-06-08days on market $200,000 Active 733 DOM
-
2026-06-07days on market $200,000 Active 732 DOM
-
2026-06-04days on market $200,000 Active 729 DOM
-
2026-06-01days on market $200,000 Active 726 DOM
-
2026-05-31days on market $200,000 Active 725 DOM
-
2025-10-03price $200,000 288-char remark
Show marketing remark (288 chars)
LOCATION Location L O C A T I O N !!! This is a rare opportunity to get in this super HOT neighborhood. 5,250+ sft lot, 0.8 mi from 610 Loop, Whole Foods Market, surrounded by new high-end construction. Reno or new construction value add. Present your offer. This will NOT last long.
-
2025-08-12price $175,000 288-char remark
Show marketing remark (288 chars)
LOCATION Location L O C A T I O N !!! This is a rare opportunity to get in this super HOT neighborhood. 5,250+ sft lot, 0.8 mi from 610 Loop, Whole Foods Market, surrounded by new high-end construction. Reno or new construction value add. Present your offer. This will NOT last long.
-
2025-05-13price $185,000 288-char remark
Show marketing remark (288 chars)
LOCATION Location L O C A T I O N !!! This is a rare opportunity to get in this super HOT neighborhood. 5,250+ sft lot, 0.8 mi from 610 Loop, Whole Foods Market, surrounded by new high-end construction. Reno or new construction value add. Present your offer. This will NOT last long.
-
2025-04-22price $190,000 288-char remark
Show marketing remark (288 chars)
LOCATION Location L O C A T I O N !!! This is a rare opportunity to get in this super HOT neighborhood. 5,250+ sft lot, 0.8 mi from 610 Loop, Whole Foods Market, surrounded by new high-end construction. Reno or new construction value add. Present your offer. This will NOT last long.
-
2025-04-10price $200,000 288-char remark
Show marketing remark (288 chars)
LOCATION Location L O C A T I O N !!! This is a rare opportunity to get in this super HOT neighborhood. 5,250+ sft lot, 0.8 mi from 610 Loop, Whole Foods Market, surrounded by new high-end construction. Reno or new construction value add. Present your offer. This will NOT last long.
-
2025-04-05price $225,000 288-char remark
Show marketing remark (288 chars)
LOCATION Location L O C A T I O N !!! This is a rare opportunity to get in this super HOT neighborhood. 5,250+ sft lot, 0.8 mi from 610 Loop, Whole Foods Market, surrounded by new high-end construction. Reno or new construction value add. Present your offer. This will NOT last long.
-
2024-08-16price $249,000 288-char remark
Show marketing remark (288 chars)
LOCATION Location L O C A T I O N !!! This is a rare opportunity to get in this super HOT neighborhood. 5,250+ sft lot, 0.8 mi from 610 Loop, Whole Foods Market, surrounded by new high-end construction. Reno or new construction value add. Present your offer. This will NOT last long.
-
2024-06-11price $250,000 288-char remark
Show marketing remark (288 chars)
LOCATION Location L O C A T I O N !!! This is a rare opportunity to get in this super HOT neighborhood. 5,250+ sft lot, 0.8 mi from 610 Loop, Whole Foods Market, surrounded by new high-end construction. Reno or new construction value add. Present your offer. This will NOT last long.
-
2024-06-05$300,000 Active 288-char remark
Show marketing remark (288 chars)
LOCATION Location L O C A T I O N !!! This is a rare opportunity to get in this super HOT neighborhood. 5,250+ sft lot, 0.8 mi from 610 Loop, Whole Foods Market, surrounded by new high-end construction. Reno or new construction value add. Present your offer. This will NOT last long.
-
2022-11-12historical
-
2022-11-03price $240,000
-
2022-10-14price $250,000
-
2022-08-23price $265,000
-
2022-08-15price $275,000
-
2022-08-11price $300,000
-
2022-08-07price $325,000
-
2022-08-01price $350,000
-
2022-07-26price $385,000
-
2022-07-15$400,000 Active
-
1988-01-02soldstatus
ⓘ Source: listings_history table (triggers on properties + properties_extension) + one-shot
backfill from property_details.listing_events for pre-trigger history.
Tax reassessment forecast TX · Resets to sale price
- Current annual tax
- $1,534 · $128/mo
- Projected year-2 tax
- $3,660 · $305/mo
- Expected delta
- +$2,126/yr (+$177/mo · 138.6%)
ⓘ Screening estimate from a state-policy table — verify with the county assessor before closing.
Climate risk First Street
- Flood 1/10 Low FEMA zone X (unshaded) · 0% chance over 30 yrs
- Wildfire 1/10 Low
- Heat 9/10 Extreme 7 d/yr ≥109°F today · 24 d/yr by 30 yrs out
- Wind 9/10 Extreme 99% chance of damaging wind over 30 yrs
- Air quality 3/10 Moderate 2 unhealthy d/yr today · 3 by 30 yrs out
Nearby sold comps map
Loading sold comps map…
Walkable amenities ~0.75 mi
Loading nearby amenities…
Taxation est. · year 1
- Rental income
- $24,552
- − Mortgage interest
- −$11,203
- − Property taxes
- −$1,534
- − Insurance
- −$1,000
- − Repairs & maintenance
- −$1,964
- − Management
- −$1,964
- − Depreciation
- −$5,818
- Taxable income
- $1,069
- Est. tax owed @ 24.0%
- −$256
- After-tax cash flow
- $4,020/yr
For passive investors: Depreciation is non-cash, so a rental often shows a tax loss while cash-flowing — sheltering income. Rental losses are passive: they offset passive income freely, and up to $25,000/yr can offset ordinary (W-2) income if you actively participate and your MAGI is under $100k (phasing out to $0 by $150k); unused losses carry forward. On sale, claimed depreciation is recaptured at up to 25%, and gains may owe capital-gains tax (a 1031 exchange can defer both). Figures are a year-1 estimate at your 24.0% rate — not tax advice; consult a CPA.
Schools (NCES district)
- District
- Houston ISD
- NCES district ID
- 4823640
- Math proficiency
- 27% ▼ -18.00%
- Reading proficiency
- 35% ▼ -6.00%
- Median HH income
- $46,054
- Composite
- 26.63/100
- National rank
- #7173
- State rank
- #593 of 826 in TX
Livability — Houston
- Score
- 74/100
- State rank
- #184
- US rank
- #4771
Category grades
Schools grade is shown separately in the Schools card above.
Census & demographics
- Census place
- Houston, TX
- County
- Harris County · 4,702,590 people
- City population
- 3,226,434
- Metro
- Houston-The Woodlands-Sugar Land, TX
- Population (ZIP)
- 31,031
- Household income
- $127,017
- Rent vs Own
- Severe rent burden
- 1324.0
Population outlook (Harris County) Hauer SSP2
- Today (2025)
- 5,571,493 people
- By 2030
- 6,089,821 · +9.3%
- By 2040
- 7,142,806 · +28.2%
- By 2050
- 8,185,864 · +46.9%
- By 2075
- 10,574,329 · +89.8%
- By 2100
- 12,109,958 · +117.4%
Race, ethnicity, and origin ACS 2023
- Neighborhood character
- Diverse neighborhood (Simpson 0.63)
- Race & ethnicity
- White 52% Hispanic / Latino 31% Two or more races 18% Black 8% Asian 3%
- Hispanic origin (detail)
- Mexican 23%
- Common ancestry
- Lithuanian 3% Romanian 3% Italian 2%
- Foreign-born
- 13% · Canada
- Languages at home
- 74% English-only · Spanish 22% Other Indo-European 1% French/Haitian/Cajun 1%
Political lean MEDSL · Harris
- 2024 margin
- Lean D (+5.5) · D 52.0% · R 46.4% · Other 1.6%
- 2008→2024 swing
- +3.9pp toward D · 2008: 1.6pp · 2024: 5.5pp
- All cycles
- 2024: D+5.5 2020: D+13.3 2016: D+12.4 2012: D+0.1 2008: D+1.6
Not yet ingested
- Civics
- —
Market trends
- HPI YoY
- ▼ -532.49%
- Current HPI
- 263.9321
- Rent YoY
- ▲ 1.08%
- Metro
- Houston-The Woodlands-Sugar Land, TX
- State GDP YoY
- ▲ 3.95%
- F500 in state
- 110
Industry mix (Fortune 500 HQ in TX)
| Industry | F500 HQs | Revenue |
|---|---|---|
| Energy | 16 | $1,198B |
|
||
| Technology | 5 | $198B |
|
||
| Engineering / Construction | 4 | $72B |
|
||
| Energy Services | 3 | $60B |
|
||
| Utilities | 3 | $41B |
|
||
| Healthcare | 2 | $330B |
|
||
Price history
-50.0% since first listed20 events — show timeline
- 2025-10-03 Price Changed $200,000 HARMLS
- 2025-08-12 Price Changed $175,000 HARMLS
- 2025-05-13 Price Changed $185,000 HARMLS
- 2025-04-22 Price Changed $190,000 HARMLS
- 2025-04-10 Price Changed $200,000 HARMLS
- 2025-04-05 Price Changed $225,000 HARMLS
- 2024-08-16 Price Changed $249,000 HARMLS
- 2024-06-11 Price Changed $250,000 HARMLS
- 2024-06-05 Listed $300,000 HARMLS
- 2022-11-12 Listing Removed — HARMLS
- 2022-11-03 Price Changed $240,000 HARMLS
- 2022-10-14 Price Changed $250,000 HARMLS
- 2022-08-23 Price Changed $265,000 HARMLS
- 2022-08-15 Price Changed $275,000 HARMLS
- 2022-08-11 Price Changed $300,000 HARMLS
- 2022-08-07 Price Changed $325,000 HARMLS
- 2022-08-01 Price Changed $350,000 HARMLS
- 2022-07-26 Price Changed $385,000 HARMLS
- 2022-07-15 Listed $400,000 HARMLS
- 1988-01-02 Sold (Public Records) — Public Records
Property tax history
+5.7%/yrLatest (2025): $1,534 · +11.7% YoY. Source: county tax records.
Cash-flow waterfall
monthlySold comps — $/sqft
last 12 mo · ≤1 miLoading sold comps…