 6-Plex
699 Hardtimes Rd · Hampden-Sydney, VA
Flood risk No data
- FEMA flood zone
- —
- Chance of flooding over 30 yrs
- —
- Est. flood insurance / yr
- —
Fire risk No data
- Est. fire insurance / yr
- —
Heat risk No data
- Hot days now (above threshold)
- —
- Hot days in 30 yrs
- —
Wind risk No data
- Chance of severe wind over 30 yrs
- —
Air-quality risk No data
- Unhealthy air days now
- —
- Unhealthy air days in 30 yrs
- —
Risk factors via First Street. Map © Google.
Why this score? — see what drove the B- grade
The composite is a weighted blend of 9 inputs, each scored 0–100. Each bar is that input's sub-score; the figure is the points it added to the 100-point composite (weight × sub-score).
- Cash flow +30.0/30.0
- 1% rule +10.0/10.0
- DSCR +10.0/10.0
- ARV discount +7.5/15.0
- Schools +3.0/10.0
- Rent growth +2.5/5.0
- Livability +2.5/5.0
- Condition / age +2.2/5.0
- Appreciation +0.0/10.0
$269,000
🖨 Deal sheet (PDF) 📄 Offer letter ✓ Due diligence
Multi-family units
County records classify this as Multi-Family (2-4 Unit). Listing-text estimate: 6 units. estimate disagrees with records
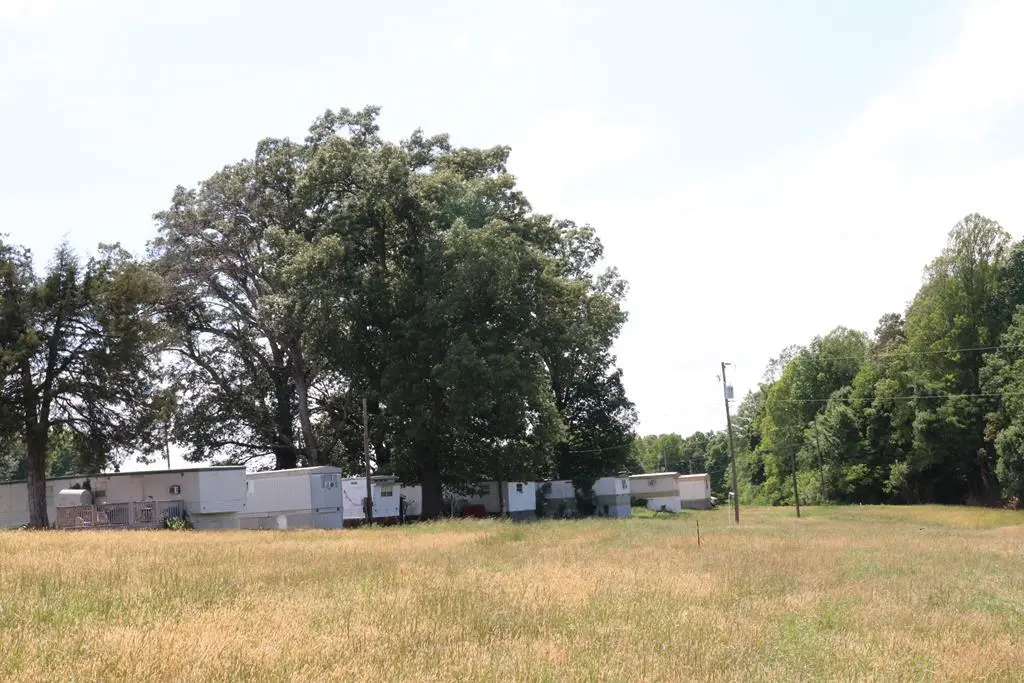
Listing remarks
Opportunity to own a Trailer Park located between Longwood University and Hampden-Sydney College. Nine mobile homes offering two-bedroom one bath units. New survey in 2016. One new septic system installed 2026 and the other was recently pumped. the property has two wells. New water pump installed 2025. approx. 400' deep. 7-homes rent for $400.00 monthly totaling $2,800. 1 home is free rent in exchange for lawn care service. Trash service runs $127.00 monthly and electric for the well averages $30.00 monthly. The tenants need 24-hour notice for all showings! Property being SOLD AS IS.
Key facts
- New septic system
- Two wells
- New water pump
Tags
Property features AI
Exterior
- Utilities: Shared well water; Septic tank sewer
- Home design: Residential income property; Multi-family
- Construction: Aluminum siding; Vinyl siding
- Exterior features: Metal roof
Interior
- Bathrooms: 9 full bathrooms
- Interior features: Nine full bathrooms
Neighborhood map
What this means for you Summary
Snapshot
- This is a 6 × 3-bed/1.5-bath units multifamily listed at $269k. Condition is rated fair.
Deal economics
- At list price, monthly cash flow is $5k ($57k/yr) — positive. Per door: $797/mo.
- The deal already cash-flows at list — no discount required.
- Meets the 1% rule at list price ($8k rent vs $269k).
- Recommended offer: $261k (3.0% below list) — sets the bar for market timing.
- Cap rate 27.6% vs local median 2.2% in Hampden-Sydney — top-decile yield for the area; either an underpriced asset or a hidden risk that comps aren't pricing in. Stress-test before assuming the spread holds.
Location & tenants
- Location reads: area grade B — affects rentability + tenant quality, not the cash-flow math above.
- Prince Edward County Public School District (town): math 25% / reading 48% proficiency, ranked #126 of 131 in VA (top 96%) — families likely to look elsewhere, expect single-tenant / working-renter base with shorter leases; 65% free/reduced lunch — lower-income household profile, screen leases tightly.
- Market conditions: 155 active listings in the ZIP; 65 units permitted in Prince Edward County in 2024 (5 in 5+ unit buildings).
Forward outlook
- Local home prices are declining (-3.0%/yr); year-one equity from $2k of loan paydown is wiped out by about $8k of value loss. Plan a longer hold.
- Prince Edward County population projected to shrink 9% by 2050 — rents likely to lag national; underwrite the cash flow, not the appreciation.
- At projected returns (-3.0% appreciation + 3.0% rent growth), your $75k cash investment doubles in ~2 years — after that, you're playing with house money.
Negotiation context
- It's been on market 37 days — a 3% lower offer ($261k) is reasonable based on typical stale-listing flexibility.
Questions for the listing agent
- It's been on market 37 days. Have you received any prior offers? Is the seller open to a 3% concession, seller financing, or rate buy-down credit?
- Can we see the unit-by-unit rent roll, current vacancy, and any below-market leases? What's the average tenancy length?
- What capital expenditures (roof, boiler, parking lot, exteriors) have been made in the last 5 years, and what's planned in the next 2?
- Have any recent inspections been done? Can we get a copy of the seller's disclosures and any deferred-maintenance estimates?
- Is there a deadline driving the sale (1031 exchange, divorce, estate, relocation)? That informs how much negotiation room exists.
- What's the average days-on-market for RENTAL listings here right now (not sales)? A rising rental-DOM trend means longer vacancies and softer asking-rent achievability than the comps imply.
- What's the recent tenant-quality profile in this submarket — average credit score on applications, eviction rate, late-payment / NSF rate, and stable-employment percentage? A property-management company in the area should have these aggregated.
- How much new apartment / multifamily construction is in the pipeline within 1–3 miles? Heavy new supply (>2% of stock underway) typically softens rents 12–24 months out; light construction supports rent growth.
Investment metrics
- 1% rule
- 3.12% ✓
- Cap rate
- 27.62%
- Cash-on-cash
- 76.17%
- DSCR
- 4.39
- GRM
- 2.7
CMA / ARV
No comps found within radius.
Projected returns pro-forma
-3.0% appreciation · 3.0% rent growth · sell at horizon
- IRR
- 76.1%
- Equity multiple
- 4.47×
- Total profit
- $261,039
- Equity at exit
- $40,109
- IRR
- 79.8%
- Equity multiple
- 9.23×
- Total profit
- $619,917
- Equity at exit
- $23,258
Cash invested: $75,320 (down + closing). Projections, not guarantees.
Landlord ↔ Tenant lean methodology
- Overall (STATE)
- 55 Moderately Landlord-Leaning
- State Virginia
- 55 Moderately Landlord-Leaning · D+2
- County
- — inherits STATE
- City
- — inherits STATE
ZIP-level market 23901
- Home prices YoY
- -21.9%
- Active inventory
- 155
- Price-to-rent
- 16.0×
Monthly cashflow live
- Estimated rent
- $8,405 medium interval (Pro) →
- Mortgage (P&I)
- −$1,411
- Tax est. 1.5%
- −$336 /mo · $4,035/yr
- Insurance
- −$112
- HOA
- −$0
- Vacancy / Maint / Mgmt
- −$1,765
- Net cashflow
- $4,781
Break-even live
Sensitivity live
| Price | -10% $4,967 | -5% $4,874 | +0% $4,781 | +5% $4,688 | +10% $4,595 |
|---|---|---|---|---|---|
| Rent | -10% $4,117 | -5% $4,449 | +0% $4,781 | +5% $5,113 | +10% $5,445 |
| Rate | -1.0pp $4,916 | -0.5pp $4,849 | base $4,781 | +0.5pp $4,711 | +1.0pp $4,640 |
6-unit breakdown (identical units grouped — click to expand)
| Units | Beds | Baths | Est. rent |
|---|---|---|---|
| 6× units | 3 | 1.5 | $8,406 |
| #1 | 3 | 1.5 | $1,401 |
| #2 | 3 | 1.5 | $1,401 |
| #3 | 3 | 1.5 | $1,401 |
| #4 | 3 | 1.5 | $1,401 |
| #5 | 3 | 1.5 | $1,401 |
| #6 | 3 | 1.5 | $1,401 |
| Total (6 units) | $8,405 | ||
UW: 25.0% down · 7.5% · 30yr · 1.5% tax · 5.0% vac · 8.0% maint · 8.0% mgmt
Financing live
Cash to close
- Down payment
- $67,250
- Closing costs
- $8,070
- Reserves months
- —
- Total cash needed
- —
Loan-product check · same deal, 3 products live
Conventional
25% down · 7.5% · 30yr
- Down + closing
- —
- Monthly P&I
- —
- Monthly cashflow
- —
- DSCR
- —
- Eligible?
- —
Personal DTI + credit; lowest rate.
DSCR
20% down · 8.5% · 30yr
- Down + closing
- —
- Monthly P&I
- —
- Monthly cashflow
- —
- DSCR
- —
- Eligible?
- —
No personal income docs; deal must DSCR.
Hard money
10% down · 12.0% · 12mo
- Down + closing
- —
- Monthly P&I
- —
- Monthly cashflow
- —
- DSCR
- —
- Eligible?
- —
Short-term bridge; refi at stabilization.
Listing history 17 events
-
2026-06-21days on market $269,000 Active 37 DOM
-
2026-06-18days on market $269,000 Active 35 DOM
-
2026-06-17days on market $269,000 Active 34 DOM
-
2026-06-16days on market $269,000 Active 33 DOM
-
2026-06-15days on market $269,000 Active 32 DOM
-
2026-06-15days on market $269,000 Active 31 DOM
-
2026-06-13days on market $269,000 Active 30 DOM
-
2026-06-12days on market $269,000 Active 29 DOM
-
2026-06-09days on market $269,000 Active 26 DOM
-
2026-06-08days on market $269,000 Active 25 DOM
-
2026-06-08days on market $269,000 Active 24 DOM
-
2026-06-07days on market $269,000 Active 23 DOM
-
2026-06-03days on market $269,000 Active 20 DOM
-
2026-06-02days on market $269,000 Active 19 DOM
-
2026-06-01days on market $269,000 Active 18 DOM
-
2026-05-31days on market $269,000 Active 17 DOM
-
2026-05-14$269,000 Active 590-char remark
ⓘ Source: listings_history table (triggers on properties + properties_extension) + one-shot
backfill from property_details.listing_events for pre-trigger history.
Nearby sold comps map
Loading sold comps map…
Walkable amenities ~0.75 mi
Loading nearby amenities…
Taxation est. · year 1
- Rental income
- $100,860
- − Mortgage interest
- −$15,068
- − Property taxes
- −$4,035
- − Insurance
- −$1,345
- − Repairs & maintenance
- −$8,069
- − Management
- −$8,069
- − Depreciation
- −$7,825
- Taxable income
- $56,449
- Est. tax owed @ 24.0%
- −$13,548
- After-tax cash flow
- $43,824/yr
For passive investors: Depreciation is non-cash, so a rental often shows a tax loss while cash-flowing — sheltering income. Rental losses are passive: they offset passive income freely, and up to $25,000/yr can offset ordinary (W-2) income if you actively participate and your MAGI is under $100k (phasing out to $0 by $150k); unused losses carry forward. On sale, claimed depreciation is recaptured at up to 25%, and gains may owe capital-gains tax (a 1031 exchange can defer both). Figures are a year-1 estimate at your 24.0% rate — not tax advice; consult a CPA.
Condition & rehab AI · 13 photos
This multi-family property requires extensive repairs and maintenance, including a new roof, exterior siding, flooring, and HVAC units. Landscaping and fencing also need attention. While the property is currently rented, significant improvements would increase its value and make it more attractive to potential buyers or renters.
Repairs flagged
- Major roof — Significant wear and tear on the roof.
- Major exterior siding — Peeling and significant wear on the exterior siding.
- Major flooring — Worn and in need of replacement.
- Major interior walls — Significant signs of wear and potential water damage.
- Major HVAC units — Old and may need replacement.
- Major landscaping — Overgrown and in need of maintenance.
- Major fencing — In poor condition and may need repair or replacement.
Value-add opportunities
- Both New roof — A new roof would significantly improve the home's appearance and increase its value.
- Both New exterior siding — New siding would improve the home's appearance and increase its value.
- Both New flooring — New flooring would improve the home's appearance and increase its value.
- Both New interior walls — New interior walls would improve the home's appearance and increase its value.
- Both New HVAC units — New HVAC units would improve the home's comfort and increase its value.
- Both Landscaping — Well-maintained landscaping would improve the home's curb appeal and increase its value.
- Both New fencing — New fencing would improve the home's security and increase its value.
Renovation cost estimate screening
| Repair item | Severity | Est. cost |
|---|---|---|
| roof · Significant wear and tear on the roof. | Major | $15,000–50,000 |
| exterior siding · Peeling and significant wear on the exterior siding. | Major | $15,000–50,000 |
| flooring · Worn and in need of replacement. | Major | $15,000–50,000 |
| interior walls · Significant signs of wear and potential water damage. | Major | $15,000–50,000 |
| HVAC units · Old and may need replacement. | Major | $15,000–50,000 |
| landscaping · Overgrown and in need of maintenance. | Major | $15,000–50,000 |
| fencing · In poor condition and may need repair or replacement. | Major | $15,000–50,000 |
| Total estimated repair cost · 7 items | $105,000–350,000 |
Value-add ROI direction
- Both New roof — A new roof would significantly improve the home's appearance and increase its value. ↑
- Both New exterior siding — New siding would improve the home's appearance and increase its value. ↑
- Both New flooring — New flooring would improve the home's appearance and increase its value. ↑
- Both New interior walls — New interior walls would improve the home's appearance and increase its value. ↑
- Both New HVAC units — New HVAC units would improve the home's comfort and increase its value. ↑
- Both Landscaping — Well-maintained landscaping would improve the home's curb appeal and increase its value. ↑
- Both New fencing — New fencing would improve the home's security and increase its value. ↑
ⓘ Cost ranges are severity-bucket heuristics (US national rule-of-thumb). Get contractor quotes + a written scope before underwriting a rehab budget.
Schools (NCES district)
- District
- Prince Edward County Public School District
- NCES district ID
- 5103060
- Math proficiency
- 25% ▼ -37.00%
- Reading proficiency
- 48% ▼ -12.00%
- Median HH income
- $39,482
- Composite
- 30.49/100
- National rank
- #6221
- State rank
- #126 of 131 in VA
Livability — Hampden-Sydney
No livability data for this city. (Only ~50 U.S. cities are tracked.)
Census & demographics
- City population
- 1,020
- Population (ZIP)
- 15,016
Population outlook (Prince Edward County) Hauer SSP2
- Today (2025)
- 24,387 people
- By 2030
- 24,161 · -0.9%
- By 2040
- 23,194 · -4.9%
- By 2050
- 22,292 · -8.6%
- By 2075
- 20,854 · -14.5%
- By 2100
- 19,030 · -22.0%
Race, ethnicity, and origin ACS 2023
- Neighborhood character
- Majority White (63%)
- Race & ethnicity
- White 63% Black 27% Two or more races 5% Hispanic / Latino 3% Pacific Islander 1%
- Common ancestry
- Italian 2% Serbian 1% Slovak 1%
- Foreign-born
- 3% · Canada
- Languages at home
- 96% English-only · Spanish 3%
Political lean MEDSL · Prince Edward
- 2024 margin
- Toss-up / Even · D 48.2% · R 50.7% · Other 1.1%
- 2008→2024 swing
- -12.5pp toward R · 2008: 9.9pp · 2024: -2.6pp
- All cycles
- 2024: R+2.6 2020: D+5.6 2016: D+5.4 2012: D+12.8 2008: D+9.9
Not yet ingested
- Civics
- —
Market trends
- HPI YoY
- ▼ -51.68%
- Current HPI
- 183.9782
- Rent YoY
- —
- Metro
- —
- State GDP YoY
- ▲ 2.40%
- F500 in state
- 50
Industry mix (Fortune 500 HQ in VA)
| Industry | F500 HQs | Revenue |
|---|---|---|
| Aerospace / Defense | 4 | $236B |
|
||
| Technology / Defense | 3 | $32B |
|
||
| Financial Services | 2 | $176B |
|
||
| Utilities | 2 | $27B |
|
||
| Insurance | 2 | $25B |
|
||
| Technology | 2 | $15B |
|
||
Price history
1 event — show timeline
- 2026-05-14 Listed $269,000 SCAR
Cash-flow waterfall
monthlySold comps — $/sqft
last 12 mo · ≤1 miLoading sold comps…