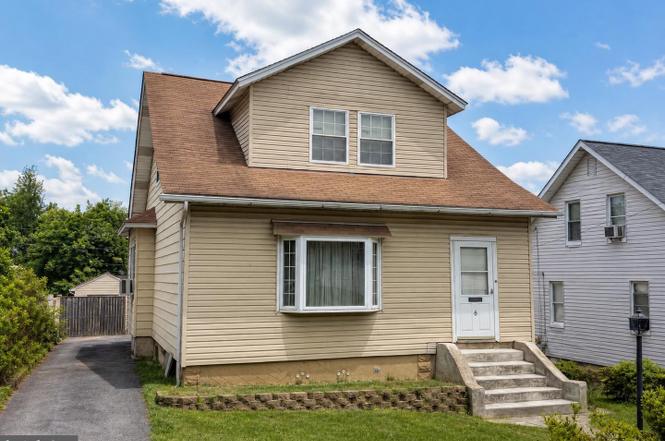
6 Chesley Ave · Overlea, MD
Flood risk 1/10 · Minimal
- FEMA flood zone
- X (unshaded)
- Chance of flooding over 30 yrs
- 0.0%
- Est. flood insurance / yr
- $473 – $860
Fire risk 1/10 · Minimal
- Est. fire insurance / yr
- $755 – $1,403
Heat risk 7/10 · Major
- Hot days now (above 103°F)
- 7 days/yr
- Hot days in 30 yrs
- 15 days/yr
Wind risk 6/10 · Moderate
- Chance of severe wind over 30 yrs
- 27.0%
Air-quality risk 4/10 · Minor
- Unhealthy air days now
- 5 days/yr
- Unhealthy air days in 30 yrs
- 7 days/yr
Risk factors via First Street. Map © Google.
Why this score? — see what drove the C+ grade
The composite is a weighted blend of 9 inputs, each scored 0–100. Each bar is that input's sub-score; the figure is the points it added to the 100-point composite (weight × sub-score).
- Cash flow +21.4/30.0
- ARV discount +15.0/15.0
- DSCR +6.8/10.0
- 1% rule +5.6/10.0
- Livability +4.0/5.0
- Rent growth +3.6/5.0
- Condition / age +2.5/5.0
- Schools +2.3/10.0
- Appreciation +0.0/10.0
$185,000
🖨 Deal sheet (PDF) 📄 Offer letter ✓ Due diligence
Listing remarks
3-bedroom, 1 full and 1 half bath detached Cape Cod in Overlea offering a renovation opportunity with significant transformation potential. The property requires a full rehabilitation, providing a blank canvas for extensive updates and customization. The home includes three upper-level bedrooms and a full bath, plus a partially finished lower level with a half bath and additional flexible space. An asphalt driveway provides off-street parking for up to five vehicles, adding valuable convenience for a future renovation project.
Key facts
- Off-street parking
- 7,250 sq ft lot
- 5 parking spots
Tags
Property features AI
Finance
- Financial info: Fee simple ownership
Exterior
- Parking: Asphalt driveway; Driveway parking (5 spaces); On-street parking
- Utilities: Natural gas for heating and hot water; Public water; Public sewer
- Home design: Detached structure; Block construction
- Construction: Block construction; Slab foundation; Major rehab needed
- Exterior features: Public water; Public sewer
Interior
- Bedrooms: Three bedrooms on the upper level
- Bathrooms: One full bathroom; One half bathroom
- Heating & cooling: Radiator heating; Natural gas heat; Natural gas hot water
- Interior features: Partial basement
Neighborhood map
What this means for you Summary
Snapshot
- This is a 3-bed/1.0-bath single-family listed at $185k.
Deal economics
- At list price, monthly cash flow is $274 ($3k/yr) — positive.
- The deal already cash-flows at list — no discount required.
- Meets the 1% rule at list price ($2k rent vs $185k).
- Cap rate 8.1% vs local median 5.3% in Overlea — top-decile yield for the area; either an underpriced asset or a hidden risk that comps aren't pricing in. Stress-test before assuming the spread holds.
Location & tenants
- Location reads 81/100 on livability (#38 in MD, #1,418 nationally) — a professional / high-income tenant draw. Strengths: amenities A+, commute A+, housing A+; Watch: crime F.
- Baltimore County Public Schools (suburban): math 15% / reading 34% proficiency, ranked #11 of 24 in MD (top 46%) — low school quality limits family demand, transient renter base, plan for 1-2y turnover.
- Market conditions: Rents rising fast (+4.4%/yr); 180 active listings in the ZIP; 17 comparable units currently listed for rent nearby; rentals at typical pace (median 25d on market — plan ~3-4 weeks tenant-placement turnaround); 1,511 units permitted in Baltimore County in 2024 (643 in 5+ unit buildings).
- This rent runs 36% of the median local income ($65k/yr) — at the standard rent-burdened threshold; future hikes will face affordability resistance.
Forward outlook
- Local home prices are declining (-3.0%/yr); year-one equity from $1k of loan paydown is wiped out by about $6k of value loss. Plan a longer hold.
- Baltimore County population projected at +12% by 2050 — modest demand growth; plan on rents tracking national, not racing it.
Negotiation context
- Only 4 days on market — expect competitive offers; lowballing is unlikely to land.
- Current owner paid $12k; list at $185k implies a 1509% gain — meaningful room to come down on a strong offer.
Risks & watch-outs
- Watch-outs: built in 1924 — expect roof / HVAC / electrical / plumbing capex.
- Climate carrying-cost: major wind risk, 27% chance of damaging wind over 30y; extreme-heat days projected 7→15/yr by 2055 (HVAC capex compounding) — expect insurance premiums to compound above CPI over the hold.
Questions for the listing agent
- Built in 1924 — when were the roof, HVAC, electrical panel, plumbing, and water heater last replaced?
- Is there a deadline driving the sale (1031 exchange, divorce, estate, relocation)? That informs how much negotiation room exists.
- Crime grade is F in this area — have there been break-ins, vandalism, or insurance claims at this property in the last 3 years? What carrier currently insures it and at what premium?
- What's the average days-on-market for RENTAL listings here right now (not sales)? A rising rental-DOM trend means longer vacancies and softer asking-rent achievability than the comps imply.
- What's the recent tenant-quality profile in this submarket — average credit score on applications, eviction rate, late-payment / NSF rate, and stable-employment percentage? A property-management company in the area should have these aggregated.
- How much new for-sale + rental construction is in the pipeline within 1–3 miles? Heavy new supply typically softens prices + rents 12–24 months out; constrained supply supports both.
Investment metrics
- 1% rule
- 1.06% ✓
- Cap rate
- 8.07%
- Cash-on-cash
- 6.36%
- DSCR
- 1.28
- GRM
- 7.9
CMA / ARV
- ARV (on-the-fly)
- $261,120
- Comps found
- 6
Show comp detail 6 sales within ~0.75 mi
| Address | Dist | Beds/Ba | Sqft | Sold | Price | $/sf | Match |
|---|---|---|---|---|---|---|---|
| 10 Walnut Ave | 0.07mi | 3/1.0 | 1,120 (+3%) | 16mo | $226,600 | $202 | 78 |
| 3801 W Overlea Ave | 0.37mi | 2/2.0 (-1) | 1,125 (+3%) | 1mo | $270,000 | $240 | 67 |
| 4006 Fleetwood Ave | 0.25mi | 3/2.0 | 1,200 (+10%) | 1mo | $226,000 | $188 | 66 |
| 709 Elmwood Rd | 0.43mi | 3/2.0 | 1,067 (-2%) | 15mo | $340,000 | $319 | 60 |
| 6619 Fairdel Ave | 0.62mi | 4/2.0 (+1) | 1,125 (+3%) | 14mo | $328,000 | $292 | 45 |
| 4313 Forest View Ave | 0.66mi | 3/2.0 | 1,244 (+14%) | 5mo | $172,000 | $138 | 38 |
Match score weights: distance 35% · size 25% · config 20% · recency 20%. Top-matched comps best support the ARV.
Projected returns pro-forma
-3.0% appreciation · 4.43% rent growth · sell at horizon
- IRR
- -4.9%
- Equity multiple
- 0.81×
- Total profit
- $-9,620
- Equity at exit
- $27,584
- IRR
- 6.4%
- Equity multiple
- 1.51×
- Total profit
- $26,284
- Equity at exit
- $15,995
Cash invested: $51,800 (down + closing). Projections, not guarantees.
Landlord ↔ Tenant lean methodology
- Overall (STATE)
- 27 Tenant-Leaning
- State Maryland
- 27 Tenant-Leaning · D+14
- County
- — inherits STATE
- City
- — inherits STATE
ZIP-level market 21206
- Rents YoY
- 4.4%
- Active inventory
- 180
- Price-to-rent
- 7.9×
Monthly cashflow live
- Estimated rent
- $1,955 high interval (Pro) →
- Mortgage (P&I)
- −$970
- Tax from tax record
- −$223 /mo · $2,671/yr
- Insurance
- −$77
- HOA
- −$0
- Vacancy / Maint / Mgmt
- −$411
- Net cashflow
- $274
Break-even live
Sensitivity live
| Price | -10% $379 | -5% $327 | +0% $274 | +5% $222 | +10% $170 |
|---|---|---|---|---|---|
| Rent | -10% $120 | -5% $197 | +0% $274 | +5% $352 | +10% $429 |
| Rate | -1.0pp $368 | -0.5pp $322 | base $274 | +0.5pp $227 | +1.0pp $178 |
UW: 25.0% down · 7.5% · 30yr · 1.5% tax · 5.0% vac · 8.0% maint · 8.0% mgmt
Financing live
Cash to close
- Down payment
- $46,250
- Closing costs
- $5,550
- Reserves months
- —
- Total cash needed
- —
Loan-product check · same deal, 3 products live
Conventional
25% down · 7.5% · 30yr
- Down + closing
- —
- Monthly P&I
- —
- Monthly cashflow
- —
- DSCR
- —
- Eligible?
- —
Personal DTI + credit; lowest rate.
DSCR
20% down · 8.5% · 30yr
- Down + closing
- —
- Monthly P&I
- —
- Monthly cashflow
- —
- DSCR
- —
- Eligible?
- —
No personal income docs; deal must DSCR.
Hard money
10% down · 12.0% · 12mo
- Down + closing
- —
- Monthly P&I
- —
- Monthly cashflow
- —
- DSCR
- —
- Eligible?
- —
Short-term bridge; refi at stabilization.
Rent comps 17 comps
| Address | Beds | Baths | Sqft | Rent | $/sqft | DOM | Units | Dist |
|---|---|---|---|---|---|---|---|---|
| 3807 Fleetwood Ave Unit 1 Baltimore, MD | 2.0 | 1.0 | 969 | $1,490 | $1.54 | 5d | 1 | 0.40mi |
| 3807 Fleetwood Ave Unit 2 Baltimore, MD | 3.0 | 1.0 | 937 | $1,550 | $1.65 | 5d | 1 | 0.40mi |
| 35-C Mopec Cir Nottingham, MD | 2.0 | 1.0 | 1100 | $1,445 | $1.31 | 0d | 9 | 0.43mi |
| 101 Elinor Ave Nottingham, MD | 4.0 | 2.0 | 1476 | $2,900 | $1.96 | 45d | 1 | 0.70mi |
| 6410 Walther Ave Baltimore, MD | 2.0 | 1.0–2.0 | 1195 | $1,995 | $1.67 | 45d | 7 | 0.73mi |
| 5110 Kenwood Ave Baltimore, MD | 3.0 | 1.5 | 1406 | $2,500 | $1.78 | 45d | 1 | 0.76mi |
| 5938 Clayton Ave Baltimore, MD | 4.0 | 2.0 | 1296 | $2,872 | $2.22 | 17d | 1 | 0.89mi |
| 3158 Woodring Ave Parkville, MD | 3.0 | 1.5 | 1500 | $1,950 | $1.30 | 25d | 1 | 0.98mi |
| 4111 Century Rd Baltimore, MD | 3.0 | 1.5 | 1432 | $2,500 | $1.75 | 45d | 1 | 1.09mi |
| 5906 Benton Heights Ave Baltimore, MD | 2.0 | 1.0 | 780 | $1,350 | $1.73 | 45d | 1 | 1.15mi |
| 3108 Glendale Ave Parkville, MD | 3.0 | 3.0 | 1224 | $2,550 | $2.08 | 25d | 1 | 1.16mi |
| 3010 Woodring Ave Unit 2 Baltimore, MD | 2.0 | 1.0 | 900 | $1,600 | $1.78 | 45d | 1 | 1.25mi |
| 5738 Cedonia Ave Baltimore, MD | 2.0 | 1.0 | 797 | $1,385 | $1.74 | 4d | 3 | 1.33mi |
| 3607 Bayonne Ave Unit 2 Baltimore, MD | 2.0 | 1.0 | 900 | $1,300 | $1.44 | 25d | 1 | 1.41mi |
| 4308 Hamilton Ave Baltimore, MD | 2.0 | 1.0 | 1110 | $1,416 | $1.28 | 25d | 1 | 1.44mi |
| 5676 Utrecht Rd Baltimore, MD | 3.0 | 2.0 | 1334 | $2,195 | $1.65 | 0d | 1 | 1.46mi |
| 5632 Belair Rd Baltimore, MD | 3.0 | 1.5 | 1260 | $2,100 | $1.67 | 25d | 1 | 1.50mi |
Listing history 5 events
-
2026-06-21days on market $185,000 Active 4 DOM
-
2026-06-18statusdays on market $185,000 Active 1 DOM
-
2026-06-17days on market $185,000 Coming Soon 2 DOM
-
2026-06-15remarks 532-char remark
-
2026-06-15$185,000 Coming Soon 1 DOM
ⓘ Source: listings_history table (triggers on properties + properties_extension) + one-shot
backfill from property_details.listing_events for pre-trigger history.
Tax reassessment forecast MD · Partial reset (capped growth)
- Current annual tax
- $2,671 · $223/mo
- Projected year-2 tax
- $2,671 · $223/mo
- Expected delta
- $0/yr ($0/mo · 0.0%)
ⓘ Screening estimate from a state-policy table — verify with the county assessor before closing.
Climate risk First Street
- Flood 1/10 Low FEMA zone X (unshaded) · 0% chance over 30 yrs
- Wildfire 1/10 Low
- Heat 7/10 Severe 7 d/yr ≥103°F today · 15 d/yr by 30 yrs out
- Wind 6/10 Major 27% chance of damaging wind over 30 yrs
- Air quality 4/10 Moderate 5 unhealthy d/yr today · 7 by 30 yrs out
Nearby sold comps map
Loading sold comps map…
Walkable amenities ~0.75 mi
Loading nearby amenities…
Taxation est. · year 1
- Rental income
- $23,458
- − Mortgage interest
- −$10,363
- − Property taxes
- −$2,671
- − Insurance
- −$925
- − Repairs & maintenance
- −$1,877
- − Management
- −$1,877
- − Depreciation
- −$5,382
- Taxable income
- $364
- Est. tax owed @ 24.0%
- −$87
- After-tax cash flow
- $3,206/yr
For passive investors: Depreciation is non-cash, so a rental often shows a tax loss while cash-flowing — sheltering income. Rental losses are passive: they offset passive income freely, and up to $25,000/yr can offset ordinary (W-2) income if you actively participate and your MAGI is under $100k (phasing out to $0 by $150k); unused losses carry forward. On sale, claimed depreciation is recaptured at up to 25%, and gains may owe capital-gains tax (a 1031 exchange can defer both). Figures are a year-1 estimate at your 24.0% rate — not tax advice; consult a CPA.
Schools (NCES district)
- District
- Baltimore County Public Schools
- NCES district ID
- 2400120
- Math proficiency
- 15% ▼ -16.00%
- Reading proficiency
- 34% ▼ -5.00%
- Median HH income
- $66,746
- Composite
- 23.17/100
- National rank
- #7948
- State rank
- #11 of 24 in MD
Livability — Overlea
- Score
- 81/100
- State rank
- #38
- US rank
- #1418
Category grades
Schools grade is shown separately in the Schools card above.
Census & demographics
- Census place
- Overlea, MD
- County
- Baltimore City · 558,601 people
- Metro
- Baltimore-Columbia-Towson, MD
- Population (ZIP)
- 48,902
- Household income
- $64,531
- Rent vs Own
- Severe rent burden
- 2317.0
Population outlook (Baltimore County) Hauer SSP2
- Today (2025)
- 885,518 people
- By 2030
- 909,272 · +2.7%
- By 2040
- 951,547 · +7.5%
- By 2050
- 990,955 · +11.9%
- By 2075
- 1,086,411 · +22.7%
- By 2100
- 1,135,078 · +28.2%
Race, ethnicity, and origin ACS 2023
- Neighborhood character
- Predominantly Black (73%)
- Race & ethnicity
- Black 73% White 20% Two or more races 3% Hispanic / Latino 3% Asian 2%
- Common ancestry
- Romanian 3% Ukrainian 1%
- Foreign-born
- 8% · Canada
- Languages at home
- 92% English-only · Spanish 2% Arabic 2% Other Indo-European 1%
Political lean MEDSL · Baltimore
- 2024 margin
- Strong D (+24.5) · D 61.0% · R 36.5% · Other 2.5%
- 2008→2024 swing
- +9.9pp toward D · 2008: 14.6pp · 2024: 24.5pp
- All cycles
- 2024: D+24.5 2020: D+27.0 2016: D+17.4 2012: D+16.4 2008: D+14.6
Not yet ingested
- Civics
- —
Market trends
- HPI YoY
- ▼ -191.83%
- Current HPI
- 284.5645
- Rent YoY
- ▲ 4.43%
- Metro
- Baltimore-Columbia-Towson, MD
- State GDP YoY
- ▲ 2.97%
- F500 in state
- 12
Industry mix (Fortune 500 HQ in MD)
| Industry | F500 HQs | Revenue |
|---|---|---|
| Aerospace / Defense | 1 | $71B |
|
||
| Utilities | 1 | $25B |
|
||
| Hotels | 1 | $24B |
|
||
| Consumer Goods | 1 | $7B |
|
||
| Real Estate | 1 | $6B |
|
||
| Chemicals | 1 | $2B |
|
||
Price history
+1508.7% since first listed2 events — show timeline
- 2026-06-15 Coming Soon $185,000 BRIGHT MLS
- 1961-10-18 Sold (Public Records) $11,500 Public Records
Property tax history
+2.6%/yrLatest (2025): $2,671 · +2.9% YoY. Source: county tax records.
Cash-flow waterfall
monthlySold comps — $/sqft
last 12 mo · ≤1 miLoading sold comps…