1291 Congress Rd · Columbia, SC
Flood risk 1/10 · Minimal
- FEMA flood zone
- X (unshaded)
- Chance of flooding over 30 yrs
- 0.0%
- Est. flood insurance / yr
- $507 – $1,088
Fire risk 5/10 · Moderate
- Est. fire insurance / yr
- $783 – $1,453
Heat risk 6/10 · Moderate
- Hot days now (above 108°F)
- 7 days/yr
- Hot days in 30 yrs
- 16 days/yr
Wind risk 6/10 · Moderate
- Chance of severe wind over 30 yrs
- 74.0%
Air-quality risk 3/10 · Minor
- Unhealthy air days now
- 2 days/yr
- Unhealthy air days in 30 yrs
- 3 days/yr
Risk factors via First Street. Map © Google.
Why this score? — see what drove the D grade
The composite is a weighted blend of 9 inputs, each scored 0–100. Each bar is that input's sub-score; the figure is the points it added to the 100-point composite (weight × sub-score).
- Appreciation +10.0/10.0
- Cash flow +7.5/30.0
- ARV discount +7.5/15.0
- Livability +3.9/5.0
- Schools +2.6/10.0
- Rent growth +2.5/5.0
- Condition / age +2.5/5.0
- 1% rule +2.1/10.0
- DSCR +1.6/10.0
$211,000
🖨 Deal sheet (PDF) 📄 Offer letter ✓ Due diligence
Listing remarks MLS
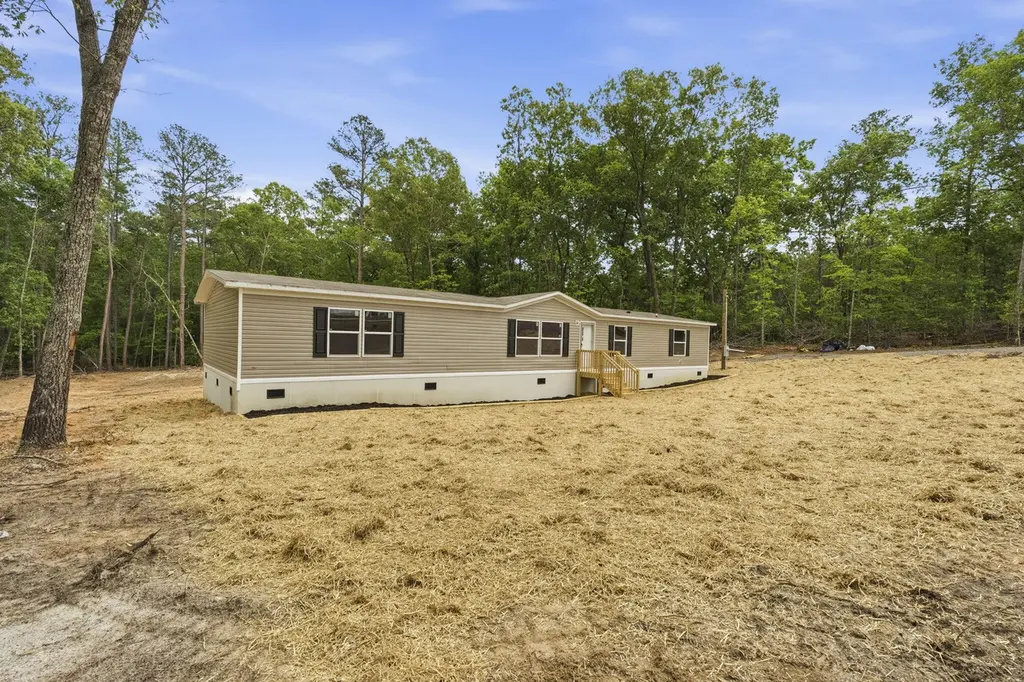
Seller is a SC licensed agent. Spacious country living on 2 beautiful acres! Brand new 5 bedroom, 3 bathroom manufactured home that has plenty of room for everyone. Enjoy an open floor plan with a large living area, modern kitchen with island, and a private owner's suite with a spacious bath and walk-in closet. Split bedroom layout provides added privacy, while the additional bedrooms for flexibility for guests, office space, or hobbies. Peaceful rural setting with room for gardening, animals, or outdoor entertaining, yet still convenient to Columbia, Shaw AFB, and local amenities. Move-in ready and everything is brand new including septic and well — don't miss this opportunity for affordable space and acreage!
Key facts
- Open floor plan
- Private owners suite
- Split bedroom layout
Tags
Property features AI
Exterior
- Utilities: Private well water; Septic sewer
- Home design: Single-family property
- Construction: Crawlspace foundation
- Exterior features: Vinyl exterior; Gravel road access; Property on 2 acres
Interior
- Bedrooms: Master bedroom on the main level
- Bathrooms: 3 full bathrooms
- Interior features: Central heating and central cooling
Neighborhood map
What this means for you Summary
Snapshot
- This is a 5-bed/3.0-bath manufactured listed at $211k.
Deal economics
- At list price, monthly cash flow is $-267 ($-3k/yr) — negative.
- To cash-flow at today's rent, offer at most $172k (18.3% below list).
- To meet the 1% rule (rent ≥ 1% of price), the offer needs to be $151k (28.5% below list).
- Recommended offer: $151k (28.5% below list) — sets the bar for 1% rule.
Location & tenants
- Location reads 78/100 on livability (#18 in SC, #2,436 nationally) — a middle-class / working-renter tenant base. Strengths: amenities A+, commute A+, cost of living A+; Watch: employment D, crime F.
- Richland 01 (urban): math 26% / reading 36% proficiency, ranked #54 of 80 in SC (top 68%) — families likely to look elsewhere, expect single-tenant / working-renter base with shorter leases; 64% free/reduced lunch — lower-income household profile, screen leases tightly.
- Zoned schools: Webber School (math 30% / reading 30%, grade F, #394 of 597 statewide, top 66%, 190 students, 100% FRL); Southeast Middle (math 7% / reading 19%, grade F, #210 of 229 statewide, top 93%, 493 students, 100% FRL); Lower Richland High (math 5% / reading 64%, grade F, #185 of 196 statewide, top 94%, 1,244 students, 100% FRL) — zoned schools average 100% FRL vs 64% district-wide (36 pts higher); higher-poverty schools than district average — tighter screening recommended.
- Market conditions: 54 active listings in the ZIP; 3,472 units permitted in Richland County in 2024 (1,096 in 5+ unit buildings).
Forward outlook
- In year one you build about $23k of equity ($1k loan paydown + $21k appreciation (10.0% local appreciation)).
- Richland County population projected at +30% by 2050 — long-run rental-demand tailwind backs the buy-and-hold thesis.
- By year 2, paydown + projected appreciation supports a ~$36k cash-out refi (75% LTV) — recoverable capital for the next deal without selling this one.
Negotiation context
- It's been on market 39 days — a 3% lower offer ($205k) is reasonable based on typical stale-listing flexibility.
- 2 sale attempts with the ask held roughly flat each time — persistent listings suggest the price (not the market) is what's stuck; bring a comps-based counter.
Risks & watch-outs
- Climate carrying-cost: major wind risk, 74% chance of damaging wind over 30y; moderate wildfire risk; extreme-heat days projected 7→16/yr by 2055 (HVAC capex compounding) — expect insurance premiums to compound above CPI over the hold.
Questions for the listing agent
- What do current leases actually rent for vs. the listed asking? Can we see a recent rent roll and the last 12 months of T-12 income?
- It's been on market 39 days. Have you received any prior offers? Is the seller open to a 29% concession, seller financing, or rate buy-down credit?
- Is there a deadline driving the sale (1031 exchange, divorce, estate, relocation)? That informs how much negotiation room exists.
- Schools are D-rated, which usually means shorter tenancies and higher turnover. Who's the typical renter profile here, and what's been the actual vacancy rate?
- Crime grade is F in this area — have there been break-ins, vandalism, or insurance claims at this property in the last 3 years? What carrier currently insures it and at what premium?
- The area grade is low — what's the realistic commute time and amenity access for the typical tenant pool here? Any planned neighborhood developments (good or bad) we should know about?
- What's the average days-on-market for RENTAL listings here right now (not sales)? A rising rental-DOM trend means longer vacancies and softer asking-rent achievability than the comps imply.
- What's the recent tenant-quality profile in this submarket — average credit score on applications, eviction rate, late-payment / NSF rate, and stable-employment percentage? A property-management company in the area should have these aggregated.
- How much new for-sale + rental construction is in the pipeline within 1–3 miles? Heavy new supply typically softens prices + rents 12–24 months out; constrained supply supports both.
Investment metrics
- 1% rule
- 0.71% ✗
- Cap rate
- 4.78%
- Cash-on-cash
- -5.42%
- DSCR
- 0.76
- GRM
- 11.7
CMA / ARV
No comps found within radius.
Projected returns pro-forma
10.0% appreciation · 3.0% rent growth · sell at horizon
- IRR
- 20.4%
- Equity multiple
- 2.66×
- Total profit
- $97,950
- Equity at exit
- $190,086
- IRR
- 18.6%
- Equity multiple
- 6.11×
- Total profit
- $301,853
- Equity at exit
- $409,927
Cash invested: $59,080 (down + closing). Projections, not guarantees.
Landlord ↔ Tenant lean methodology
- Overall (STATE)
- 90 Strongly Landlord-Friendly
- State South Carolina
- 90 Strongly Landlord-Friendly · R+6
- County
- — inherits STATE
- City
- — inherits STATE
ZIP-level market 29044
- Home prices YoY
- 7.0%
- Active inventory
- 54
- Price-to-rent
- 11.7×
Monthly cashflow live
- Estimated rent
- $1,508 medium interval (Pro) →
- Mortgage (P&I)
- −$1,107
- Tax est. 1.5%
- −$264 /mo · $3,165/yr
- Insurance
- −$88
- HOA
- −$0
- Vacancy / Maint / Mgmt
- −$317
- Net cashflow
- $-267
Break-even live
Sensitivity live
| Price | -10% $-121 | -5% $-194 | +0% $-267 | +5% $-340 | +10% $-413 |
|---|---|---|---|---|---|
| Rent | -10% $-386 | -5% $-326 | +0% $-267 | +5% $-207 | +10% $-148 |
| Rate | -1.0pp $-160 | -0.5pp $-213 | base $-267 | +0.5pp $-321 | +1.0pp $-377 |
UW: 25.0% down · 7.5% · 30yr · 1.5% tax · 5.0% vac · 8.0% maint · 8.0% mgmt
Financing live
Cash to close
- Down payment
- $52,750
- Closing costs
- $6,330
- Reserves months
- —
- Total cash needed
- —
Loan-product check · same deal, 3 products live
Conventional
25% down · 7.5% · 30yr
- Down + closing
- —
- Monthly P&I
- —
- Monthly cashflow
- —
- DSCR
- —
- Eligible?
- —
Personal DTI + credit; lowest rate.
DSCR
20% down · 8.5% · 30yr
- Down + closing
- —
- Monthly P&I
- —
- Monthly cashflow
- —
- DSCR
- —
- Eligible?
- —
No personal income docs; deal must DSCR.
Hard money
10% down · 12.0% · 12mo
- Down + closing
- —
- Monthly P&I
- —
- Monthly cashflow
- —
- DSCR
- —
- Eligible?
- —
Short-term bridge; refi at stabilization.
Listing history 20 events
-
2026-06-21days on market $211,000 Active 39 DOM
-
2026-06-18days on market $211,000 Active 36 DOM
-
2026-06-17days on market $211,000 Active 35 DOM
-
2026-06-16days on market $211,000 Active 34 DOM
-
2026-06-15remarks 693-char remark
-
2026-06-15pricedays on market $211,000 Active 33 DOM
-
2026-06-14days on market $212,000 Active 31 DOM
-
2026-06-10days on market $212,000 Active 28 DOM
-
2026-06-09days on market $212,000 Active 27 DOM
-
2026-06-08days on market $212,000 Active 26 DOM
-
2026-06-07pricedays on market $212,000 Active 25 DOM
-
2026-06-03days on market $213,000 Active 21 DOM
-
2026-06-03days on market $213,000 Active 20 DOM
-
2026-06-01days on market $213,000 Active 19 DOM
-
2026-06-01price $213,000 Active 18 DOM
-
2026-05-31days on market $215,000 Active 18 DOM
-
2026-05-18price $215,000
-
2026-05-18price $229,000
-
2026-05-15$215,000 Active 726-char remark
Show marketing remark (726 chars)
Seller is a SC licensed agent. Spacious country living on 2 beautiful acres! Brand new 5 bedroom, 3 bathroom manufactured home that has plenty of room for everyone. Enjoy an open floor plan with a large living area, modern kitchen with island, and a private owner's suite with a spacious bath and walk-in closet. Split bedroom layout provides added privacy, while the additional bedrooms for flexibility for guests, office space, or hobbies. Peaceful rural setting with room for gardening, animals, or outdoor entertaining, yet still convenient to Columbia, Shaw AFB, and local amenities. Move-in ready and everything is brand new including septic and well — don't miss this opportunity for affordable space and acreage!
-
2026-05-12$235,000 Active
ⓘ Source: listings_history table (triggers on properties + properties_extension) + one-shot
backfill from property_details.listing_events for pre-trigger history.
Climate risk First Street
- Flood 1/10 Low FEMA zone X (unshaded) · 0% chance over 30 yrs
- Wildfire 5/10 Major
- Heat 6/10 Major 7 d/yr ≥108°F today · 16 d/yr by 30 yrs out
- Wind 6/10 Major 74% chance of damaging wind over 30 yrs
- Air quality 3/10 Moderate 2 unhealthy d/yr today · 3 by 30 yrs out
Nearby sold comps map
Loading sold comps map…
Walkable amenities ~0.75 mi
Loading nearby amenities…
Taxation est. · year 1
- Rental income
- $18,098
- − Mortgage interest
- −$11,819
- − Property taxes
- −$3,165
- − Insurance
- −$1,055
- − Repairs & maintenance
- −$1,448
- − Management
- −$1,448
- − Depreciation
- −$6,138
- Taxable loss
- −$6,975
- Est. tax savings @ 24.0%
- +$1,674
- After-tax cash flow
- $-1,527/yr
For passive investors: Depreciation is non-cash, so a rental often shows a tax loss while cash-flowing — sheltering income. Rental losses are passive: they offset passive income freely, and up to $25,000/yr can offset ordinary (W-2) income if you actively participate and your MAGI is under $100k (phasing out to $0 by $150k); unused losses carry forward. On sale, claimed depreciation is recaptured at up to 25%, and gains may owe capital-gains tax (a 1031 exchange can defer both). Figures are a year-1 estimate at your 24.0% rate — not tax advice; consult a CPA.
Schools (NCES district)
- District
- Richland 01
- NCES district ID
- 4503360
- Math proficiency
- 26% ▼ -7.00%
- Reading proficiency
- 36% ▼ -5.00%
- Median HH income
- $38,931
- Composite
- 25.94/100
- National rank
- #7335
- State rank
- #54 of 80 in SC
Livability — Columbia
- Score
- 78/100
- State rank
- #18
- US rank
- #2436
Category grades
Schools grade is shown separately in the Schools card above.
Census & demographics
- City population
- 335,994
- Population (ZIP)
- 4,299
Population outlook (Richland County) Hauer SSP2
- Today (2025)
- 459,667 people
- By 2030
- 487,524 · +6.1%
- By 2040
- 542,035 · +17.9%
- By 2050
- 595,371 · +29.5%
- By 2075
- 732,998 · +59.5%
- By 2100
- 820,415 · +78.5%
Race, ethnicity, and origin ACS 2023
- Neighborhood character
- Majority Black (56%)
- Race & ethnicity
- Black 56% White 38% Two or more races 3% Hispanic / Latino 2%
- Common ancestry
- Serbian 2% Italian 2% Romanian 1%
- Foreign-born
- 1% · Canada
- Languages at home
- 97% English-only · Spanish 2%
Political lean MEDSL · Richland
- 2024 margin
- Solid D (+34.6) · D 66.4% · R 31.8% · Other 1.8%
- 2008→2024 swing
- +5.7pp toward D · 2008: 28.9pp · 2024: 34.6pp
- All cycles
- 2024: D+34.6 2020: D+38.3 2016: D+32.9 2012: D+33.3 2008: D+28.9
Not yet ingested
- Civics
- —
Market trends
- HPI YoY
- ▲ 13.20%
- Current HPI
- 200.54
- Rent YoY
- —
- Metro
- —
- State GDP YoY
- ▲ 4.51%
- F500 in state
- 2
Industry mix (Fortune 500 HQ in SC)
| Industry | F500 HQs | Revenue |
|---|---|---|
| Packaging | 1 | $7B |
|
||
Price history
-8.5% since first listed4 events — show timeline
- 2026-05-18 Price Changed $215,000 Consolidated MLS
- 2026-05-18 Price Changed $229,000 Consolidated MLS
- 2026-05-15 Listed $215,000 SBOR
- 2026-05-12 Listed $235,000 Consolidated MLS
Cash-flow waterfall
monthlySold comps — $/sqft
last 12 mo · ≤1 miLoading sold comps…