 Fourplex
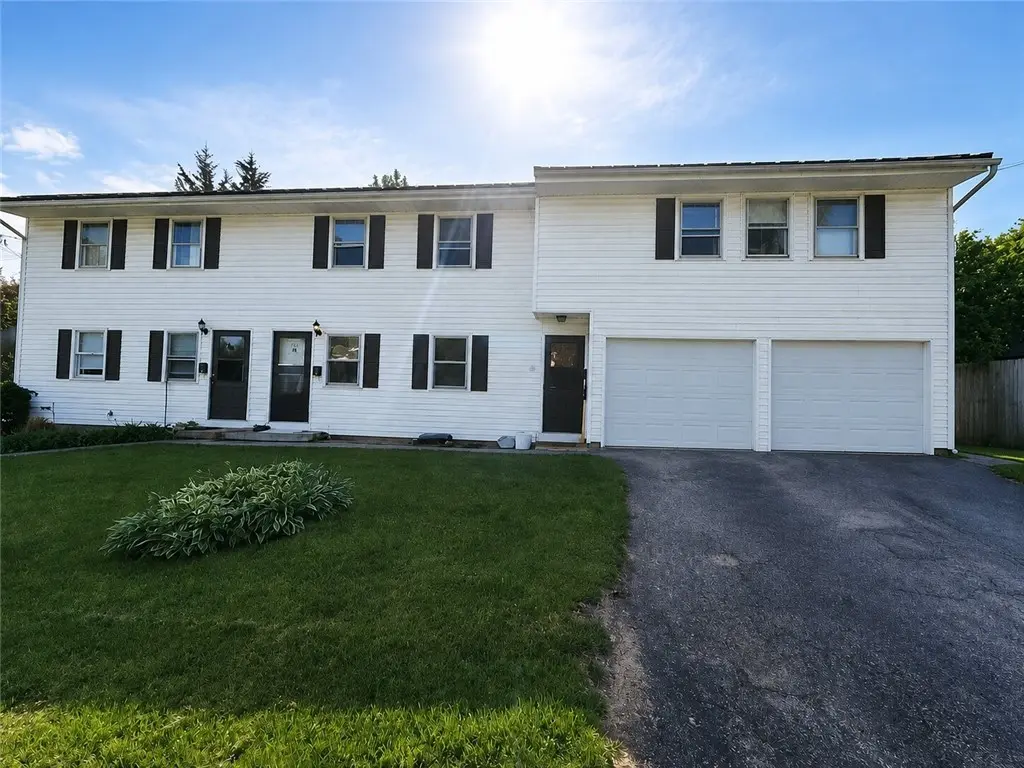
22 Durant Pl · Fairport, NY
Flood risk 1/10 · Minimal
- FEMA flood zone
- X (unshaded)
- Chance of flooding over 30 yrs
- 0.0%
- Est. flood insurance / yr
- $473 – $860
Fire risk 2/10 · Minimal
- Est. fire insurance / yr
- $691 – $1,283
Heat risk 2/10 · Minimal
- Hot days now (above 95°F)
- 7 days/yr
- Hot days in 30 yrs
- 16 days/yr
Wind risk 1/10 · Minimal
- Chance of severe wind over 30 yrs
- —
Air-quality risk 2/10 · Minimal
- Unhealthy air days now
- 1 days/yr
- Unhealthy air days in 30 yrs
- 1 days/yr
Risk factors via First Street. Map © Google.
Why this score? — see what drove the B grade
The composite is a weighted blend of 9 inputs, each scored 0–100. Each bar is that input's sub-score; the figure is the points it added to the 100-point composite (weight × sub-score).
- Cash flow +30.0/30.0
- 1% rule +10.0/10.0
- DSCR +10.0/10.0
- ARV discount +7.5/15.0
- Schools +5.4/10.0
- Livability +3.7/5.0
- Condition / age +2.5/5.0
- Rent growth +2.3/5.0
- Appreciation +0.0/10.0
$495,000
🖨 Deal sheet 📄 Offer letter ✓ Due diligence
Multi-family units
County records classify this as Multi-Family (2-4 Unit). Listing-text estimate: 4 units. confirmed
Listing remarks
Welcome to 22 Durant Place in the Village of Fairport! Prime location just near the highly sought-after shops, restaurants, and entertainment at the Cannery. This investor special features four units, with three currently generating income and one vacant but rental-ready — perfect for an owner-occupant or to place your own tenant with projected rent of $2,200-$2,400/month. Enjoy the added benefit of Fairport Electric! Two units have been completely renovated with new kitchens, bathrooms, flooring, and fresh paint. Both three-bedroom units offer townhouse-style layouts with private basement space and separate utilities. The one-bedroom units each feature the convenience of in-unit laun
Key facts
- New kitchens
- Four units
- Completely renovated
Tags
Property features AI
Finance
- Financial info: 4 total units (4 units in community); 4 separate electric meters; Operating expenses may include: electric, insurance, structural maintenance, general maintenance, trash, and water/sewer
Exterior
- Parking: 2-car garage; Paved parking
- Utilities: Electricity connected; Public water connected; Sewer connected
- Home design: 2-story building; Resale property; Existing construction
- Construction: Vinyl siding; Metal roof; Block foundation
- Exterior features: Deck; Rectangular residential lot; 100 x 117 lot dimensions; City street frontage
Interior
- Flooring: Carpet; Vinyl; Varies by unit/area
- Bathrooms: 4 full bathrooms; 2 half bathrooms
- Heating & cooling: Electric baseboard heating
- Interior features: Full basement; Carpet and vinyl flooring throughout; varying floor types in different areas; Electric water heater
Neighborhood map
What this means for you Summary
Snapshot
- This is a 4 × 2-bed/?-bath units multifamily listed at $495k.
Deal economics
- At list price, monthly cash flow is $3k ($36k/yr) — positive. Per door: $759/mo.
- The deal already cash-flows at list — no discount required.
- Meets the 1% rule at list price ($8k rent vs $495k).
- Cap rate 13.7% vs local median 3.4% in Fairport — top-decile yield for the area; either an underpriced asset or a hidden risk that comps aren't pricing in. Stress-test before assuming the spread holds.
Location & tenants
- Location reads 74/100 on livability (#301 in NY, #4,847 nationally) — a middle-class / working-renter tenant base. Strengths: housing A+, health & safety A+, schools A; Watch: commute F.
- Fairport Central School District (suburban): math 55% / reading 66% proficiency, ranked #199 of 590 in NY (top 34%) — acceptable for families but not a draw, mixed tenant base, ~2y average lease; only 14% free/reduced lunch — higher-income household profile.
- Market conditions: Rents soft (-0.8%/yr); 186 active listings in the ZIP; solid renter incomes; 1,169 units permitted in Monroe County in 2024 (591 in 5+ unit buildings).
- At $8,371/mo this rent would consume 92% of the median local household income ($109k/yr) (locally 843% of renters already pay >50% of income on rent) — very limited rent-growth headroom before tenants either downsize or default.
Forward outlook
- Local home prices are declining (-3.0%/yr); year-one equity from $3k of loan paydown is wiped out by about $15k of value loss. Plan a longer hold.
- Monroe County population projected to shrink 6% by 2050 — rents likely to lag national; underwrite the cash flow, not the appreciation.
- At projected returns (-3.0% appreciation + 0.0% rent growth), your $139k cash investment doubles in ~6 years — after that, you're playing with house money.
Negotiation context
- Only 5 days on market — expect competitive offers; lowballing is unlikely to land.
- Current owner paid $200k; list at $495k implies a 148% gain — meaningful room to come down on a strong offer.
Questions for the listing agent
- Can we see the unit-by-unit rent roll, current vacancy, and any below-market leases? What's the average tenancy length?
- What capital expenditures (roof, boiler, parking lot, exteriors) have been made in the last 5 years, and what's planned in the next 2?
- Built in 1978 — when were the roof, HVAC, electrical panel, plumbing, and water heater last replaced?
- Is there a deadline driving the sale (1031 exchange, divorce, estate, relocation)? That informs how much negotiation room exists.
- Schools are A-rated — typically a magnet for longer-tenancy family renters. What's the average tenant stay here, and is there a school-zone premium baked into asking?
- What's the average days-on-market for RENTAL listings here right now (not sales)? A rising rental-DOM trend means longer vacancies and softer asking-rent achievability than the comps imply.
- What's the recent tenant-quality profile in this submarket — average credit score on applications, eviction rate, late-payment / NSF rate, and stable-employment percentage? A property-management company in the area should have these aggregated.
- How much new apartment / multifamily construction is in the pipeline within 1–3 miles? Heavy new supply (>2% of stock underway) typically softens rents 12–24 months out; light construction supports rent growth.
Investment metrics
- 1% rule
- 1.69% ✓
- Cap rate
- 13.66%
- Cash-on-cash
- 26.30%
- DSCR
- 2.17
- GRM
- 4.9
CMA / ARV
No comps found within radius.
Projected returns pro-forma
-3.0% appreciation · 0.0% rent growth · sell at horizon
- IRR
- 16.6%
- Equity multiple
- 1.64×
- Total profit
- $88,926
- Equity at exit
- $73,806
- IRR
- 22.8%
- Equity multiple
- 2.68×
- Total profit
- $232,623
- Equity at exit
- $42,799
Cash invested: $138,600 (down + closing). Projections, not guarantees.
Landlord ↔ Tenant lean methodology
- Overall (STATE)
- 15 Strongly Tenant-Friendly
- State New York
- 15 Strongly Tenant-Friendly · D+10
- County
- — inherits STATE
- City
- — inherits STATE
ZIP-level market 14450
- Rents YoY
- -0.8%
- Active inventory
- 186
- Price-to-rent
- 19.7×
Monthly cashflow live
- Estimated rent
- $8,371 medium interval (Pro) →
- Mortgage (P&I)
- −$2,596
- Tax from tax record
- −$774 /mo · $9,284/yr
- Insurance
- −$206
- HOA
- −$0
- Vacancy / Maint / Mgmt
- −$1,758
- Net cashflow
- $3,037
Break-even live
4-unit breakdown (identical units grouped — click to expand)
| Units | Beds | Baths | Est. rent |
|---|---|---|---|
| 4× units | 2 | — | $8,372 |
| #1 | 2 | — | $2,093 |
| #2 | 2 | — | $2,093 |
| #3 | 2 | — | $2,093 |
| #4 | 2 | — | $2,093 |
| Total (4 units) | $8,371 | ||
UW: 25.0% down · 7.5% · 30yr · 1.5% tax · 5.0% vac · 8.0% maint · 8.0% mgmt
Financing live
Cash to close
- Down payment
- $123,750
- Closing costs
- $14,850
- Reserves months
- —
- Total cash needed
- —
Loan-product check · same deal, 3 products live
Conventional
25% down · 7.5% · 30yr
- Down + closing
- —
- Monthly P&I
- —
- Monthly cashflow
- —
- DSCR
- —
- Eligible?
- —
Personal DTI + credit; lowest rate.
DSCR
20% down · 8.5% · 30yr
- Down + closing
- —
- Monthly P&I
- —
- Monthly cashflow
- —
- DSCR
- —
- Eligible?
- —
No personal income docs; deal must DSCR.
Hard money
10% down · 12.0% · 12mo
- Down + closing
- —
- Monthly P&I
- —
- Monthly cashflow
- —
- DSCR
- —
- Eligible?
- —
Short-term bridge; refi at stabilization.
Listing history 5 events
-
2026-06-03statusdays on market $495,000 Pending 5 DOM
-
2026-06-01days on market $495,000 Active 4 DOM
-
2026-05-31days on market $495,000 Active 3 DOM
-
2026-05-27$495,000 Active
-
2024-05-14soldstatus $200,000
ⓘ Source: listings_history table (triggers on properties + properties_extension) + one-shot
backfill from property_details.listing_events for pre-trigger history.
Tax reassessment forecast NY · Partial reset (capped growth)
- Current annual tax
- $9,284 · $774/mo
- Projected year-2 tax
- $9,284 · $774/mo
- Expected delta
- $0/yr ($0/mo · 0.0%)
ⓘ Screening estimate from a state-policy table — verify with the county assessor before closing.
Climate risk First Street
- Flood 1/10 Low FEMA zone X (unshaded) · 0% chance over 30 yrs
- Wildfire 2/10 Low
- Heat 2/10 Low 7 d/yr ≥95°F today · 16 d/yr by 30 yrs out
- Wind 1/10 Low
- Air quality 2/10 Low 1 unhealthy d/yr today · 1 by 30 yrs out
Nearby sold comps map
Loading sold comps map…
Walkable amenities ~0.75 mi
Loading nearby amenities…
Taxation est. · year 1
- Rental income
- $100,452
- − Mortgage interest
- −$27,728
- − Property taxes
- −$9,284
- − Insurance
- −$2,475
- − Repairs & maintenance
- −$8,036
- − Management
- −$8,036
- − Depreciation
- −$14,400
- Taxable income
- $30,493
- Est. tax owed @ 24.0%
- −$7,318
- After-tax cash flow
- $29,129/yr
For passive investors: Depreciation is non-cash, so a rental often shows a tax loss while cash-flowing — sheltering income. Rental losses are passive: they offset passive income freely, and up to $25,000/yr can offset ordinary (W-2) income if you actively participate and your MAGI is under $100k (phasing out to $0 by $150k); unused losses carry forward. On sale, claimed depreciation is recaptured at up to 25%, and gains may owe capital-gains tax (a 1031 exchange can defer both). Figures are a year-1 estimate at your 24.0% rate — not tax advice; consult a CPA.
Schools (NCES district)
- District
- Fairport Central School District
- NCES district ID
- 3610890
- Math proficiency
- 55% ▼ -16.00%
- Reading proficiency
- 66% ▲ 3.00%
- Median HH income
- $74,981
- Composite
- 53.84/100
- National rank
- #1409
- State rank
- #199 of 590 in NY
Livability — Fairport
- Score
- 74/100
- State rank
- #301
- US rank
- #4847
Category grades
Schools grade is shown separately in the Schools card above.
Census & demographics
- Census place
- Fairport, NY
- County
- Monroe County · 674,131 people
- City population
- 42,750
- Metro
- Rochester, NY
- Population (ZIP)
- 42,750
- Household income
- $109,466
- Rent vs Own
- Severe rent burden
- 843.0
Population outlook (Monroe County) Hauer SSP2
- Today (2025)
- 759,460 people
- By 2030
- 757,154 · -0.3%
- By 2040
- 740,644 · -2.5%
- By 2050
- 714,443 · -5.9%
- By 2075
- 645,883 · -15.0%
- By 2100
- 547,084 · -28.0%
Race, ethnicity, and origin ACS 2023
- Neighborhood character
- Predominantly White (89%)
- Race & ethnicity
- White 89% Two or more races 5% Hispanic / Latino 3% Asian 2% Black 2%
- Common ancestry
- Romanian 6% Lithuanian 2% Iranian 2%
- Foreign-born
- 6% · Canada, China, South Korea
- Languages at home
- 94% English-only · Other Indo-European 1% Spanish 1% Other Asian/Pacific 1%
Political lean MEDSL · Monroe
- 2024 margin
- D (+19.1) · D 59.5% · R 40.5%
- 2008→2024 swing
- +1.4pp toward D · 2008: 17.7pp · 2024: 19.1pp
- All cycles
- 2024: D+19.1 2020: D+21.0 2016: D+14.1 2012: D+17.4 2008: D+17.7
Not yet ingested
- Civics
- —
Market trends
- HPI YoY
- ▼ -189.56%
- Current HPI
- 270.7329
- Rent YoY
- ▼ -0.84%
- Metro
- Rochester, NY
- State GDP YoY
- ▲ 2.60%
- F500 in state
- 92
Industry mix (Fortune 500 HQ in NY)
| Industry | F500 HQs | Revenue |
|---|---|---|
| Financial Services | 10 | $950B |
|
||
| Consumer Goods | 9 | $162B |
|
||
| Insurance | 4 | $225B |
|
||
| Telecommunications | 2 | $144B |
|
||
| Pharmaceuticals | 2 | $112B |
|
||
| Media / Entertainment | 2 | $69B |
|
||
Price history
+147.5% since first listed2 events — show timeline
- 2026-05-27 Listed $495,000 UNYREIS
- 2024-05-14 Sold (Public Records) $200,000 Public Records
Property tax history
+2.6%/yrLatest (2025): $9,284 · +3.1% YoY. Source: county tax records.
Cash-flow waterfall
monthlySold comps — $/sqft
last 12 mo · ≤1 miLoading sold comps…