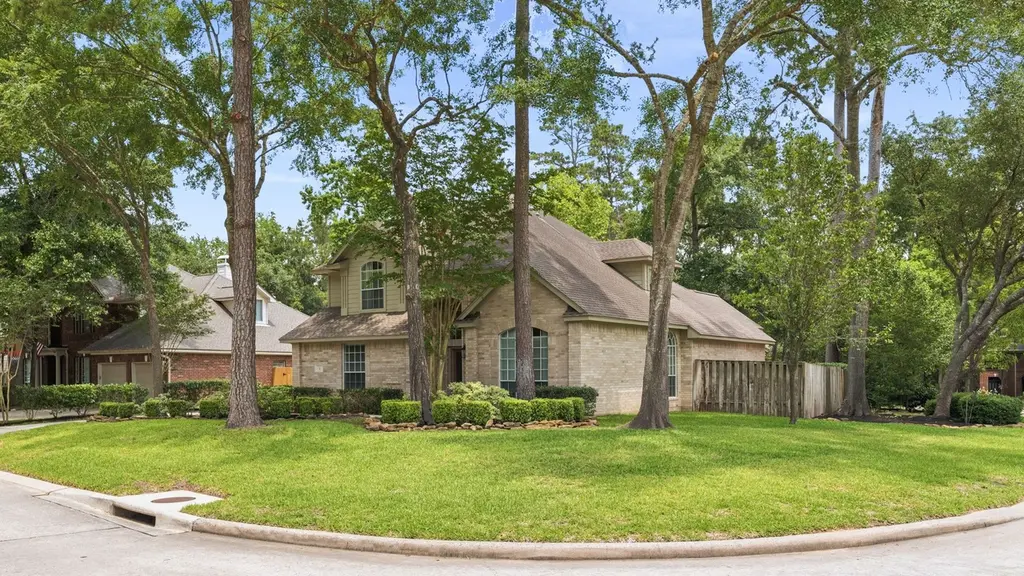
2 Harmony Arbor Ct · The Woodlands, TX
Flood risk 1/10 · Minimal
- FEMA flood zone
- X (unshaded)
- Chance of flooding over 30 yrs
- 0.0%
- Est. flood insurance / yr
- $507 – $1,088
Fire risk 2/10 · Minimal
- Est. fire insurance / yr
- $1,222 – $2,270
Heat risk 8/10 · Major
- Hot days now (above 111°F)
- 7 days/yr
- Hot days in 30 yrs
- 22 days/yr
Wind risk 8/10 · Major
- Chance of severe wind over 30 yrs
- 99.0%
Air-quality risk 3/10 · Minor
- Unhealthy air days now
- 2 days/yr
- Unhealthy air days in 30 yrs
- 3 days/yr
Risk factors via First Street. Map © Google.
Why this score? — see what drove the F grade
The composite is a weighted blend of 9 inputs, each scored 0–100. Each bar is that input's sub-score; the figure is the points it added to the 100-point composite (weight × sub-score).
- Cash flow +10.8/30.0
- Schools +5.1/10.0
- Livability +4.5/5.0
- DSCR +3.1/10.0
- 1% rule +2.9/10.0
- Rent growth +2.8/5.0
- Condition / age +2.5/5.0
- ARV discount +0.0/15.0
- Appreciation +0.0/10.0
$765,000
🖨 Deal sheet 📄 Offer letter ✓ Due diligence
Listing remarks
Perfectly located and beautifully finished home on large corner lot in highly desirable Alden Bridge Village directly across from Pleasant Hill Park. This move-in ready home features a stunning pool & spa with large outdoor patio ready for entertaining or relaxation; open kitchen with island and granite countertops & bar with break feast nook connected to family room overlooking the pool area; lots of light throughout the easy-flowing and functional floor plan; formal dining & living with convenient half-bath, gorgeous first level primary bedroom suite with pool view & wood flooring; large primary bathroom with separate jetted tub and walk-in shower; 3 bedrooms upsta
Key facts
- Large corner lot
- Large outdoor patio
- Stunning pool
Tags
Property features AI
Finance
- Other: Corner lot on a cul-de-sac in a subdivision with a pond on the lot; Concrete road surface
- HOA & community: Community amenities include basketball court, dog park, picnic area, playground, park, pool, tennis courts, trails, and trash service
Exterior
- Parking: Attached 2-car garage with garage door opener
- Security: Smoke detector(s)
- Utilities: Public water; Public sewer
- Home design: Residential property; Faces north; Built in 1996; Slab foundation
- Construction: Brick and cement siding; Composition roof
- Exterior features: Deck; Patio; Fully fenced private yard; Back yard fencing; Private pool (gunite, in-ground) with pool/spa combo
Interior
- Kitchen: Dishwasher; Electric cooktop; Electric oven; Microwave; Disposal; Oven
- Bedrooms: Primary bedroom on the first floor (14'7" x 19'10"); Three additional bedrooms on the second floor (13'4" x 10'9", 10'10" x 9'8", 9'11" x 13'6")
- Flooring: Carpet; Tile
- Bathrooms: Two full bathrooms; One half bathroom
- Heating & cooling: Central heating (gas); Central electric air conditioning
- Interior features: Crown molding; Double vanity; Granite counters; Jetted tub; Kitchen island; Kitchen/family room combo; Bath in primary bedroom; Pots & pan drawers; Separate shower; Tub/shower; Window treatments; Ceiling fans; Programmable thermostat; Gas, gas log, and wood-burning fireplace; Window coverings
- Laundry & utility: Electric dryer hookup
Neighborhood map
What this means for you Summary
Snapshot
- This is a 4-bed/2.5-bath single-family listed at $765k.
Deal economics
- At list price, monthly cash flow is $-353 ($-4k/yr) — negative.
- To cash-flow at today's rent, offer at most $703k (8.2% below list).
- To meet the 1% rule (rent ≥ 1% of price), the offer needs to be $602k (21.4% below list).
- Recommended offer: $602k (21.4% below list) — sets the bar for 1% rule.
- Cap rate 5.7% vs local median 2.3% in The Woodlands — top-decile yield for the area; either an underpriced asset or a hidden risk that comps aren't pricing in. Stress-test before assuming the spread holds.
Location & tenants
- Location reads 91/100 on livability (#1 in TX, #47 nationally) — a professional / high-income tenant draw. Strengths: amenities A+, commute A+, employment A+; Watch: cost of living D-.
- Conroe ISD (other): math 57% / reading 57% proficiency, ranked #69 of 826 in TX (top 8%) — acceptable for families but not a draw, mixed tenant base, ~2y average lease.
- Zoned schools: Mccullough J H (math 82% / reading 81%, grade A+, #9 of 1,662 statewide, top 1%, 2,178 students, 14% FRL); The Woodlands H S (math 71% / reading 86%, grade A-, #53 of 1,632 statewide, top 3%, 4,361 students, 12% FRL) — zoned schools average 13% FRL vs 34% district-wide (21 pts lower); this property's tenant base skews higher-income than the district average.
- Zoned-school proficiency averages 80% at this address vs 57% district-wide (+23 pts) — the actual schools serving this property are materially stronger than the Conroe ISD average implies; a family-tenant draw the district grade alone would hide.
- Market conditions: Rents rising (+1.2%/yr); 291 active listings in the ZIP; 2 comparable units currently listed for rent nearby; high-income renter base; 13,259 units permitted in Montgomery County in 2024 (1,402 in 5+ unit buildings).
- This rent runs 44% of the median local income ($162k/yr) — at the standard rent-burdened threshold; future hikes will face affordability resistance.
Forward outlook
- Local home prices are declining (-3.0%/yr); year-one equity from $5k of loan paydown is wiped out by about $23k of value loss. Plan a longer hold.
- Montgomery County population projected at +65% by 2050 — long-run rental-demand tailwind backs the buy-and-hold thesis.
Negotiation context
- It's been on market 29 days — a 2% lower offer ($754k) is reasonable based on typical stale-listing flexibility.
Risks & watch-outs
- Climate carrying-cost: severe wind risk, 99% chance of damaging wind over 30y; extreme-heat days projected 7→22/yr by 2055 (HVAC capex compounding) — expect insurance premiums to compound above CPI over the hold.
Questions for the listing agent
- What do current leases actually rent for vs. the listed asking? Can we see a recent rent roll and the last 12 months of T-12 income?
- Is there a deadline driving the sale (1031 exchange, divorce, estate, relocation)? That informs how much negotiation room exists.
- Schools are A-rated — typically a magnet for longer-tenancy family renters. What's the average tenant stay here, and is there a school-zone premium baked into asking?
- The area grade is low — what's the realistic commute time and amenity access for the typical tenant pool here? Any planned neighborhood developments (good or bad) we should know about?
- What's the average days-on-market for RENTAL listings here right now (not sales)? A rising rental-DOM trend means longer vacancies and softer asking-rent achievability than the comps imply.
- What's the recent tenant-quality profile in this submarket — average credit score on applications, eviction rate, late-payment / NSF rate, and stable-employment percentage? A property-management company in the area should have these aggregated.
- How much new for-sale + rental construction is in the pipeline within 1–3 miles? Heavy new supply typically softens prices + rents 12–24 months out; constrained supply supports both.
Investment metrics
- 1% rule
- 0.79% ✗
- Cap rate
- 5.74%
- Cash-on-cash
- -1.98%
- DSCR
- 0.91
- GRM
- 10.6
CMA / ARV
- ARV (on-the-fly)
- $619,992
- Comps found
- 12
Show comp detail 12 sales within ~0.75 mi
| Address | Dist | Beds/Ba | Sqft | Sold | Price | $/sf | Match |
|---|---|---|---|---|---|---|---|
| 68 E Sandalbranch Cir | 0.13mi | 4/3.5 | 2,996 (+5%) | 1mo | $862,000 | $288 | 80 |
| 91 Alden Glen Dr | 0.33mi | 4/2.5 | 2,708 (-5%) | 2mo | $485,000 | $179 | 75 |
| 78 E Stockbridge Landing Cir | 0.32mi | 4/3.5 | 2,971 (+4%) | 4mo | $609,000 | $205 | 70 |
| 27 Emery Mill Pl | 0.63mi | 4/3.0 | 2,820 (-1%) | 1mo | $540,000 | $191 | 66 |
| 118 W Hobbit Glen Dr | 0.57mi | 4/2.5 | 2,944 (+4%) | 4mo | $525,000 | $178 | 65 |
| 106 W Bristol Oak Cir | 0.53mi | 4/3.5 | 3,011 (+6%) | 5mo | $644,000 | $214 | 58 |
| 47 S Bristol Oak Cir | 0.55mi | 3/3.0 (-1) | 2,980 (+5%) | 3mo | $649,000 | $218 | 57 |
| 175 W Bristol Oak Cir | 0.39mi | 3/2.0 (-1) | 2,566 (-10%) | 2mo | $575,000 | $224 | 57 |
| 47 Barongate | 0.27mi | 5/3.0 (+1) | 3,223 (+13%) | 2mo | $780,000 | $242 | 56 |
| 26 Serene Creek Pl | 0.47mi | 3/2.5 (-1) | 2,570 (-10%) | 2mo | $525,000 | $204 | 56 |
| 19 E New Avery Pl | 0.58mi | 4/2.5 | 2,440 (-14%) | 1mo | $545,000 | $223 | 48 |
| 58 Trilling Bird Pl | 0.62mi | 3/2.0 (-1) | 2,603 (-8%) | 4mo | $615,000 | $236 | 47 |
Match score weights: distance 35% · size 25% · config 20% · recency 20%. Top-matched comps best support the ARV.
Projected returns pro-forma
-3.0% appreciation · 1.25% rent growth · sell at horizon
- IRR
- -21.5%
- Equity multiple
- 0.27×
- Total profit
- $-156,897
- Equity at exit
- $114,064
- IRR
- -19.7%
- Equity multiple
- 0.03×
- Total profit
- $-206,926
- Equity at exit
- $66,143
Cash invested: $214,200 (down + closing). Projections, not guarantees.
Landlord ↔ Tenant lean methodology
- Overall (STATE)
- 87 Strongly Landlord-Friendly
- State Texas
- 87 Strongly Landlord-Friendly · R+5
- County
- — inherits STATE
- City
- — inherits STATE
ZIP-level market 77382
- Home prices YoY
- -16.3%
- Rents YoY
- 1.2%
- Active inventory
- 291
- Price-to-rent
- 10.6×
Monthly cashflow live
- Estimated rent
- $6,016 medium interval (Pro) →
- Mortgage (P&I)
- −$4,012
- Tax from tax record
- −$775 /mo · $9,302/yr
- Insurance
- −$319
- HOA
- −$0
- Vacancy / Maint / Mgmt
- −$1,263
- Net cashflow
- $-353
Break-even live
UW: 25.0% down · 7.5% · 30yr · 1.5% tax · 5.0% vac · 8.0% maint · 8.0% mgmt
Financing live
Cash to close
- Down payment
- $191,250
- Closing costs
- $22,950
- Reserves months
- —
- Total cash needed
- —
Loan-product check · same deal, 3 products live
Conventional
25% down · 7.5% · 30yr
- Down + closing
- —
- Monthly P&I
- —
- Monthly cashflow
- —
- DSCR
- —
- Eligible?
- —
Personal DTI + credit; lowest rate.
DSCR
20% down · 8.5% · 30yr
- Down + closing
- —
- Monthly P&I
- —
- Monthly cashflow
- —
- DSCR
- —
- Eligible?
- —
No personal income docs; deal must DSCR.
Hard money
10% down · 12.0% · 12mo
- Down + closing
- —
- Monthly P&I
- —
- Monthly cashflow
- —
- DSCR
- —
- Eligible?
- —
Short-term bridge; refi at stabilization.
Rent comps 2 comps
| Address | Beds | Baths | Sqft | Rent | $/sqft | DOM | Units | Dist |
|---|---|---|---|---|---|---|---|---|
| 35 Alden Glen Dr Spring, TX | 5.0 | 3.0 | 2676 | $10,750 | $4.02 | 24d | 1 | 0.41mi |
| 111 S Winterport Cir Spring, TX | 3.0 | 3.0 | 2386 | $2,850 | $1.19 | 43d | 1 | 1.12mi |
Listing history 16 events
-
2026-06-18days on market $765,000 Active 29 DOM
-
2026-06-17days on market $765,000 Active 28 DOM
-
2026-06-16days on market $765,000 Active 27 DOM
-
2026-06-15days on market $765,000 Active 26 DOM
-
2026-06-13days on market $765,000 Active 24 DOM
-
2026-06-09days on market $765,000 Active 20 DOM
-
2026-06-08days on market $765,000 Active 19 DOM
-
2026-06-07days on market $765,000 Active 18 DOM
-
2026-06-04days on market $765,000 Active 15 DOM
-
2026-06-03days on market $765,000 Active 14 DOM
-
2026-06-02days on market $765,000 Active 13 DOM
-
2026-06-01days on market $765,000 Active 12 DOM
-
2026-05-31days on market $765,000 Active 11 DOM
-
2026-05-20$765,000 Active
-
2004-03-02soldstatus
-
1999-04-01soldstatus
ⓘ Source: listings_history table (triggers on properties + properties_extension) + one-shot
backfill from property_details.listing_events for pre-trigger history.
Tax reassessment forecast TX · Resets to sale price
- Current annual tax
- $9,302 · $775/mo
- Projected year-2 tax
- $14,000 · $1,167/mo
- Expected delta
- +$4,697/yr (+$391/mo · 50.5%)
ⓘ Screening estimate from a state-policy table — verify with the county assessor before closing.
Climate risk First Street
- Flood 1/10 Low FEMA zone X (unshaded) · 0% chance over 30 yrs
- Wildfire 2/10 Low
- Heat 8/10 Severe 7 d/yr ≥111°F today · 22 d/yr by 30 yrs out
- Wind 8/10 Severe 99% chance of damaging wind over 30 yrs
- Air quality 3/10 Moderate 2 unhealthy d/yr today · 3 by 30 yrs out
Nearby sold comps map
Loading sold comps map…
Walkable amenities ~0.75 mi
Loading nearby amenities…
Taxation est. · year 1
- Rental income
- $72,188
- − Mortgage interest
- −$42,852
- − Property taxes
- −$9,302
- − Insurance
- −$3,825
- − Repairs & maintenance
- −$5,775
- − Management
- −$5,775
- − Depreciation
- −$22,255
- Taxable loss
- −$17,596
- Est. tax savings @ 24.0%
- +$4,223
- After-tax cash flow
- $-17/yr
For passive investors: Depreciation is non-cash, so a rental often shows a tax loss while cash-flowing — sheltering income. Rental losses are passive: they offset passive income freely, and up to $25,000/yr can offset ordinary (W-2) income if you actively participate and your MAGI is under $100k (phasing out to $0 by $150k); unused losses carry forward. On sale, claimed depreciation is recaptured at up to 25%, and gains may owe capital-gains tax (a 1031 exchange can defer both). Figures are a year-1 estimate at your 24.0% rate — not tax advice; consult a CPA.
Schools (NCES district)
- District
- Conroe ISD
- NCES district ID
- 4815000
- Math proficiency
- 57% ▼ -6.00%
- Reading proficiency
- 57% ▼ -1.00%
- Median HH income
- $71,541
- Composite
- 50.65/100
- National rank
- #1833
- State rank
- #69 of 826 in TX
Livability — The Woodlands
- Score
- 91/100
- State rank
- #1
- US rank
- #47
Category grades
Schools grade is shown separately in the Schools card above.
Census & demographics
- Census place
- The Woodlands, TX
- County
- Montgomery County · 663,713 people
- City population
- 106,505
- Metro
- Houston-The Woodlands-Sugar Land, TX
- Population (ZIP)
- 38,986
- Household income
- $162,384
- Rent vs Own
- Severe rent burden
- 616.0
Population outlook (Montgomery County) Hauer SSP2
- Today (2025)
- 713,896 people
- By 2030
- 805,263 · +12.8%
- By 2040
- 992,708 · +39.1%
- By 2050
- 1,179,590 · +65.2%
- By 2075
- 1,628,084 · +128.1%
- By 2100
- 1,937,880 · +171.5%
Race, ethnicity, and origin ACS 2023
- Neighborhood character
- Predominantly White (67%)
- Race & ethnicity
- White 67% Hispanic / Latino 16% Two or more races 15% Asian 9% Black 4%
- Hispanic origin (detail)
- Mexican 11%
- Common ancestry
- Lithuanian 6% Slovak 3% Romanian 2%
- Foreign-born
- 19% · Canada, China, Dominican Republic
- Languages at home
- 81% English-only · Spanish 10% Chinese 3% Other Indo-European 2%
Political lean MEDSL · Montgomery
- 2024 margin
- Solid R (+45.5) · D 26.8% · R 72.3%
- 2008→2024 swing
- +7.2pp toward D · 2008: -52.7pp · 2024: -45.5pp
- All cycles
- 2024: R+45.5 2020: R+43.8 2016: R+51.4 2012: R+60.7 2008: R+52.7
Not yet ingested
- Civics
- —
Market trends
- HPI YoY
- ▼ -45.44%
- Current HPI
- 233.2304
- Rent YoY
- ▲ 1.25%
- Metro
- Houston-The Woodlands-Sugar Land, TX
- State GDP YoY
- ▲ 3.95%
- F500 in state
- 110
Industry mix (Fortune 500 HQ in TX)
| Industry | F500 HQs | Revenue |
|---|---|---|
| Energy | 16 | $1,198B |
|
||
| Technology | 5 | $198B |
|
||
| Engineering / Construction | 4 | $72B |
|
||
| Energy Services | 3 | $60B |
|
||
| Utilities | 3 | $41B |
|
||
| Healthcare | 2 | $330B |
|
||
Price history
3 events — show timeline
- 2026-05-20 Listed $765,000 HARMLS
- 2004-03-02 Sold (Public Records) — Public Records
- 1999-04-01 Sold (Public Records) — Public Records
Property tax history
+3.9%/yrLatest (2025): $9,302 · +9.3% YoY. Source: county tax records.
Cash-flow waterfall
monthlySold comps — $/sqft
last 12 mo · ≤1 miLoading sold comps…