295 Black Oak Rd · Mammoth Spring, AR
Flood risk No data
- FEMA flood zone
- —
- Chance of flooding over 30 yrs
- —
- Est. flood insurance / yr
- —
Fire risk No data
- Est. fire insurance / yr
- —
Heat risk No data
- Hot days now (above threshold)
- —
- Hot days in 30 yrs
- —
Wind risk No data
- Chance of severe wind over 30 yrs
- —
Air-quality risk No data
- Unhealthy air days now
- —
- Unhealthy air days in 30 yrs
- —
Risk factors via First Street. Map © Google.
Why this score? — see what drove the B+ grade
The composite is a weighted blend of 9 inputs, each scored 0–100. Each bar is that input's sub-score; the figure is the points it added to the 100-point composite (weight × sub-score).
- Cash flow +30.0/30.0
- DSCR +10.0/10.0
- 1% rule +9.5/10.0
- Appreciation +8.5/10.0
- ARV discount +7.5/15.0
- Livability +3.9/5.0
- Schools +2.9/10.0
- Rent growth +2.5/5.0
- Condition / age +2.5/5.0
$60,000
🖨 Deal sheet 📄 Offer letter ✓ Due diligence
Listing remarks
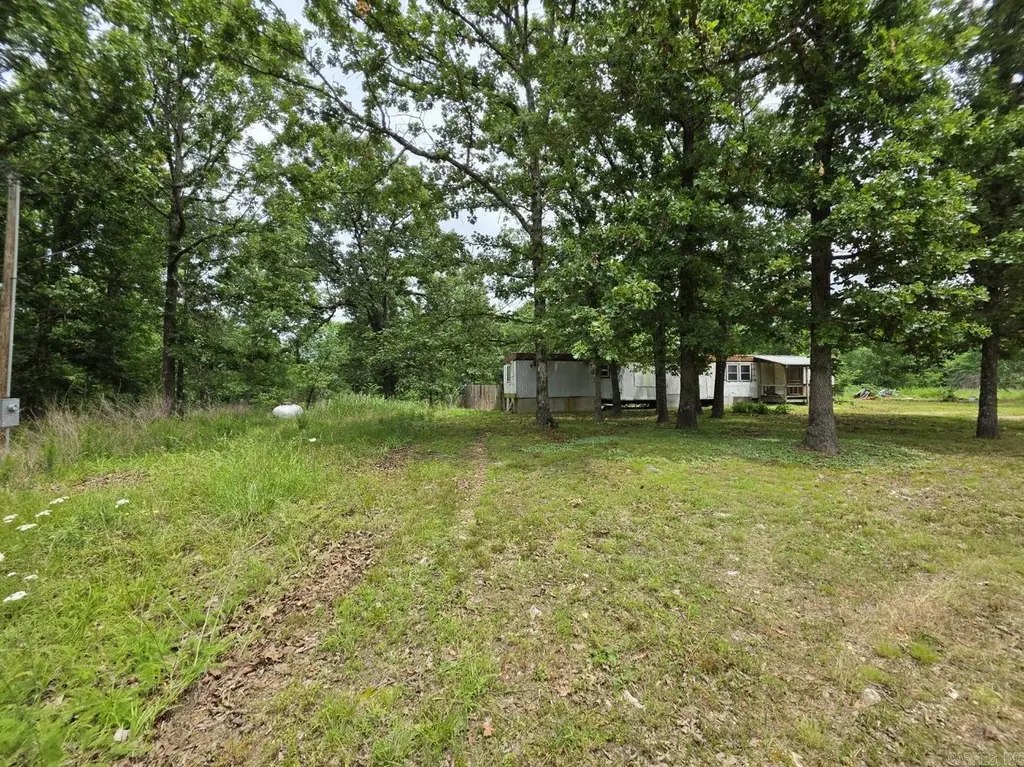
Unrestricted 5-Acre Retreat Near the Spring River! ?Escape to the Ozarks! Nestled just outside Mammoth Spring, this 5-acre property offers the perfect blend of mature shade trees, open space, and ultimate freedom. With no restrictions, the possibilities here are truly endless--whether you want to build your dream home, pull in an RV, start a hobby farm, or simply enjoy a private weekend getaway. Whether you're looking for a fixer-upper, the mobile home on the property will need significant repairs and updates to be made livable, but it provides a solid starting point or could serve as a great project or temporary structure or a beautiful piece of land to start fresh, this property is a rare
Key facts
- Open space
- 5 acre retreat
- Mature shade trees
Tags
Property features AI
Finance
- Financial info: Cash purchase accepted; In-house financing available
Exterior
- Parking: Space for 4+ cars
- Utilities: Private well; Septic system; Electric service via co-op; Propane/Butane gas
- Home design: Mobile home; Located on 5 acres
- Construction: Metal/vinyl siding; Crawl space foundation
- Exterior features: Metal roof; Gravel road access; Sloped lot
Interior
- Flooring: Tile
- Bathrooms: 1 full bathroom
- Heating & cooling: Baseboard electric heat
- Interior features: Tile floors; Paneling on walls/ceilings
- Laundry & utility: Laundry room
Neighborhood map
What this means for you Summary
Snapshot
- This is a 1-bed/1.0-bath manufactured listed at $60k.
Deal economics
- At list price, monthly cash flow is $336 ($4k/yr) — positive.
- The deal already cash-flows at list — no discount required.
- Meets the 1% rule at list price ($870 rent vs $60k).
- Recommended offer: $59k (1.5% below list) — sets the bar for market timing.
- Cap rate 13.0% vs local median 2.9% in Mammoth Spring — top-decile yield for the area; either an underpriced asset or a hidden risk that comps aren't pricing in. Stress-test before assuming the spread holds.
Location & tenants
- Location reads 77/100 on livability (#7 in AR, #2,817 nationally) — a middle-class / working-renter tenant base. Strengths: crime A+, cost of living A+, housing A+; Watch: schools C-, employment C-, amenities F.
- Mammoth Spring School District (town): math 31% / reading 39% proficiency, ranked #126 of 238 in AR (top 53%) — families likely to look elsewhere, expect single-tenant / working-renter base with shorter leases.
- Market conditions: 88 active listings in the ZIP.
Forward outlook
- In year one you build about $5k of equity ($415 loan paydown + $4k appreciation (7.0% local appreciation)).
- Fulton County population projected at -17% by 2050 — secular population decline; favor cash flow + early exit over multi-decade hold.
- At projected returns (7.0% appreciation + 3.0% rent growth), your $17k cash investment doubles in ~2 years — after that, you're playing with house money.
- By year 7, paydown + projected appreciation supports a ~$31k cash-out refi (75% LTV) — recoverable capital for the next deal without selling this one.
Negotiation context
- It's been on market 27 days — a 2% lower offer ($59k) is reasonable based on typical stale-listing flexibility.
- Current owner paid $29k; list at $60k implies a 107% gain — meaningful room to come down on a strong offer.
Questions for the listing agent
- Built in 1960 — when were the roof, HVAC, electrical panel, plumbing, and water heater last replaced?
- Is there a deadline driving the sale (1031 exchange, divorce, estate, relocation)? That informs how much negotiation room exists.
- What's the average days-on-market for RENTAL listings here right now (not sales)? A rising rental-DOM trend means longer vacancies and softer asking-rent achievability than the comps imply.
- What's the recent tenant-quality profile in this submarket — average credit score on applications, eviction rate, late-payment / NSF rate, and stable-employment percentage? A property-management company in the area should have these aggregated.
- How much new for-sale + rental construction is in the pipeline within 1–3 miles? Heavy new supply typically softens prices + rents 12–24 months out; constrained supply supports both.
Investment metrics
- 1% rule
- 1.45% ✓
- Cap rate
- 13.01%
- Cash-on-cash
- 24.01%
- DSCR
- 2.07
- GRM
- 5.7
CMA / ARV
No comps found within radius.
Projected returns pro-forma
6.95% appreciation · 3.0% rent growth · sell at horizon
- IRR
- 37.2%
- Equity multiple
- 3.51×
- Total profit
- $42,160
- Equity at exit
- $41,396
- IRR
- 33.9%
- Equity multiple
- 7.34×
- Total profit
- $106,493
- Equity at exit
- $78,468
Cash invested: $16,800 (down + closing). Projections, not guarantees.
Landlord ↔ Tenant lean methodology
- Overall (STATE)
- 92 Strongly Landlord-Friendly
- State Arkansas
- 92 Strongly Landlord-Friendly · R+14
- County
- — inherits STATE
- City
- — inherits STATE
ZIP-level market 72554
- Home prices YoY
- 3.3%
- Active inventory
- 88
- Price-to-rent
- 5.7×
Monthly cashflow live
- Estimated rent
- $870 medium interval (Pro) →
- Mortgage (P&I)
- −$315
- Tax from tax record
- −$11 /mo · $135/yr
- Insurance
- −$25
- HOA
- −$0
- Vacancy / Maint / Mgmt
- −$183
- Net cashflow
- $336
Break-even live
UW: 25.0% down · 7.5% · 30yr · 1.5% tax · 5.0% vac · 8.0% maint · 8.0% mgmt
Financing live
Cash to close
- Down payment
- $15,000
- Closing costs
- $1,800
- Reserves months
- —
- Total cash needed
- —
Loan-product check · same deal, 3 products live
Conventional
25% down · 7.5% · 30yr
- Down + closing
- —
- Monthly P&I
- —
- Monthly cashflow
- —
- DSCR
- —
- Eligible?
- —
Personal DTI + credit; lowest rate.
DSCR
20% down · 8.5% · 30yr
- Down + closing
- —
- Monthly P&I
- —
- Monthly cashflow
- —
- DSCR
- —
- Eligible?
- —
No personal income docs; deal must DSCR.
Hard money
10% down · 12.0% · 12mo
- Down + closing
- —
- Monthly P&I
- —
- Monthly cashflow
- —
- DSCR
- —
- Eligible?
- —
Short-term bridge; refi at stabilization.
Listing history 19 events
-
2026-06-19days on market $60,000 Active 27 DOM
-
2026-06-18days on market $60,000 Active 26 DOM
-
2026-06-17days on market $60,000 Active 25 DOM
-
2026-06-16days on market $60,000 Active 24 DOM
-
2026-06-15days on market $60,000 Active 23 DOM
-
2026-06-14days on market $60,000 Active 21 DOM
-
2026-06-12days on market $60,000 Active 20 DOM
-
2026-06-09days on market $60,000 Active 17 DOM
-
2026-06-08days on market $60,000 Active 16 DOM
-
2026-06-07days on market $60,000 Active 15 DOM
-
2026-06-07remarks 699-char remark
-
2026-06-07days on market $60,000 Active 14 DOM
-
2026-06-04days on market $60,000 Active 11 DOM
-
2026-06-02days on market $60,000 Active 10 DOM
-
2026-06-01days on market $60,000 Active 9 DOM
-
2026-05-31days on market $60,000 Active 8 DOM
-
2026-05-31statusdays on market $60,000 Active 7 DOM
-
2026-05-23$60,000 New Listing
-
2007-03-26soldstatus $29,000
ⓘ Source: listings_history table (triggers on properties + properties_extension) + one-shot
backfill from property_details.listing_events for pre-trigger history.
Tax reassessment forecast AR · Resets to sale price
- Current annual tax
- $135 · $11/mo
- Projected year-2 tax
- $384 · $32/mo
- Expected delta
- +$249/yr (+$21/mo · 184.7%)
ⓘ Screening estimate from a state-policy table — verify with the county assessor before closing.
Nearby sold comps map
Loading sold comps map…
Walkable amenities ~0.75 mi
Loading nearby amenities…
Taxation est. · year 1
- Rental income
- $10,435
- − Mortgage interest
- −$3,361
- − Property taxes
- −$135
- − Insurance
- −$300
- − Repairs & maintenance
- −$835
- − Management
- −$835
- − Depreciation
- −$1,745
- Taxable income
- $3,224
- Est. tax owed @ 24.0%
- −$774
- After-tax cash flow
- $3,259/yr
For passive investors: Depreciation is non-cash, so a rental often shows a tax loss while cash-flowing — sheltering income. Rental losses are passive: they offset passive income freely, and up to $25,000/yr can offset ordinary (W-2) income if you actively participate and your MAGI is under $100k (phasing out to $0 by $150k); unused losses carry forward. On sale, claimed depreciation is recaptured at up to 25%, and gains may owe capital-gains tax (a 1031 exchange can defer both). Figures are a year-1 estimate at your 24.0% rate — not tax advice; consult a CPA.
Schools (NCES district)
- District
- Mammoth Spring School District
- NCES district ID
- 0509270
- Math proficiency
- 31% ▼ -24.00%
- Reading proficiency
- 39% ▼ -10.00%
- Median HH income
- $32,157
- Composite
- 28.62/100
- National rank
- #6709
- State rank
- #126 of 238 in AR
Livability — Mammoth Spring
- Score
- 77/100
- State rank
- #7
- US rank
- #2817
Category grades
Schools grade is shown separately in the Schools card above.
Census & demographics
- Population (ZIP)
- 2,749
Population outlook (Fulton County) Hauer SSP2
- Today (2025)
- 11,739 people
- By 2030
- 11,330 · -3.5%
- By 2040
- 10,483 · -10.7%
- By 2050
- 9,717 · -17.2%
- By 2075
- 8,351 · -28.9%
- By 2100
- 6,853 · -41.6%
Race, ethnicity, and origin ACS 2023
- Neighborhood character
- Predominantly White (95%)
- Race & ethnicity
- White 95% Two or more races 5%
- Common ancestry
- Slovak 2% Serbian 1% Romanian 1%
Political lean MEDSL · Fulton
- 2024 margin
- Solid R (+62.1) · D 18.0% · R 80.1% · Other 1.9%
- 2008→2024 swing
- -43.3pp toward R · 2008: -18.9pp · 2024: -62.1pp
- All cycles
- 2024: R+62.1 2020: R+57.2 2016: R+50.7 2012: R+33.1 2008: R+18.9
Not yet ingested
- Civics
- —
Market trends
- HPI YoY
- ▲ 6.95%
- Current HPI
- 219.211
- Rent YoY
- —
- Metro
- —
- State GDP YoY
- ▲ 3.80%
- F500 in state
- 10
Industry mix (Fortune 500 HQ in AR)
| Industry | F500 HQs | Revenue |
|---|---|---|
| Retail | 1 | $681B |
|
||
| Food / Agriculture | 1 | $53B |
|
||
| Retail / Energy | 1 | $22B |
|
||
| Transportation / Logistics | 1 | $12B |
|
||
| Energy | 1 | $4B |
|
||
Price history
+106.9% since first listed2 events — show timeline
- 2026-05-23 Listed $60,000 CARMLS
- 2007-03-26 Sold (Public Records) $29,000 Public Records
Property tax history
+0.9%/yrLatest (2025): $135 · +0.0% YoY. Source: county tax records.
Cash-flow waterfall
monthlySold comps — $/sqft
last 12 mo · ≤1 miLoading sold comps…