745 E 800 N · Basalt, ID
Flood risk 1/10 · Minimal
- FEMA flood zone
- X
- Chance of flooding over 30 yrs
- 0.0%
- Est. flood insurance / yr
- $507 – $1,088
Fire risk 1/10 · Minimal
- Est. fire insurance / yr
- $584 – $1,086
Heat risk 3/10 · Minor
- Hot days now (above 91°F)
- 7 days/yr
- Hot days in 30 yrs
- 17 days/yr
Wind risk 1/10 · Minimal
- Chance of severe wind over 30 yrs
- —
Air-quality risk 5/10 · Moderate
- Unhealthy air days now
- 7 days/yr
- Unhealthy air days in 30 yrs
- 7 days/yr
Risk factors via First Street. Map © Google.
Why this score? — see what drove the B- grade
The composite is a weighted blend of 9 inputs, each scored 0–100. Each bar is that input's sub-score; the figure is the points it added to the 100-point composite (weight × sub-score).
- Cash flow +30.0/30.0
- 1% rule +10.0/10.0
- DSCR +10.0/10.0
- ARV discount +7.5/15.0
- Schools +4.1/10.0
- Livability +3.2/5.0
- Rent growth +2.5/5.0
- Condition / age +2.5/5.0
- Appreciation +0.0/10.0
$55,900
🖨 Deal sheet 📄 Offer letter ✓ Due diligence
Listing remarks
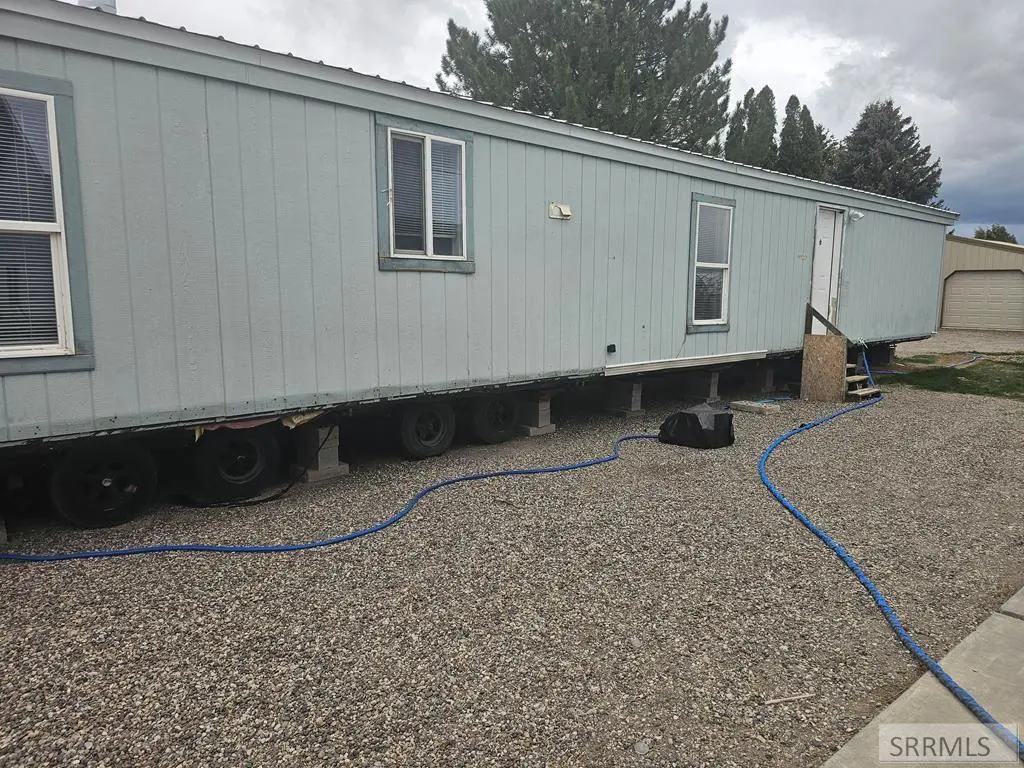
* * Price Reduced * * Well-maintained 1997 manufactured home offering 924 sq ft of comfortable living space. This clean and move-in-ready home features 2 bedrooms and 2 bathrooms with a functional layout. Pride of ownership shows throughout, making it a great option for a variety of buyers. Home is not on land and is ready to move/ will need to be moved. A great opportunity for affordable homeownership—schedule your showing today!
Key facts
- Built 1997
- Listed 59 days
Property features AI
Exterior
- Home design: Manufactured home (manufactured without land); Single-level / One story
- Exterior features: Metal roof
Interior
- Kitchen: Refrigerator
- Flooring: Linoleum; Carpet
- Bathrooms: 2 full bathrooms
- Heating & cooling: Electric heating
- Interior features: Walk-in closets; Laminate counters
Neighborhood map
What this means for you Summary
Snapshot
- This is a 2-bed/2.0-bath single-family listed at $56k.
Deal economics
- At list price, monthly cash flow is $471 ($6k/yr) — positive.
- The deal already cash-flows at list — no discount required.
- Meets the 1% rule at list price ($1k rent vs $56k).
- Recommended offer: $54k (3.0% below list) — sets the bar for market timing.
Location & tenants
- Location reads 65/100 on livability (#120 in ID) — a middle-class / working-renter tenant base. Strengths: cost of living A+, housing A+, crime A-; Watch: health & safety C-, schools F, amenities F.
- Firth District (rural): math 43% / reading 53% proficiency, ranked #41 of 92 in ID (top 45%) — families likely to look elsewhere, expect single-tenant / working-renter base with shorter leases.
- Market conditions: 141 active listings in the ZIP; 251 units permitted in Bingham County in 2024 (0 in 5+ unit buildings).
Forward outlook
- Local home prices are declining (-3.0%/yr); year-one equity from $386 of loan paydown is wiped out by about $2k of value loss. Plan a longer hold.
- Bingham County population projected at -23% by 2050 — secular population decline; favor cash flow + early exit over multi-decade hold.
- At projected returns (-3.0% appreciation + 3.0% rent growth), your $16k cash investment doubles in ~4 years — after that, you're playing with house money.
Negotiation context
- It's been on market 60 days — a 3% lower offer ($54k) is reasonable based on typical stale-listing flexibility.
Questions for the listing agent
- It's been on market 60 days. Have you received any prior offers? Is the seller open to a 3% concession, seller financing, or rate buy-down credit?
- Is there a deadline driving the sale (1031 exchange, divorce, estate, relocation)? That informs how much negotiation room exists.
- Schools are F-rated, which usually means shorter tenancies and higher turnover. Who's the typical renter profile here, and what's been the actual vacancy rate?
- What's the average days-on-market for RENTAL listings here right now (not sales)? A rising rental-DOM trend means longer vacancies and softer asking-rent achievability than the comps imply.
- What's the recent tenant-quality profile in this submarket — average credit score on applications, eviction rate, late-payment / NSF rate, and stable-employment percentage? A property-management company in the area should have these aggregated.
- How much new for-sale + rental construction is in the pipeline within 1–3 miles? Heavy new supply typically softens prices + rents 12–24 months out; constrained supply supports both.
Investment metrics
- 1% rule
- 1.82% ✓
- Cap rate
- 16.39%
- Cash-on-cash
- 36.08%
- DSCR
- 2.61
- GRM
- 4.6
CMA / ARV
No comps found within radius.
Projected returns pro-forma
-3.0% appreciation · 3.0% rent growth · sell at horizon
- IRR
- 31.8%
- Equity multiple
- 2.33×
- Total profit
- $20,894
- Equity at exit
- $8,335
- IRR
- 38.9%
- Equity multiple
- 4.62×
- Total profit
- $56,713
- Equity at exit
- $4,833
Cash invested: $15,652 (down + closing). Projections, not guarantees.
Landlord ↔ Tenant lean methodology
- Overall (STATE)
- 91 Strongly Landlord-Friendly
- State Idaho
- 91 Strongly Landlord-Friendly · R+18
- County
- — inherits STATE
- City
- — inherits STATE
ZIP-level market 83274
- Active inventory
- 141
- Price-to-rent
- 4.6×
Monthly cashflow live
- Estimated rent
- $1,016 medium interval (Pro) →
- Mortgage (P&I)
- −$293
- Tax from tax record
- −$15 /mo · $185/yr
- Insurance
- −$23
- HOA
- −$0
- Vacancy / Maint / Mgmt
- −$213
- Net cashflow
- $471
Break-even live
UW: 25.0% down · 7.5% · 30yr · 1.5% tax · 5.0% vac · 8.0% maint · 8.0% mgmt
Financing live
Cash to close
- Down payment
- $13,975
- Closing costs
- $1,677
- Reserves months
- —
- Total cash needed
- —
Loan-product check · same deal, 3 products live
Conventional
25% down · 7.5% · 30yr
- Down + closing
- —
- Monthly P&I
- —
- Monthly cashflow
- —
- DSCR
- —
- Eligible?
- —
Personal DTI + credit; lowest rate.
DSCR
20% down · 8.5% · 30yr
- Down + closing
- —
- Monthly P&I
- —
- Monthly cashflow
- —
- DSCR
- —
- Eligible?
- —
No personal income docs; deal must DSCR.
Hard money
10% down · 12.0% · 12mo
- Down + closing
- —
- Monthly P&I
- —
- Monthly cashflow
- —
- DSCR
- —
- Eligible?
- —
Short-term bridge; refi at stabilization.
Listing history 20 events
-
2026-06-19days on market $55,900 Active 60 DOM
-
2026-06-18days on market $55,900 Active 59 DOM
-
2026-06-17days on market $55,900 Active 58 DOM
-
2026-06-16days on market $55,900 Active 57 DOM
-
2026-06-15days on market $55,900 Active 56 DOM
-
2026-06-14days on market $55,900 Active 54 DOM
-
2026-06-12days on market $55,900 Active 53 DOM
-
2026-06-09days on market $55,900 Active 50 DOM
-
2026-06-09price $55,900 Active 49 DOM
-
2026-06-08days on market $59,900 Active 49 DOM
-
2026-06-07days on market $59,900 Active 48 DOM
-
2026-06-05days on market $59,900 Active 45 DOM
-
2026-06-03days on market $59,900 Active 44 DOM
-
2026-06-02days on market $59,900 Active 43 DOM
-
2026-06-01days on market $59,900 Active 42 DOM
-
2026-05-31days on market $59,900 Active 41 DOM
-
2026-05-30days on market $59,900 Active 40 DOM
-
2026-05-18price $59,900
-
2026-04-29price $64,900
-
2026-04-20$69,900 Active
ⓘ Source: listings_history table (triggers on properties + properties_extension) + one-shot
backfill from property_details.listing_events for pre-trigger history.
Tax reassessment forecast ID · Resets to sale price
- Current annual tax
- $185 · $15/mo
- Projected year-2 tax
- $386 · $32/mo
- Expected delta
- +$201/yr (+$17/mo · 109.0%)
ⓘ Screening estimate from a state-policy table — verify with the county assessor before closing.
Climate risk First Street
- Flood 1/10 Low FEMA zone X · 0% chance over 30 yrs
- Wildfire 1/10 Low
- Heat 3/10 Moderate 7 d/yr ≥91°F today · 17 d/yr by 30 yrs out
- Wind 1/10 Low
- Air quality 5/10 Major 7 unhealthy d/yr today · 7 by 30 yrs out
Nearby sold comps map
Loading sold comps map…
Walkable amenities ~0.75 mi
Loading nearby amenities…
Taxation est. · year 1
- Rental income
- $12,188
- − Mortgage interest
- −$3,131
- − Property taxes
- −$185
- − Insurance
- −$280
- − Repairs & maintenance
- −$975
- − Management
- −$975
- − Depreciation
- −$1,626
- Taxable income
- $5,017
- Est. tax owed @ 24.0%
- −$1,204
- After-tax cash flow
- $4,443/yr
For passive investors: Depreciation is non-cash, so a rental often shows a tax loss while cash-flowing — sheltering income. Rental losses are passive: they offset passive income freely, and up to $25,000/yr can offset ordinary (W-2) income if you actively participate and your MAGI is under $100k (phasing out to $0 by $150k); unused losses carry forward. On sale, claimed depreciation is recaptured at up to 25%, and gains may owe capital-gains tax (a 1031 exchange can defer both). Figures are a year-1 estimate at your 24.0% rate — not tax advice; consult a CPA.
Schools (NCES district)
- District
- Firth District
- NCES district ID
- 1601080
- Math proficiency
- 43% ▲ 4.00%
- Reading proficiency
- 53% ▲ 10.00%
- Median HH income
- $51,630
- Composite
- 41.25/100
- National rank
- #3527
- State rank
- #41 of 92 in ID
Livability — Basalt
- Score
- 65/100
- State rank
- #120
- US rank
- #12838
Category grades
Schools grade is shown separately in the Schools card above.
Census & demographics
- City population
- 520
- Population (ZIP)
- 11,284
Population outlook (Bingham County) Hauer SSP2
- Today (2025)
- 42,176 people
- By 2030
- 40,396 · -4.2%
- By 2040
- 36,693 · -13.0%
- By 2050
- 32,485 · -23.0%
- By 2075
- 21,927 · -48.0%
- By 2100
- 12,716 · -69.9%
Race, ethnicity, and origin ACS 2023
- Neighborhood character
- Predominantly White (86%)
- Race & ethnicity
- White 86% Hispanic / Latino 9% Two or more races 6%
- Hispanic origin (detail)
- Mexican 7%
- Common ancestry
- Italian 4% Slovak 2% Lithuanian 2%
- Foreign-born
- 4% · Canada
- Languages at home
- 90% English-only · Spanish 8% Vietnamese 1%
Political lean MEDSL · Bingham
- 2024 margin
- Solid R (+59.6) · D 18.8% · R 78.4% · Other 2.8%
- 2008→2024 swing
- -14.1pp toward R · 2008: -45.5pp · 2024: -59.6pp
- All cycles
- 2024: R+59.6 2020: R+55.6 2016: R+48.0 2012: R+54.6 2008: R+45.5
Not yet ingested
- Civics
- —
Market trends
- HPI YoY
- ▼ -156.20%
- Current HPI
- 272.7901
- Rent YoY
- —
- Metro
- —
- State GDP YoY
- ▲ 4.51%
- F500 in state
- 6
Industry mix (Fortune 500 HQ in ID)
| Industry | F500 HQs | Revenue |
|---|---|---|
| Retail | 1 | $79B |
|
||
| Technology | 1 | $25B |
|
||
| Food / Agriculture | 1 | $6B |
|
||
Price history
-14.3% since first listed3 events — show timeline
- 2026-05-18 Price Changed $59,900 SRMLS
- 2026-04-29 Price Changed $64,900 SRMLS
- 2026-04-20 Listed $69,900 SRMLS
Property tax history
-2.9%/yrLatest (2025): $185 · +17.6% YoY. Source: county tax records.
Cash-flow waterfall
monthlySold comps — $/sqft
last 12 mo · ≤1 miLoading sold comps…