283 Bascom Ave · Ross, PA
Flood risk 1/10 · Minimal
- FEMA flood zone
- X (unshaded)
- Chance of flooding over 30 yrs
- 0.0%
- Est. flood insurance / yr
- $473 – $860
Fire risk 1/10 · Minimal
- Est. fire insurance / yr
- $511 – $949
Heat risk 3/10 · Minor
- Hot days now (above 97°F)
- 7 days/yr
- Hot days in 30 yrs
- 16 days/yr
Wind risk 2/10 · Minimal
- Chance of severe wind over 30 yrs
- —
Air-quality risk 4/10 · Minor
- Unhealthy air days now
- 4 days/yr
- Unhealthy air days in 30 yrs
- 5 days/yr
Risk factors via First Street. Map © Google.
Why this score? — see what drove the B grade
The composite is a weighted blend of 9 inputs, each scored 0–100. Each bar is that input's sub-score; the figure is the points it added to the 100-point composite (weight × sub-score).
- Cash flow +30.0/30.0
- 1% rule +10.0/10.0
- DSCR +10.0/10.0
- ARV discount +7.5/15.0
- Schools +5.2/10.0
- Rent growth +4.7/5.0
- Livability +2.5/5.0
- Condition / age +2.5/5.0
- Appreciation +0.0/10.0
$65,500
🖨 Deal sheet 📄 Offer letter ✓ Due diligence
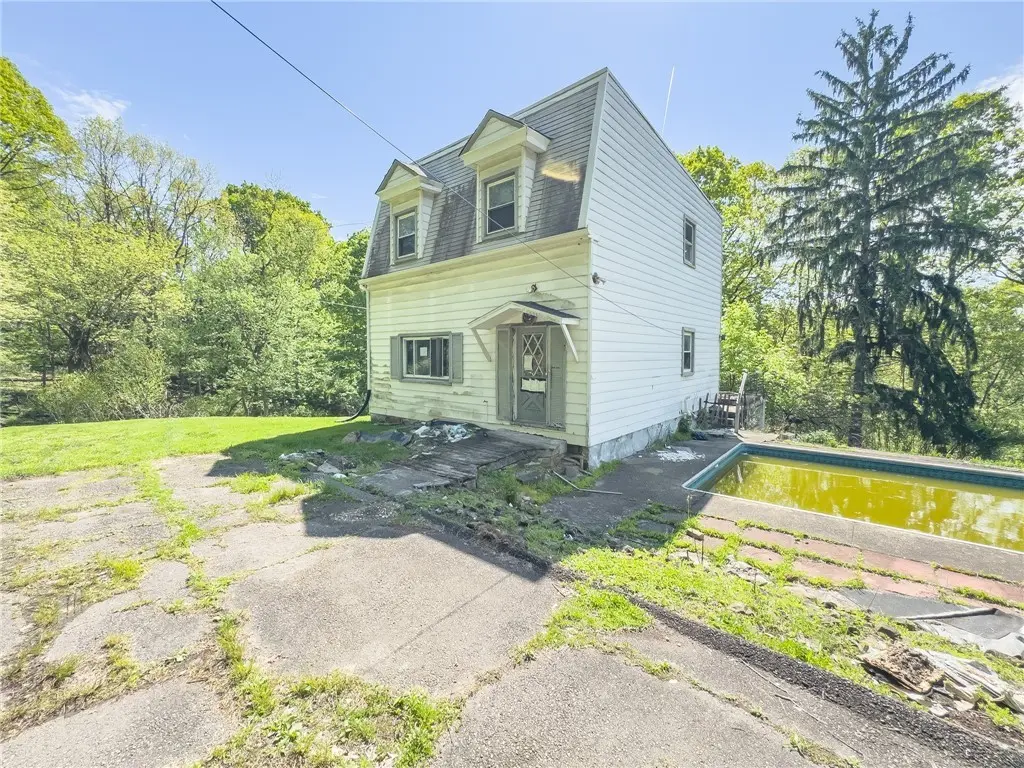
Listing remarks MLS
Secluded area of Ross Township. Home has potential but is in need of substantial work. Use caution near the in ground pool. Left portion of structure encroaches on neighboring parcel.
Key facts
- Secluded area
- In ground pool
- 7,501 sq ft lot
Tags
Neighborhood map
What this means for you Summary
Snapshot
- This is a 3-bed/1.0-bath single-family listed at $66k.
Deal economics
- At list price, monthly cash flow is $995 ($12k/yr) — positive.
- The deal already cash-flows at list — no discount required.
- Meets the 1% rule at list price ($2k rent vs $66k).
- Recommended offer: $58k (12.0% below list) — sets the bar for market timing.
Location & tenants
- Location reads: area grade B — affects rentability + tenant quality, not the cash-flow math above.
- North Hills SD (suburban): math 48% / reading 72% proficiency, ranked #70 of 539 in PA (top 13%) — acceptable for families but not a draw, mixed tenant base, ~2y average lease; only 20% free/reduced lunch — higher-income household profile.
- Market conditions: Rents rising fast (+8.8%/yr); 9 active listings in the ZIP; 1 comparable units currently listed for rent nearby; 2,996 units permitted in Allegheny County in 2024 (1,588 in 5+ unit buildings).
- This rent runs 39% of the median local income ($62k/yr) — at the standard rent-burdened threshold; future hikes will face affordability resistance.
Forward outlook
- Local home prices are declining (-3.0%/yr); year-one equity from $453 of loan paydown is wiped out by about $2k of value loss. Plan a longer hold.
- At projected returns (-3.0% appreciation + 8.0% rent growth), your $18k cash investment doubles in ~2 years — after that, you're playing with house money.
Negotiation context
- It's been on market 174 days — a 12% lower offer ($58k) is reasonable based on typical stale-listing flexibility.
- 2 sale attempts; this cycle's ask has dropped $14k (17%) from the opening price — seller is motivated, your offer sets the floor, not the list.
Risks & watch-outs
- Watch-outs: property tax is 4.0% of price; built in 1939 — expect roof / HVAC / electrical / plumbing capex.
Questions for the listing agent
- It's been on market 174 days. Have you received any prior offers? Is the seller open to a 12% concession, seller financing, or rate buy-down credit?
- Built in 1939 — when were the roof, HVAC, electrical panel, plumbing, and water heater last replaced?
- Property tax is high relative to price — has the assessment been appealed recently, and will the sale trigger a re-assessment?
- Why hasn't it sold? Are there any deal-killer items the seller is aware of (foundation, flood, title, zoning, code violations)?
- Is there a deadline driving the sale (1031 exchange, divorce, estate, relocation)? That informs how much negotiation room exists.
- What's the average days-on-market for RENTAL listings here right now (not sales)? A rising rental-DOM trend means longer vacancies and softer asking-rent achievability than the comps imply.
- What's the recent tenant-quality profile in this submarket — average credit score on applications, eviction rate, late-payment / NSF rate, and stable-employment percentage? A property-management company in the area should have these aggregated.
- How much new for-sale + rental construction is in the pipeline within 1–3 miles? Heavy new supply typically softens prices + rents 12–24 months out; constrained supply supports both.
Investment metrics
- 1% rule
- 3.06% ✓
- Cap rate
- 24.53%
- Cash-on-cash
- 65.11%
- DSCR
- 3.90
- GRM
- 2.7
CMA / ARV
- ARV (median comp)
- $200,928
- List price
- $65,500
- Delta
- -67.40%
- Verdict
- UNDERPRICED
- Comps
- 20 within 1.0 mi
Show comp detail 9 sales within ~0.75 mi
| Address | Dist | Beds/Ba | Sqft | Sold | Price | $/sf | Match |
|---|---|---|---|---|---|---|---|
| 69 Transvaal Ave | 0.29mi | 4/2.0 (+1) | 2,270 (-7%) | 8mo | $199,000 | $88 | 59 |
| 3948 Vinceton St | 0.43mi | 4/2.0 (+1) | 2,472 (+1%) | 17mo | $105,000 | $42 | 55 |
| 1144 Goe Ave | 0.65mi | 3/1.5 | 2,139 (-12%) | 0mo | $210,000 | $98 | 47 |
| 22 York Dr | 0.25mi | 4/2.0 (+1) | 2,098 (-14%) | 19mo | $287,000 | $137 | 40 |
| 34 Bonvue St | 0.67mi | 3/1.5 | 2,200 (-10%) | 14mo | $275,000 | $125 | 39 |
| 138 Enger Ave | 0.70mi | 4/3.0 (+1) | 2,201 (-10%) | 1mo | $180,000 | $82 | 37 |
| 211 Perryview Ave | 0.19mi | 4/3.0 (+1) | 2,760 (+13%) | 24mo | $425,000 | $154 | 36 |
| 4101 Franklin Rd | 0.40mi | 4/3.0 (+1) | 2,112 (-14%) | 13mo | $297,000 | $141 | 34 |
| 3941 Brandon Rd | 0.71mi | 3/2.0 | 2,267 (-7%) | 22mo | $250,000 | $110 | 32 |
Match score weights: distance 35% · size 25% · config 20% · recency 20%. Top-matched comps best support the ARV.
Projected returns pro-forma
-3.0% appreciation · 8.0% rent growth · sell at horizon
- IRR
- 70.4%
- Equity multiple
- 4.46×
- Total profit
- $63,484
- Equity at exit
- $9,766
- IRR
- 76.1%
- Equity multiple
- 11.12×
- Total profit
- $185,608
- Equity at exit
- $5,663
Cash invested: $18,340 (down + closing). Projections, not guarantees.
Landlord ↔ Tenant lean methodology
- Overall (STATE)
- 62 Landlord-Friendly
- State Pennsylvania
- 62 Landlord-Friendly · EVEN
- County
- — inherits STATE
- City
- — inherits STATE
ZIP-level market 15214
- Home prices YoY
- -32.6%
- Rents YoY
- 8.8%
- Active inventory
- 9
- Price-to-rent
- 2.7×
Monthly cashflow live
- Estimated rent
- $2,006 medium interval (Pro) →
- Mortgage (P&I)
- −$343
- Tax from tax record
- −$219 /mo · $2,624/yr
- Insurance
- −$27
- HOA
- −$0
- Vacancy / Maint / Mgmt
- −$421
- Net cashflow
- $995
Break-even live
UW: 25.0% down · 7.5% · 30yr · 1.5% tax · 5.0% vac · 8.0% maint · 8.0% mgmt
Financing live
Cash to close
- Down payment
- $16,375
- Closing costs
- $1,965
- Reserves months
- —
- Total cash needed
- —
Loan-product check · same deal, 3 products live
Conventional
25% down · 7.5% · 30yr
- Down + closing
- —
- Monthly P&I
- —
- Monthly cashflow
- —
- DSCR
- —
- Eligible?
- —
Personal DTI + credit; lowest rate.
DSCR
20% down · 8.5% · 30yr
- Down + closing
- —
- Monthly P&I
- —
- Monthly cashflow
- —
- DSCR
- —
- Eligible?
- —
No personal income docs; deal must DSCR.
Hard money
10% down · 12.0% · 12mo
- Down + closing
- —
- Monthly P&I
- —
- Monthly cashflow
- —
- DSCR
- —
- Eligible?
- —
Short-term bridge; refi at stabilization.
Rent comps 1 comps
| Address | Beds | Baths | Sqft | Rent | $/sqft | DOM | Units | Dist |
|---|---|---|---|---|---|---|---|---|
| 404 Aprilmae Way Pittsburgh, PA | 3.0 | 2.5 | 1833 | $2,700 | $1.47 | 14d | 1 | 1.00mi |
Listing history 18 events
-
2026-06-18days on market $65,500 Active 174 DOM
-
2026-06-17days on market $65,500 Active 173 DOM
-
2026-06-16days on market $65,500 Active 172 DOM
-
2026-06-15days on market $65,500 Active 171 DOM
-
2026-06-13days on market $65,500 Active 169 DOM
-
2026-06-09days on market $65,500 Active 165 DOM
-
2026-06-08days on market $65,500 Active 164 DOM
-
2026-06-07days on market $65,500 Active 163 DOM
-
2026-06-05days on market $65,500 Active 160 DOM
-
2026-06-03days on market $65,500 Active 159 DOM
-
2026-06-02days on market $65,500 Active 158 DOM
-
2026-06-01days on market $65,500 Active 157 DOM
-
2026-05-31days on market $65,500 Active 156 DOM
-
2026-05-06price $65,500 183-char remark
Show marketing remark (183 chars)
Secluded area of Ross Township. Home has potential but is in need of substantial work. Use caution near the in ground pool. Left portion of structure encroaches on neighboring parcel.
-
2026-04-01status Active 183-char remark
Show marketing remark (183 chars)
Secluded area of Ross Township. Home has potential but is in need of substantial work. Use caution near the in ground pool. Left portion of structure encroaches on neighboring parcel.
-
2026-04-01price $72,700 183-char remark
Show marketing remark (183 chars)
Secluded area of Ross Township. Home has potential but is in need of substantial work. Use caution near the in ground pool. Left portion of structure encroaches on neighboring parcel.
-
2026-01-17historical Contingent 183-char remark
Show marketing remark (183 chars)
Secluded area of Ross Township. Home has potential but is in need of substantial work. Use caution near the in ground pool. Left portion of structure encroaches on neighboring parcel.
-
2025-12-26$79,000 Active 183-char remark
Show marketing remark (183 chars)
Secluded area of Ross Township. Home has potential but is in need of substantial work. Use caution near the in ground pool. Left portion of structure encroaches on neighboring parcel.
ⓘ Source: listings_history table (triggers on properties + properties_extension) + one-shot
backfill from property_details.listing_events for pre-trigger history.
Tax reassessment forecast PA · Partial reset (capped growth)
- Current annual tax
- $2,624 · $219/mo
- Projected year-2 tax
- $2,624 · $219/mo
- Expected delta
- $0/yr ($0/mo · 0.0%)
ⓘ Screening estimate from a state-policy table — verify with the county assessor before closing.
Climate risk First Street
- Flood 1/10 Low FEMA zone X (unshaded) · 0% chance over 30 yrs
- Wildfire 1/10 Low
- Heat 3/10 Moderate 7 d/yr ≥97°F today · 16 d/yr by 30 yrs out
- Wind 2/10 Low
- Air quality 4/10 Moderate 4 unhealthy d/yr today · 5 by 30 yrs out
Nearby sold comps map
Loading sold comps map…
Walkable amenities ~0.75 mi
Loading nearby amenities…
Taxation est. · year 1
- Rental income
- $24,070
- − Mortgage interest
- −$3,669
- − Property taxes
- −$2,624
- − Insurance
- −$328
- − Repairs & maintenance
- −$1,926
- − Management
- −$1,926
- − Depreciation
- −$1,905
- Taxable income
- $11,693
- Est. tax owed @ 24.0%
- −$2,806
- After-tax cash flow
- $9,136/yr
For passive investors: Depreciation is non-cash, so a rental often shows a tax loss while cash-flowing — sheltering income. Rental losses are passive: they offset passive income freely, and up to $25,000/yr can offset ordinary (W-2) income if you actively participate and your MAGI is under $100k (phasing out to $0 by $150k); unused losses carry forward. On sale, claimed depreciation is recaptured at up to 25%, and gains may owe capital-gains tax (a 1031 exchange can defer both). Figures are a year-1 estimate at your 24.0% rate — not tax advice; consult a CPA.
Schools (NCES district)
- District
- North Hills SD
- NCES district ID
- 4217220
- Math proficiency
- 48% ▼ -20.00%
- Reading proficiency
- 72% ▼ -10.00%
- Median HH income
- $60,841
- Composite
- 52.02/100
- National rank
- #1637
- State rank
- #70 of 539 in PA
Livability — Ross
No livability data for this city. (Only ~50 U.S. cities are tracked.)
Census & demographics
- County
- Allegheny County · 1,022,028 people
- Metro
- Pittsburgh, PA
- Population (ZIP)
- 14,048
- Household income
- $61,645
- Rent vs Own
- Severe rent burden
- 428.0
Population outlook (Allegheny County) Hauer SSP2
- Today (2025)
- 1,250,282 people
- By 2030
- 1,256,482 · +0.5%
- By 2040
- 1,256,318 · +0.5%
- By 2050
- 1,244,169 · -0.5%
- By 2075
- 1,197,693 · -4.2%
- By 2100
- 1,093,187 · -12.6%
Race, ethnicity, and origin ACS 2023
- Neighborhood character
- Majority White (56%)
- Race & ethnicity
- White 56% Black 37% Two or more races 5% Hispanic / Latino 2%
- Common ancestry
- Romanian 4% Lithuanian 1% Iranian 1%
- Foreign-born
- 7% · Canada
- Languages at home
- 92% English-only · Spanish 2%
Political lean MEDSL · Allegheny
- 2024 margin
- Strong D (+20.3) · D 59.7% · R 39.4%
- 2008→2024 swing
- +4.8pp toward D · 2008: 15.5pp · 2024: 20.3pp
- All cycles
- 2024: D+20.3 2020: D+20.4 2016: D+16.4 2012: D+14.4 2008: D+15.5
Not yet ingested
- Civics
- —
Market trends
- HPI YoY
- ▼ -127.94%
- Current HPI
- 264.0977
- Rent YoY
- ▲ 8.83%
- Metro
- Pittsburgh, PA
- State GDP YoY
- ▲ 1.68%
- F500 in state
- 34
Industry mix (Fortune 500 HQ in PA)
| Industry | F500 HQs | Revenue |
|---|---|---|
| Healthcare | 2 | $309B |
|
||
| Insurance | 2 | $27B |
|
||
| Telecommunications / Media | 1 | $124B |
|
||
| Industrial Distribution | 1 | $22B |
|
||
| Financial Services | 1 | $20B |
|
||
| Chemicals / Materials | 1 | $18B |
|
||
Price history
-17.1% since first listed5 events — show timeline
- 2026-05-06 Price Changed $65,500 West Penn MLS
- 2026-04-01 Relisted — West Penn MLS
- 2026-04-01 Price Changed $72,700 West Penn MLS
- 2026-01-17 Contingent — West Penn MLS
- 2025-12-26 Listed $79,000 West Penn MLS
Property tax history
+4.0%/yrLatest (2026): $2,624 · +28.0% YoY. Source: county tax records.
Cash-flow waterfall
monthlySold comps — $/sqft
last 12 mo · ≤1 miLoading sold comps…