1527 Dennison St · Dallas, TX
Flood risk 1/10 · Minimal
- FEMA flood zone
- X
- Chance of flooding over 30 yrs
- 0.0%
- Est. flood insurance / yr
- $507 – $1,088
Fire risk 1/10 · Minimal
- Est. fire insurance / yr
- $1,222 – $2,270
Heat risk 8/10 · Major
- Hot days now (above 109°F)
- 7 days/yr
- Hot days in 30 yrs
- 23 days/yr
Wind risk 6/10 · Moderate
- Chance of severe wind over 30 yrs
- 27.0%
Air-quality risk 3/10 · Minor
- Unhealthy air days now
- 2 days/yr
- Unhealthy air days in 30 yrs
- 3 days/yr
Risk factors via First Street. Map © Google.
Why this score? — see what drove the F grade
The composite is a weighted blend of 9 inputs, each scored 0–100. Each bar is that input's sub-score; the figure is the points it added to the 100-point composite (weight × sub-score).
- Appreciation +10.0/10.0
- ARV discount +7.5/15.0
- Livability +4.0/5.0
- Schools +2.8/10.0
- Condition / age +2.5/5.0
- Rent growth +1.4/5.0
- Cash flow +0.9/30.0
- 1% rule +0.0/10.0
- DSCR +0.0/10.0
$649,800
🖨 Deal sheet (PDF) 📄 Offer letter ✓ Due diligence
Listing remarks
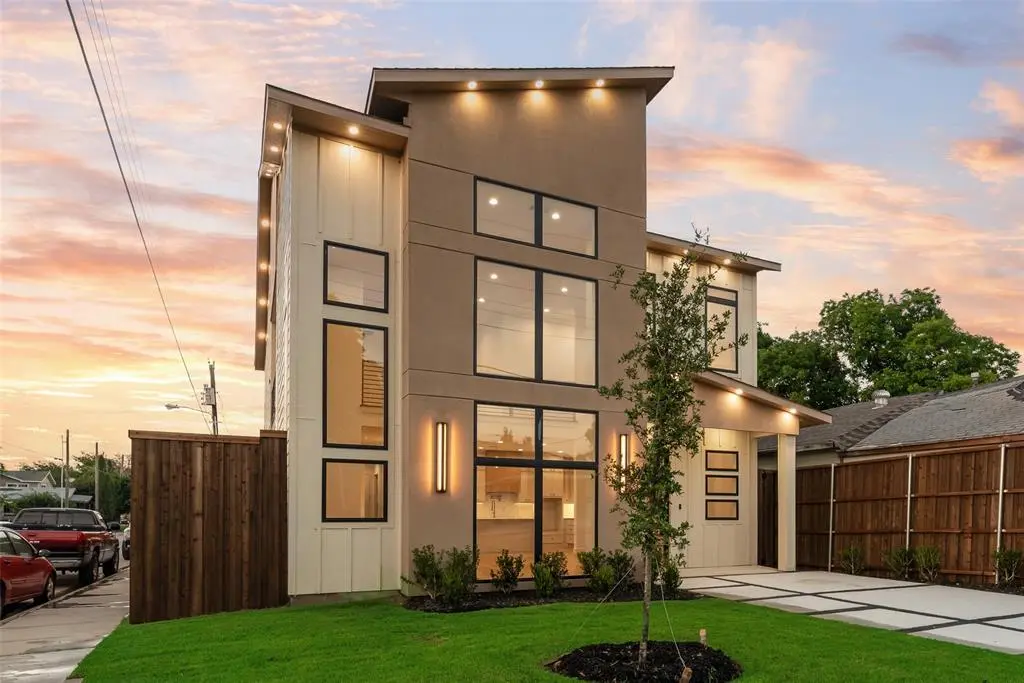
Imagine stepping into a stunning, modern two-story haven with four spacious bedrooms, three and a half luxurious baths, and a two-car garage that fits your lifestyle perfectly. With real wood floors that bring warmth to every step, foam insulation for year-round comfort, and a built-in sprinkler system for effortless care, this home is designed to elevate your living experience. Every detail of this home whispers elegance, comfort, and convenience. From the open spaces perfect for family gatherings to the quiet corners where you can unwind, this is more than a house—it’s where your best memories will be made. Buyers agent and buyer to verify all information for accuracy.
Key facts
- Foam insulation
- Real wood floors
- 4,617 sq ft lot
Tags
Property features AI
Finance
- Other: Subdivision: Wheeler & Reuss Eagle Ford; County: Dallas
- HOA & community: No association
Exterior
- Parking: Attached 2-car garage; Covered parking for 2 vehicles; Garage faces side; 2-car single door
- Utilities: City water; City sewer; Not in a municipal utility district
- Home design: Single family residence; Residential property; Two-story; New construction (completed in 2026)
- Construction: Composition roof; Siding and stucco exterior; Slab foundation; Built in 2026
- Exterior features: Wood fencing; Covered patio/porch; Landscaped yard; Sprinkler system
Interior
- Kitchen: Dishwasher; Disposal; Gas range; Microwave
- Bedrooms: 4 bedrooms (primary bedroom on level 1)
- Flooring: Ceramic tile; Hardwood
- Bathrooms: 3 full bathrooms; 1 half bathroom
- Heating & cooling: Central heating (electric); Central air; Ceiling fan(s)
- Interior features: Decorative lighting; Eat-in kitchen; Flat screen wiring; Kitchen island; Open floorplan; Pantry; Walk-in closet(s); Wired for data; One living area; One dining area; Two levels
- Laundry & utility: Washer hookup; Electric dryer hookup; Utility room
Neighborhood map
What this means for you Summary
Snapshot
- This is a 2-bed/1.0-bath single-family listed at $650k.
Deal economics
- At list price, monthly cash flow is $-3k ($-33k/yr) — negative.
- To cash-flow at today's rent, offer at most $169k (73.9% below list).
- To meet the 1% rule (rent ≥ 1% of price), the offer needs to be $154k (76.3% below list).
- Recommended offer: $154k (76.3% below list) — sets the bar for 1% rule.
- Cap rate 1.3% vs local median 2.3% in Dallas — below-typical yield; the buyer is paying a premium for something (appreciation thesis, condition, location) that the cap rate doesn't capture.
Location & tenants
- Location reads 81/100 on livability (#24 in TX, #1,380 nationally) — a professional / high-income tenant draw. Strengths: amenities A+, commute A+, housing A+; Watch: crime F.
- Dallas ISD (urban): math 31% / reading 36% proficiency, ranked #559 of 826 in TX (top 68%) — families likely to look elsewhere, expect single-tenant / working-renter base with shorter leases; 83% free/reduced lunch — lower-income household profile, screen leases tightly.
- Zoned schools: C F Carr El (math 32% / reading 22%, grade F, #2,791 of 4,322 statewide, top 68%, 281 students, 99% FRL); D A Hulcy Steam Middle (math 33% / reading 32%, grade F, #947 of 1,662 statewide, top 58%, 423 students, 88% FRL); L G Pinkston H S (math 10% / reading 21%, grade F, #1,505 of 1,632 statewide, top 92%, 1,139 students, 92% FRL).
- Market conditions: Rents falling (-4.2%/yr); 249 active listings in the ZIP; 36 comparable units currently listed for rent nearby; rentals at typical pace (median 17d on market — plan ~3-4 weeks tenant-placement turnaround); 12,577 units permitted in Dallas County in 2024 (6,829 in 5+ unit buildings).
- This rent runs 31% of the median local income ($60k/yr) — at the standard rent-burdened threshold; future hikes will face affordability resistance.
Forward outlook
- In year one you build about $69k of equity ($4k loan paydown + $65k appreciation (10.0% local appreciation)).
- Dallas County population projected at +35% by 2050 — long-run rental-demand tailwind backs the buy-and-hold thesis.
- By year 2, paydown + projected appreciation supports a ~$112k cash-out refi (75% LTV) — recoverable capital for the next deal without selling this one.
Negotiation context
- Only 12 days on market — expect competitive offers; lowballing is unlikely to land.
Risks & watch-outs
- Climate carrying-cost: major wind risk, 27% chance of damaging wind over 30y; extreme-heat days projected 7→23/yr by 2055 (HVAC capex compounding) — expect insurance premiums to compound above CPI over the hold.
Questions for the listing agent
- What do current leases actually rent for vs. the listed asking? Can we see a recent rent roll and the last 12 months of T-12 income?
- Is there a deadline driving the sale (1031 exchange, divorce, estate, relocation)? That informs how much negotiation room exists.
- Crime grade is F in this area — have there been break-ins, vandalism, or insurance claims at this property in the last 3 years? What carrier currently insures it and at what premium?
- The area grade is low — what's the realistic commute time and amenity access for the typical tenant pool here? Any planned neighborhood developments (good or bad) we should know about?
- What's the average days-on-market for RENTAL listings here right now (not sales)? A rising rental-DOM trend means longer vacancies and softer asking-rent achievability than the comps imply.
- What's the recent tenant-quality profile in this submarket — average credit score on applications, eviction rate, late-payment / NSF rate, and stable-employment percentage? A property-management company in the area should have these aggregated.
- How much new for-sale + rental construction is in the pipeline within 1–3 miles? Heavy new supply typically softens prices + rents 12–24 months out; constrained supply supports both.
Investment metrics
- 1% rule
- 0.24% ✗
- Cap rate
- 1.27%
- Cash-on-cash
- -17.94%
- DSCR
- 0.20
- GRM
- 35.2
CMA / ARV
- ARV (on-the-fly)
- $205,100
- Comps found
- 9
Show comp detail 9 sales within ~0.75 mi
| Address | Dist | Beds/Ba | Sqft | Sold | Price | $/sf | Match |
|---|---|---|---|---|---|---|---|
| 3440 Rutz St | 0.19mi | 2/1.0 | 680 (-3%) | 11mo | $199,000 | $293 | 77 |
| 1843 Nomas St | 0.30mi | 3/1.0 (+1) | 728 (+4%) | 5mo | $200,000 | $275 | 70 |
| 3513 Rutz St | 0.23mi | 2/1.0 | 720 (+3%) | 19mo | $150,000 | $208 | 69 |
| 1407 Singleton Blvd | 0.24mi | 1/1.0 (-1) | 700 (0%) | 18mo | $150,000 | $214 | 69 |
| 1522 Life Ave | 0.29mi | 2/1.0 | 768 (+10%) | 10mo | $240,000 | $313 | 62 |
| 3623 Chicago St | 0.33mi | 2/1.0 | 744 (+6%) | 16mo | $199,900 | $269 | 60 |
| 815 Shaw St | 0.54mi | 2/1.0 | 734 (+5%) | 12mo | $224,900 | $306 | 57 |
| 1921 Nomas St | 0.38mi | 2/1.0 | 624 (-11%) | 19mo | $215,000 | $345 | 48 |
| 934 Muncie Ave | 0.61mi | 2/1.0 | 600 (-14%) | 15mo | $195,000 | $325 | 35 |
Match score weights: distance 35% · size 25% · config 20% · recency 20%. Top-matched comps best support the ARV.
Projected returns pro-forma
10.0% appreciation · 0.0% rent growth · sell at horizon
- IRR
- 11.6%
- Equity multiple
- 1.97×
- Total profit
- $175,870
- Equity at exit
- $585,391
- IRR
- 12.2%
- Equity multiple
- 4.55×
- Total profit
- $645,395
- Equity at exit
- $1,262,418
Cash invested: $181,944 (down + closing). Projections, not guarantees.
Landlord ↔ Tenant lean methodology
- Overall (STATE)
- 87 Strongly Landlord-Friendly
- State Texas
- 87 Strongly Landlord-Friendly · R+5
- County
- — inherits STATE
- City
- — inherits STATE
ZIP-level market 75212
- Rents YoY
- -4.2%
- Active inventory
- 249
- Price-to-rent
- 35.2×
Monthly cashflow live
- Estimated rent
- $1,540 high interval (Pro) →
- Mortgage (P&I)
- −$3,408
- Tax from tax record
- −$258 /mo · $3,095/yr
- Insurance
- −$271
- HOA
- −$0
- Vacancy / Maint / Mgmt
- −$323
- Net cashflow
- $-2,719
Break-even live
Sensitivity live
| Price | -10% $-2,352 | -5% $-2,535 | +0% $-2,719 | +5% $-2,903 | +10% $-3,087 |
|---|---|---|---|---|---|
| Rent | -10% $-2,841 | -5% $-2,780 | +0% $-2,719 | +5% $-2,658 | +10% $-2,598 |
| Rate | -1.0pp $-2,392 | -0.5pp $-2,554 | base $-2,719 | +0.5pp $-2,888 | +1.0pp $-3,059 |
UW: 25.0% down · 7.5% · 30yr · 1.5% tax · 5.0% vac · 8.0% maint · 8.0% mgmt
Financing live
Cash to close
- Down payment
- $162,450
- Closing costs
- $19,494
- Reserves months
- —
- Total cash needed
- —
Loan-product check · same deal, 3 products live
Conventional
25% down · 7.5% · 30yr
- Down + closing
- —
- Monthly P&I
- —
- Monthly cashflow
- —
- DSCR
- —
- Eligible?
- —
Personal DTI + credit; lowest rate.
DSCR
20% down · 8.5% · 30yr
- Down + closing
- —
- Monthly P&I
- —
- Monthly cashflow
- —
- DSCR
- —
- Eligible?
- —
No personal income docs; deal must DSCR.
Hard money
10% down · 12.0% · 12mo
- Down + closing
- —
- Monthly P&I
- —
- Monthly cashflow
- —
- DSCR
- —
- Eligible?
- —
Short-term bridge; refi at stabilization.
Rent comps 36 comps
| Address | Beds | Baths | Sqft | Rent | $/sqft | DOM | Units | Dist |
|---|---|---|---|---|---|---|---|---|
| 3113 Navaro St Unit N/A Dallas, TX | 2.0 | 2.0 | 735 | $1,800 | $2.45 | 45d | 1 | 0.16mi |
| 3113 Navaro St Dallas, TX | 2.0 | 2.0 | 735 | $1,600 | $2.18 | 26d | 1 | 0.16mi |
| 1600 Singleton Blvd Dallas, TX | 1.0 | 1.0 | 674 | $944 | $1.40 | 45d | 1 | 0.31mi |
| 1914 McBroom St Unit 3 Dallas, TX | 1.0 | 1.0 | 550 | $900 | $1.64 | 45d | 1 | 0.35mi |
| 2901 Borger St Apt 411 Dallas, TX | 1.0 | 1.0 | 622 | $1,273 | $2.05 | 0d | 1 | 0.36mi |
| 1010 Singleton Blvd Unit 412 Dallas, TX | 1.0 | 1.0 | 656 | $1,672 | $2.55 | 15d | 1 | 0.42mi |
| 1010 Singleton Blvd Unit 1025 Dallas, TX | 1.0 | 1.0 | 656 | $1,677 | $2.56 | 16d | 1 | 0.42mi |
| 1010 Singleton Blvd Unit 1052 Dallas, TX | 1.0 | 1.0 | 504 | $1,366 | $2.71 | 0d | 1 | 0.42mi |
| 990 Singleton Blvd Dallas, TX | 2.0 | 1.0–2.5 | 942 | $2,235 | $2.37 | 1d | 26 | 0.55mi |
| 500 Singleton Blvd Dallas, TX | 1.0 | 1.0 | 648 | $851 | $1.31 | 45d | 1 | 0.68mi |
| 716 W Commerce St Dallas, TX | 1.0 | 1.0 | 676 | $1,170 | $1.73 | 45d | 1 | 0.86mi |
| 707 Seale St Dallas, TX | 1.0 | 1.0 | 720 | $1,575 | $2.19 | 45d | 1 | 0.91mi |
| 320 Singleton Blvd Dallas, TX | 2.0 | 1.0–2.0 | 874 | $2,069 | $2.37 | 0d | 15 | 0.95mi |
| 718 Fort Worth Ave Dallas, TX | 1.0 | 1.0 | 744 | $1,391 | $1.87 | 45d | 1 | 0.98mi |
| 718 Fort Worth Ave Dallas, TX | 1.0 | 1.0 | 744 | $1,391 | $1.87 | 17d | 1 | 0.98mi |
| 455 W Commerce St Dallas, TX | 1.0 | 1.0 | 597 | $1,367 | $2.29 | 24d | 1 | 0.99mi |
| 455 W Commerce St Dallas, TX | 1.0 | 1.0 | 597 | $1,367 | $2.29 | 45d | 1 | 0.99mi |
| 400 W Main St Dallas, TX | 1.0 | 1.0 | 688 | $977 | $1.42 | 45d | 1 | 0.99mi |
| 604 Fort Worth Ave Dallas, TX | 1.0 | 1.0 | 725 | $1,300 | $1.79 | 45d | 1 | 1.01mi |
| 411 W Commerce St Dallas, TX | 3.0 | 1.0–3.0 | 1155 | $1,703 | $1.47 | 1d | 21 | 1.03mi |
| 400 W Commerce St Dallas, TX | 1.0 | 1.0 | 634 | $855 | $1.35 | 45d | 1 | 1.05mi |
| 1641 N Windomere Ave Dallas, TX | 1.0 | 1.0 | 700 | $1,500 | $2.14 | 45d | 1 | 1.06mi |
| 750 Fort Worth Ave Dallas, TX | 2.0 | 1.0–2.0 | 930 | $1,903 | $2.05 | 26d | 10 | 1.06mi |
| 750 Fort Worth Ave Dallas, TX | 3.0 | 1.0–2.0 | 1000 | $1,768 | $1.77 | 0d | 23 | 1.06mi |
| 660 Yorktown St Dallas, TX | 2.0 | 1.0–2.5 | 922 | $1,915 | $2.08 | 0d | 20 | 1.09mi |
| 444 W Commerce St Dallas, TX | 2.0 | 1.0–2.5 | 971 | $2,193 | $2.26 | 0d | 17 | 1.09mi |
| 305 W Commerce St Dallas, TX | 2.0 | 1.0–2.0 | 874 | $1,976 | $2.26 | 0d | 28 | 1.11mi |
| 120 Turtle Creek Blvd Dallas, TX | 2.0 | 1.0–2.0 | 920 | $2,203 | $2.39 | 0d | 28 | 1.22mi |
| 200 W Commerce St Dallas, TX | 2.0 | 1.0–2.0 | 849 | $2,177 | $2.56 | 0d | 30 | 1.33mi |
| 1330 Winding Brook Ln Unit 1345 Dallas, TX | 1.0 | 1.0 | 627 | $1,329 | $2.12 | 0d | 1 | 1.36mi |
| 1902 Tarrant Pl Dallas, TX | 1.0–2.0 | 1.0 | 795 | $1,593 | $2.00 | 1d | 18 | 1.38mi |
| 2350 N Beckley Ave Apt 412 Dallas, TX | 1.0 | 1.0 | 727 | $1,547 | $2.13 | 14d | 1 | 1.45mi |
| 2350 N Beckley Ave Unit 2365 Dallas, TX | 1.0 | 1.0 | 672 | $1,570 | $2.34 | 16d | 1 | 1.45mi |
| 2350 N Beckley Ave Unit 2365 Dallas, TX | 1.0 | 1.0 | 727 | $1,547 | $2.13 | 0d | 1 | 1.45mi |
| 1955 Market Center Blvd Dallas, TX | 1.0–2.0 | 1.0–2.0 | 927 | $2,001 | $2.16 | 0d | 24 | 1.49mi |
| 1931 Market Center Blvd Dallas, TX | 2.0 | 1.0–2.0 | 906 | $2,281 | $2.52 | 0d | 36 | 1.49mi |
Listing history 8 events
-
2026-06-21days on market $649,800 Active 12 DOM
-
2026-06-18days on market $649,800 Active 9 DOM
-
2026-06-17days on market $649,800 Active 8 DOM
-
2026-06-16days on market $649,800 Active 7 DOM
-
2026-06-15days on market $649,800 Active 6 DOM
-
2026-06-13days on market $649,800 Active 4 DOM
-
2026-06-10remarks 679-char remark
-
2026-06-10$649,800 Active 1 DOM
ⓘ Source: listings_history table (triggers on properties + properties_extension) + one-shot
backfill from property_details.listing_events for pre-trigger history.
Tax reassessment forecast TX · Resets to sale price
- Current annual tax
- $3,095 · $258/mo
- Projected year-2 tax
- $11,891 · $991/mo
- Expected delta
- +$8,796/yr (+$733/mo · 284.2%)
ⓘ Screening estimate from a state-policy table — verify with the county assessor before closing.
Climate risk First Street
- Flood 1/10 Low FEMA zone X · 0% chance over 30 yrs
- Wildfire 1/10 Low
- Heat 8/10 Severe 7 d/yr ≥109°F today · 23 d/yr by 30 yrs out
- Wind 6/10 Major 27% chance of damaging wind over 30 yrs
- Air quality 3/10 Moderate 2 unhealthy d/yr today · 3 by 30 yrs out
Nearby sold comps map
Loading sold comps map…
Walkable amenities ~0.75 mi
Loading nearby amenities…
Taxation est. · year 1
- Rental income
- $18,485
- − Mortgage interest
- −$36,399
- − Property taxes
- −$3,095
- − Insurance
- −$3,249
- − Repairs & maintenance
- −$1,479
- − Management
- −$1,479
- − Depreciation
- −$18,903
- Taxable loss
- −$46,119
- Est. tax savings @ 24.0%
- +$11,068
- After-tax cash flow
- $-21,564/yr
For passive investors: Depreciation is non-cash, so a rental often shows a tax loss while cash-flowing — sheltering income. Rental losses are passive: they offset passive income freely, and up to $25,000/yr can offset ordinary (W-2) income if you actively participate and your MAGI is under $100k (phasing out to $0 by $150k); unused losses carry forward. On sale, claimed depreciation is recaptured at up to 25%, and gains may owe capital-gains tax (a 1031 exchange can defer both). Figures are a year-1 estimate at your 24.0% rate — not tax advice; consult a CPA.
Schools (NCES district)
- District
- Dallas ISD
- NCES district ID
- 4816230
- Math proficiency
- 31% ▼ -16.00%
- Reading proficiency
- 36% ▼ -4.00%
- Median HH income
- $42,881
- Composite
- 28.41/100
- National rank
- #6763
- State rank
- #559 of 826 in TX
Livability — Dallas
- Score
- 81/100
- State rank
- #24
- US rank
- #1380
Category grades
Schools grade is shown separately in the Schools card above.
Census & demographics
- Census place
- Dallas, TX
- County
- Dallas County · 2,612,404 people
- City population
- 1,168,437
- Metro
- Dallas-Fort Worth-Arlington, TX
- Population (ZIP)
- 28,259
- Household income
- $59,750
- Rent vs Own
- Severe rent burden
- 892.0
Population outlook (Dallas County) Hauer SSP2
- Today (2025)
- 2,979,839 people
- By 2030
- 3,191,823 · +7.1%
- By 2040
- 3,619,611 · +21.5%
- By 2050
- 4,026,915 · +35.1%
- By 2075
- 4,957,073 · +66.4%
- By 2100
- 5,508,725 · +84.9%
Race, ethnicity, and origin ACS 2023
- Neighborhood character
- Predominantly Hispanic (67%)
- Race & ethnicity
- Hispanic / Latino 67% Two or more races 26% Black 23% White 6% Asian 2%
- Hispanic origin (detail)
- Mexican 55%
- Common ancestry
- Slovak 1%
- Foreign-born
- 27% · Canada, Vietnam, Jamaica
- Languages at home
- 42% English-only · Spanish 52% Vietnamese 1%
Political lean MEDSL · Dallas
- 2024 margin
- Strong D (+22.2) · D 60.2% · R 38.0% · Other 1.8%
- 2008→2024 swing
- +6.9pp toward D · 2008: 15.3pp · 2024: 22.2pp
- All cycles
- 2024: D+22.2 2020: D+31.6 2016: D+26.2 2012: D+15.4 2008: D+15.3
Not yet ingested
- Civics
- —
Market trends
- HPI YoY
- ▲ 138.69%
- Current HPI
- 477.2035
- Rent YoY
- ▼ -4.21%
- Metro
- Dallas-Fort Worth-Arlington, TX
- State GDP YoY
- ▲ 3.95%
- F500 in state
- 110
Industry mix (Fortune 500 HQ in TX)
| Industry | F500 HQs | Revenue |
|---|---|---|
| Energy | 16 | $1,198B |
|
||
| Technology | 5 | $198B |
|
||
| Engineering / Construction | 4 | $72B |
|
||
| Energy Services | 3 | $60B |
|
||
| Utilities | 3 | $41B |
|
||
| Healthcare | 2 | $330B |
|
||
Price history
3 events — show timeline
- 2026-06-09 Listed $649,800 NTREIS
- 2024-03-29 Sold (Public Records) — Public Records
- 2001-05-10 Sold (Public Records) — Public Records
Property tax history
+13.4%/yrLatest (2025): $3,095 · -29.3% YoY. Source: county tax records.
Cash-flow waterfall
monthlySold comps — $/sqft
last 12 mo · ≤1 miLoading sold comps…